

Histone acylation marks respond to metabolic perturbations and enable cellular adaptation
- PMID: 33311704
- PMCID: PMC8080766
- DOI: 10.1038/s12276-020-00539-x
Histone acylation marks respond to metabolic perturbations and enable cellular adaptation
Abstract
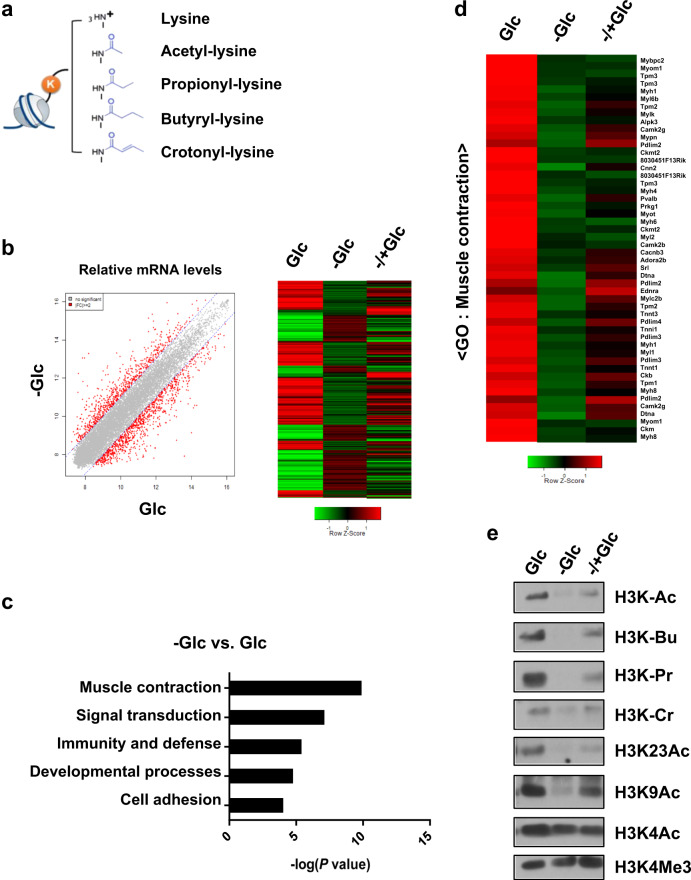
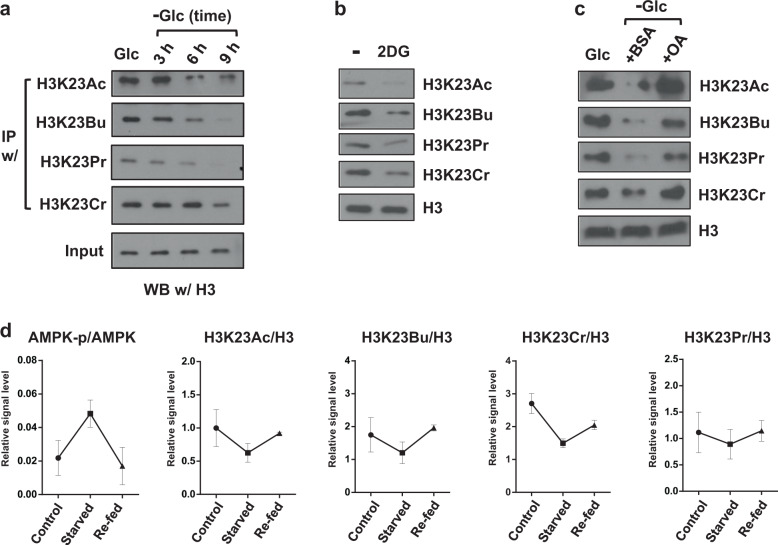
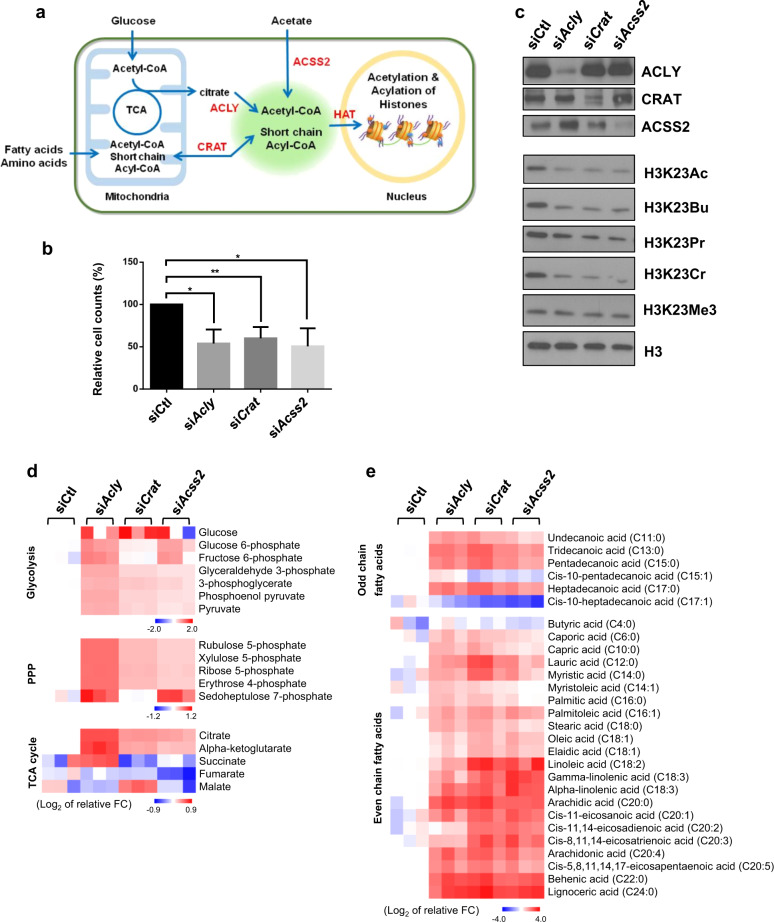
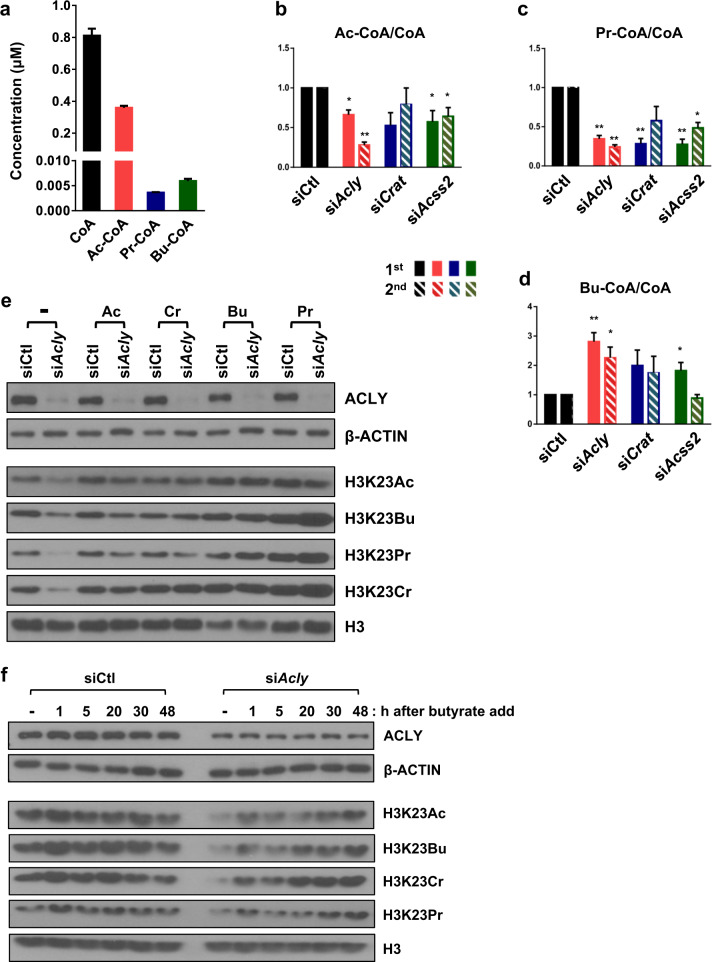
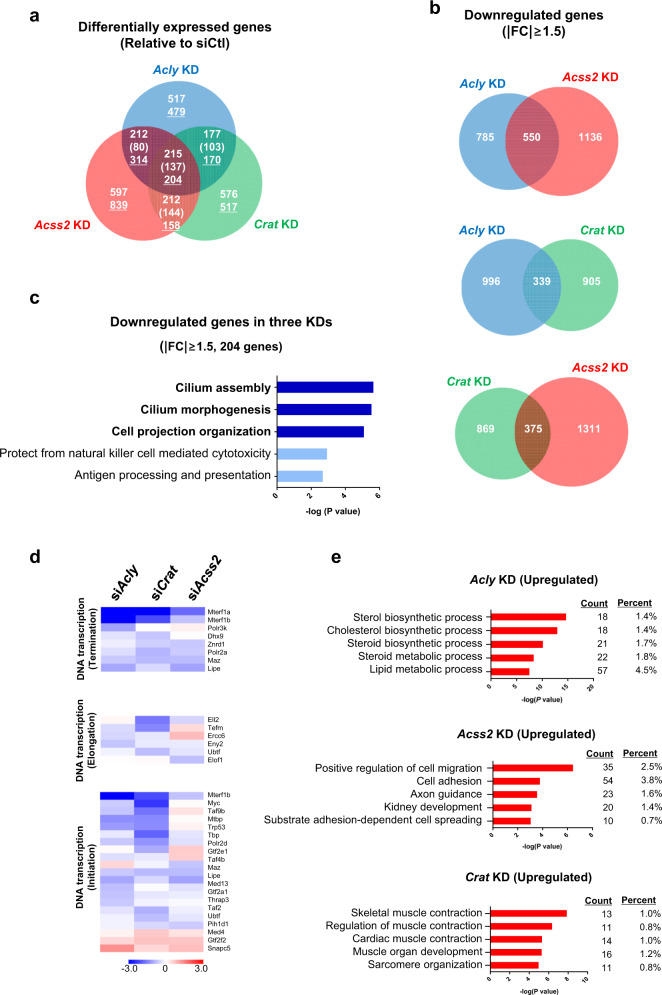
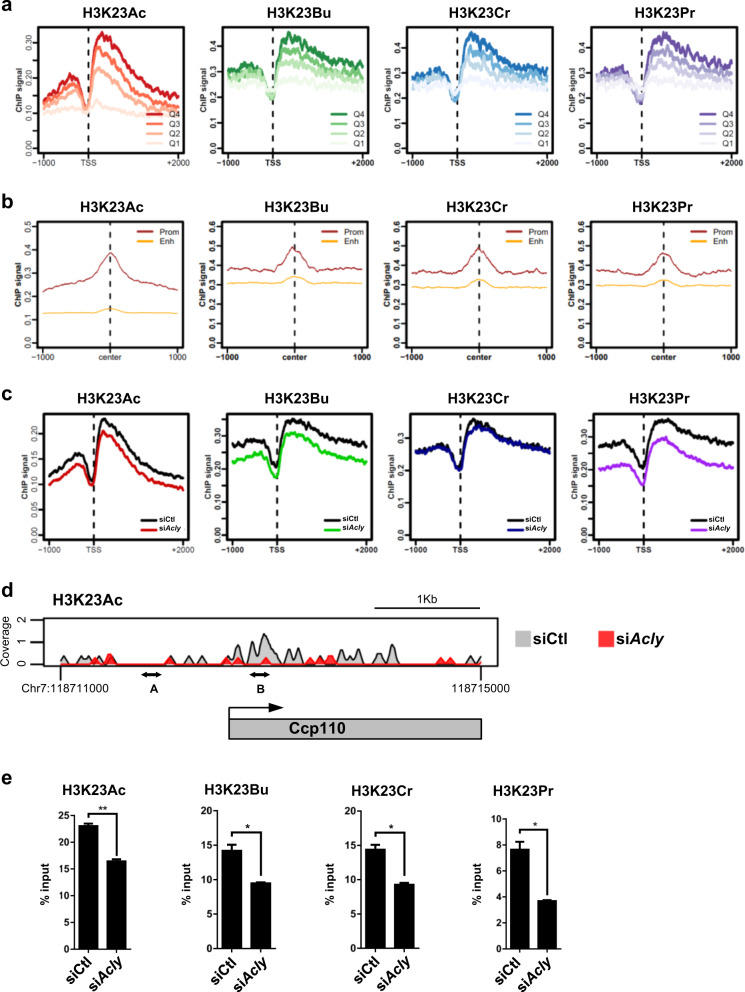
Acetylation is the most studied histone acyl modification and has been recognized as a fundamental player in metabolic gene regulation, whereas other short-chain acyl modifications have only been recently identified, and little is known about their dynamics or molecular functions at the intersection of metabolism and epigenetic gene regulation. In this study, we aimed to understand the link between nonacetyl histone acyl modification, metabolic transcriptional regulation, and cellular adaptation. Using antibodies specific for butyrylated, propionylated, and crotonylated H3K23, we analyzed dynamic changes of H3K23 acylation upon various metabolic challenges. Here, we show that H3K23 modifications were highly responsive and reversibly regulated by nutrient availability. These modifications were commonly downregulated by the depletion of glucose and recovered based on glucose or fatty acid availability. Depletion of metabolic enzymes, namely, ATP citrate lyase, carnitine acetyltransferase, and acetyl-CoA synthetase, which are involved in Ac-CoA synthesis, resulted in global loss of H3K23 butyrylation, crotonylation, propionylation, and acetylation, with a profound impact on gene expression and cellular metabolic states. Our data indicate that Ac-CoA/CoA and central metabolic inputs are important for the maintenance of histone acylation. Additionally, genome-wide analysis revealed that acyl modifications are associated with gene activation. Our study shows that histone acylation acts as an immediate and reversible metabolic sensor enabling cellular adaptation to metabolic stress by reprogramming gene expression.
Conflict of interest statement
The authors declare that they have no conflict of interest.
Figures
Similar articles
-
Compartmentalised acyl-CoA metabolism and roles in chromatin regulation.Mol Metab. 2020 Aug;38:100941. doi: 10.1016/j.molmet.2020.01.005. Epub 2020 Feb 14. Mol Metab. 2020. PMID: 32199817 Free PMC article. Review.
-
Metabolic regulation of gene expression through histone acylations.Nat Rev Mol Cell Biol. 2017 Feb;18(2):90-101. doi: 10.1038/nrm.2016.140. Epub 2016 Dec 7. Nat Rev Mol Cell Biol. 2017. PMID: 27924077 Free PMC article. Review.
-
Integrated Analysis of Acetyl-CoA and Histone Modification via Mass Spectrometry to Investigate Metabolically Driven Acetylation.Methods Mol Biol. 2019;1928:125-147. doi: 10.1007/978-1-4939-9027-6_9. Methods Mol Biol. 2019. PMID: 30725455 Free PMC article.
-
Histone propionylation is a mark of active chromatin.Nat Struct Mol Biol. 2017 Dec;24(12):1048-1056. doi: 10.1038/nsmb.3490. Epub 2017 Oct 23. Nat Struct Mol Biol. 2017. PMID: 29058708
-
Propionate hampers differentiation and modifies histone propionylation and acetylation in skeletal muscle cells.Mech Ageing Dev. 2021 Jun;196:111495. doi: 10.1016/j.mad.2021.111495. Epub 2021 Apr 28. Mech Ageing Dev. 2021. PMID: 33932454
Cited by
-
Lipid Metabolism and Epigenetics Crosstalk in Prostate Cancer.Nutrients. 2022 Feb 18;14(4):851. doi: 10.3390/nu14040851. Nutrients. 2022. PMID: 35215499 Free PMC article. Review.
-
A chemical catalyst enabling histone acylation with endogenous acyl-CoA.Nat Commun. 2023 Sep 22;14(1):5790. doi: 10.1038/s41467-023-41426-z. Nat Commun. 2023. PMID: 37737243 Free PMC article.
-
Interplay between altered metabolism and DNA damage and repair in ovarian cancer.Bioessays. 2024 Aug;46(8):e2300166. doi: 10.1002/bies.202300166. Epub 2024 Jun 14. Bioessays. 2024. PMID: 38873912 Free PMC article. Review.
-
Metabotissugenic citrate biomaterials orchestrate bone regeneration via citrate-mediated signaling pathways.Sci Adv. 2025 Jul 25;11(30):eady2862. doi: 10.1126/sciadv.ady2862. Epub 2025 Jul 23. Sci Adv. 2025. PMID: 40700481 Free PMC article.
-
Single-Cell RNA Sequencing Reveals Differences in Chromatin Remodeling and Energy Metabolism among In Vivo-Developed, In Vitro-Fertilized, and Parthenogenetically Activated Embryos from the Oocyte to 8-Cell Stages in Pigs.Animals (Basel). 2024 Jan 31;14(3):465. doi: 10.3390/ani14030465. Animals (Basel). 2024. PMID: 38338108 Free PMC article.
References
-
- Kouzarides T. Chromatin modifications and their function. Cell. 2007;128:693–705. - PubMed
-
- Choudhary C, Weinert BT, Nishida Y, Verdin E, Mann M. The growing landscape of lysine acetylation links metabolism and cell signalling. Nat. Rev. Mol. Cell Biol. 2014;15:536–550. - PubMed
-
- Pietrocola F, Galluzzi L, Bravo-San Pedro JM, Madeo F, Kroemer G. Acetyl coenzyme A: a central metabolite and second messenger. Cell Metab. 2015;21:805–821. - PubMed
Publication types
MeSH terms
Substances
LinkOut - more resources
Full Text Sources
