. 2020 Nov 23;23(12):101850.
doi: 10.1016/j.isci.2020.101850. eCollection 2020 Dec 18.

Population-Matched Transcriptome Prediction Increases TWAS Discovery and Replication Rate

Affiliations

Population-Matched Transcriptome Prediction Increases TWAS Discovery and Replication Rate

Elyse Geoffroy et al. iScience. .

Abstract

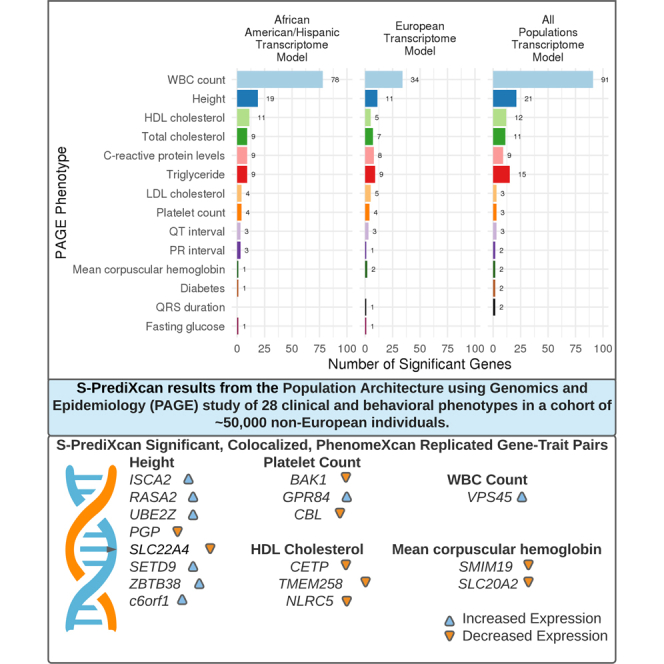
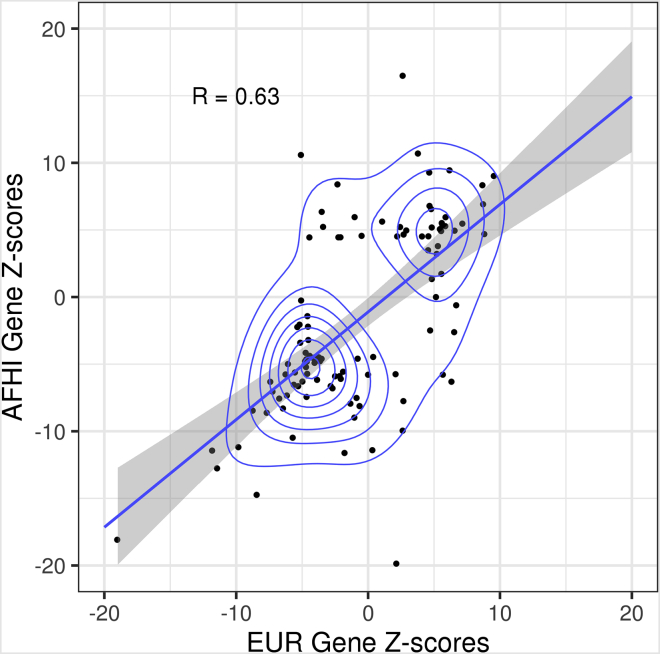
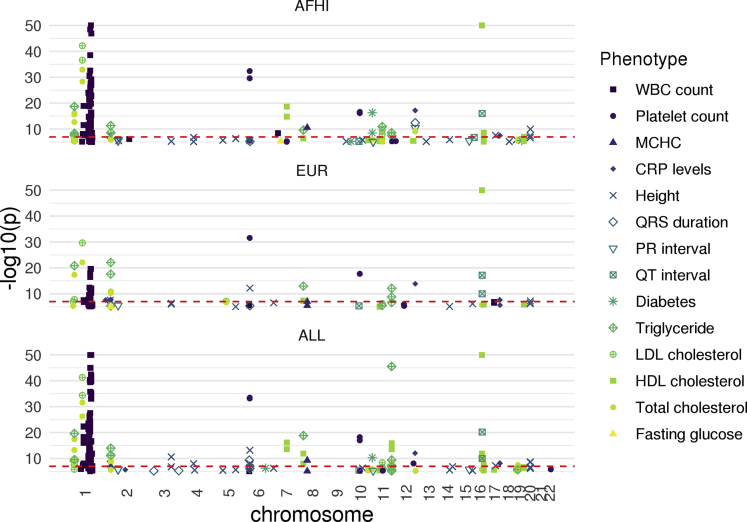
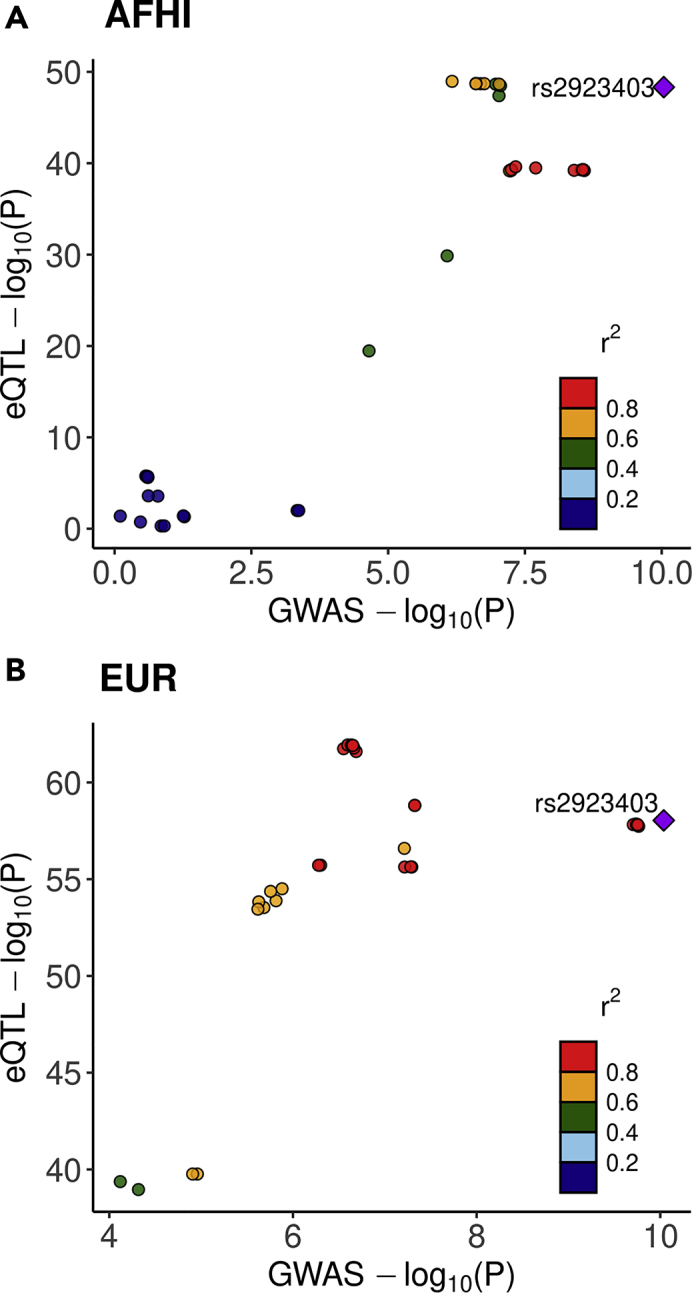
Most genome-wide association studies (GWAS) and transcriptome-wide association studies (TWAS) focus on European populations; however, these results cannot always be accurately applied to non-European populations due to genetic architecture differences. Using GWAS summary statistics in the Population Architecture using Genomics and Epidemiology study, which comprises ∼50,000 Hispanic/Latinos, African Americans, Asians, Native Hawaiians, and Native Americans, we perform TWAS to determine gene-trait associations. We compared results using three transcriptome prediction models derived from Multi-Ethnic Study of Atherosclerosis populations: the African American and Hispanic/Latino (AFHI) model, the European (EUR) model, and the African American, Hispanic/Latino, and European (ALL) model. We identified 240 unique significant trait-associated genes. We found more significant, colocalized genes that replicate in larger cohorts when applying the AFHI model than the EUR or ALL model. Thus, TWAS with population-matched transcriptome models have more power for discovery and replication, demonstrating the need for more transcriptome studies in diverse populations.

Keywords: Genetics; Genomics; Human Genetics; Population.


Conflict of interest statement

The authors declare no competing interests.

Figures

None
Graphical abstract
Figure 1
Figure 1
Z score Comparison of TWAS Significant Genes Identified by AFHI and EUR MESA Transcriptome Prediction Models in PAGE Gene-trait pairs that were identified as significant (P < 0.05/n, n = the number of genes in the transcriptome model tested in S-PrediXcan) by either model are displayed. The Pearson correlation of displayed gene-trait pairs is shown in the upper left corner (R = 0.63). AFHI = African American and Hispanic/Latino transcriptome prediction model; EUR = European transcriptome prediction model; MESA = Multi-Ethnic Study of Atherosclerosis; PAGE = Population Architecture using Genomics and Epidemiology study.
Figure 2
Figure 2
Manhattan Plot of the 14 of 28 PAGE Phenotypes Tested that Returned Significant TWAS Gene-Trait Pairs Using the AFHI, EUR, and ALL MESA Gene Expression Prediction Models Each point represents the -log10(p) of a gene association test and gene chromosomal position colored by phenotype. Only significant gene-trait pairs are shown (P < 0.05/n, n = the number of genes in the transcriptome model tested in S-PrediXcan). The dotted line is at the more conservative significance threshold calculated using all tests (P < 1.1 × 10−7). 11 phenotypes have gene associations that meet this more stringent threshold. Using the AFHI, EUR, and ALL models, we identified 95, 46, and 121 significant gene-trait pairs, respectively, at this threshold. Gene-trait pairs with P < 1e-50 are displayed at P = 1e-50 for readability. AFHI = African American and Hispanic/Latino transcriptome prediction model; EUR = European transcriptome model; ALL = African American, Hispanic/Latino, and European transcriptome model; MCHC = mean corpuscular hemoglobin concentration; CRP levels = c-reactive protein levels; WBC count = white blood cell count; MESA = Multi-Ethnic Study of Atherosclerosis; PAGE = Population Architecture using Genomics and Epidemiology study.
Figure 3
Figure 3
SMIM19 GWAS and eQTL Signals are Colocalized in AFHI, but not EUR LocusCompare (Liu et al., 2019) plots for mean corpuscular hemoglobin concentration (MCHC) PAGE GWAS p values compared to (A) AFHI MESA eQTL p values and (B) EUR MESA eQTL p values of SNPs in the SMIM19 prediction models. When most points are located on the diagonal, it indicates the GWAS and eQTL signals are likely colocalized. The lead SNP in the AFHI eQTL and PAGE GWAS, rs2923403, is located among the top signals and in the upper right corner, supporting the COLOC evidence for colocalization AFHI (P4 = 0.90). When using EUR eQTL data in COLOC, the GWAS and eQTL signals did not colocalize (EUR P4 = 0.047). Points are colored according to the pairwise LD r2 with rs2923403 in (A) AMR and (B) EUR 1000 Genomes populations.

References

    1. Akiyama M., Ishigaki K., Sakaue S., Momozawa Y., Horikoshi M., Hirata M., Matsuda K., Ikegawa S., Takahashi A., Kanai M. Characterizing rare and low-frequency height-associated variants in the Japanese population. Nat. Commun. 2019;10:4393. - PMC - PubMed
    1. Andaleon A., Mogil L.S., Wheeler H.E. Genetically regulated gene expression underlies lipid traits in Hispanic cohorts. PLoS One. 2019;14:e0220827. - PMC - PubMed
    1. Astle W.J., Elding H., Jiang T., Allen D., Ruklisa D., Mann A.L., Mead D., Bouman H., Riveros-Mckay F., Kostadima M.A. The allelic landscape of human blood cell trait variation and links to common complex disease. Cell. 2016;167 1415–e19. - PMC - PubMed
    1. Barbeira A.N., Dickinson S.P., Bonazzola R., Zheng J., Wheeler H.E., Torres J.M., Torstenson E.S., Shah K.P., Garcia T., Edwards T.L. Exploring the phenotypic consequences of tissue specific gene expression variation inferred from GWAS summary statistics. Nat. Commun. 2018;9:1825. - PMC - PubMed
    1. Barbeira A.N., Pividori M., Zheng J., Wheeler H.E., Nicolae D.L., Im H.K. Integrating predicted transcriptome from multiple tissues improves association detection. PLoS Genet. 2019;15:e1007889. - PMC - PubMed

LinkOut - more resources