. 2020 Feb 4:2020:4216373.
doi: 10.34133/2020/4216373. eCollection 2020.

Semantic Segmentation of Sorghum Using Hyperspectral Data Identifies Genetic Associations

Affiliations

Semantic Segmentation of Sorghum Using Hyperspectral Data Identifies Genetic Associations

Chenyong Miao et al. Plant Phenomics. .

Abstract

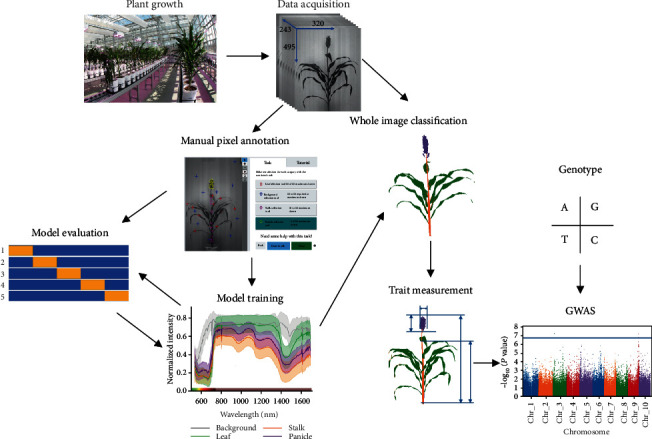
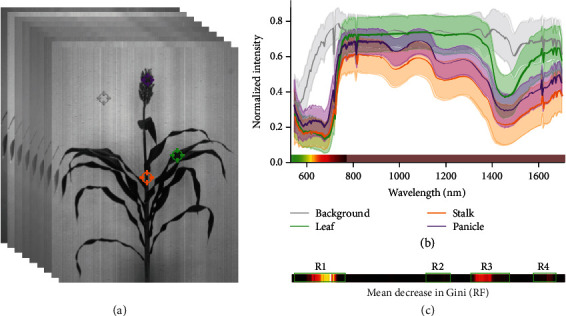
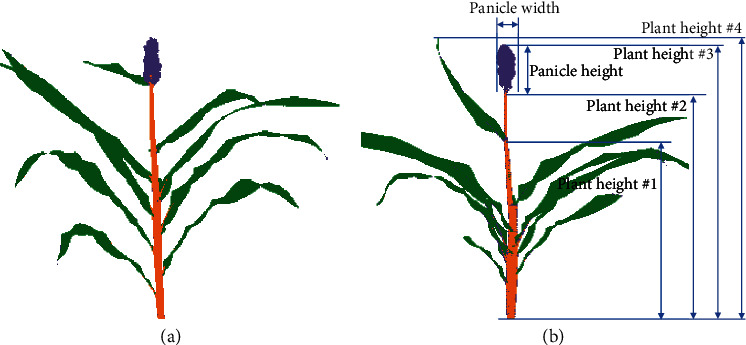
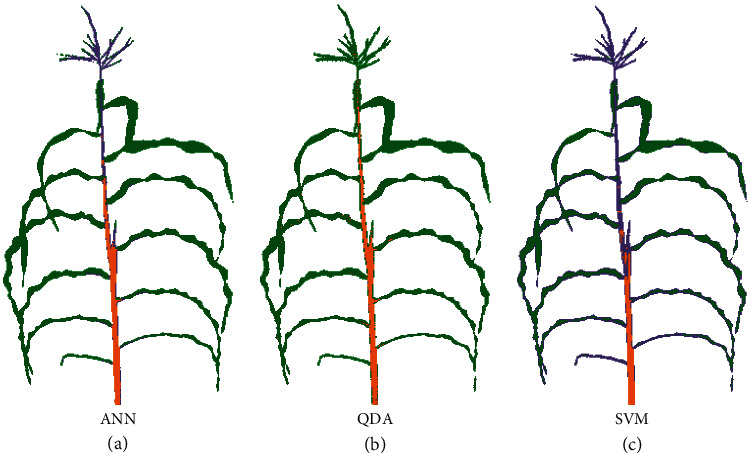
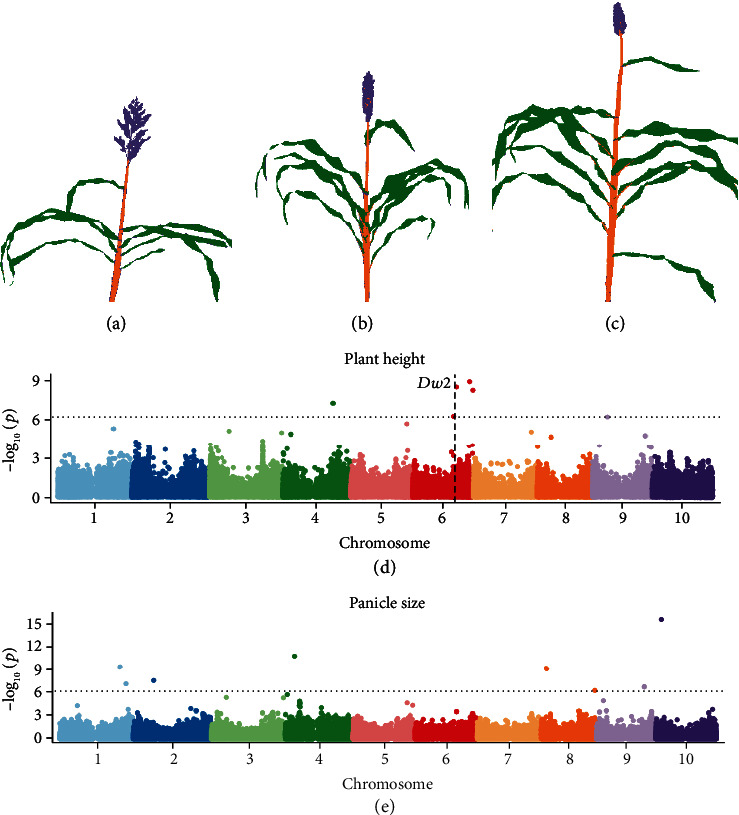
This study describes the evaluation of a range of approaches to semantic segmentation of hyperspectral images of sorghum plants, classifying each pixel as either nonplant or belonging to one of the three organ types (leaf, stalk, panicle). While many current methods for segmentation focus on separating plant pixels from background, organ-specific segmentation makes it feasible to measure a wider range of plant properties. Manually scored training data for a set of hyperspectral images collected from a sorghum association population was used to train and evaluate a set of supervised classification models. Many algorithms show acceptable accuracy for this classification task. Algorithms trained on sorghum data are able to accurately classify maize leaves and stalks, but fail to accurately classify maize reproductive organs which are not directly equivalent to sorghum panicles. Trait measurements extracted from semantic segmentation of sorghum organs can be used to identify both genes known to be controlling variation in a previously measured phenotypes (e.g., panicle size and plant height) as well as identify signals for genes controlling traits not previously quantified in this population (e.g., stalk/leaf ratio). Organ level semantic segmentation provides opportunities to identify genes controlling variation in a wide range of morphological phenotypes in sorghum, maize, and other related grain crops.


Conflict of interest statement

The authors declare that there is no conflict of interest regarding the publication of this article.

Figures

Figure 1
Figure 1
Steps involved in data acquisition, annotation, model training and evaluation, and genetic association analyses described in this study.
Figure 2
Figure 2
Distinct reflectance patterns of manually classified hyperspectral pixels. (a) A representation of a hyperspectral data cube with 254 image bands from 546 nm to 1700 nm. Example background, leaf, stalk, and panicle points highlighted in gray, green, orange, and purple, respectively. (b) Generalized reflectance patterns of leaf, stalk, panicle, and background pixels across wavelengths. Average reflectance intensity at each wavelength is indicated with a solid line, while the standard deviation among pixels belonging to that class is indicated by semitransparent bands. The blue portion of the visible spectrum 380-545 nm was not captured by this particular hyperspectral camera. The remaining portion of visible spectrum 546-780 nm or approximately green to red is indicated immediately above the x-axis. Infrared 780-1700 is indicated in the same color bar as pale brown. (c) Estimated feature importance for individual hyperspectral bands in random forest models indicated using the same x-axis scale of wavelengths used in (b).
Figure 3
Figure 3
Whole image semantic segmentation of sorghum plants. (a) An example of a single sorghum plant with each pixel classified as either background (white), leaf (green), stalk (orange), or panicle (purple) using the LDA classifier described in Table 1. (b) Examples of a number of morphological traits which may be estimated using a semantically segmented sorghum image. Examples of four different definitions of plant height used by different researchers are indicated as follows: #1: height to flag leaf collar, #2: stalk height, #3: height to apex, and #4: height to the tallest point.
Figure 4
Figure 4
Example outcomes when classifying maize images using models trained on sorghum. (a) Whole image segmentation of a maize plant at flowering—genotype A635—using the best-performing sorghum-trained ANN as determined by cross validation accuracy in sorghum. Pixels predicted by the model to be background, leaf, stalk, and panicle are indicated in white, green, orange, and purple. (b) Whole image segmentation of the same maize plant by a QDA model trained on sorghum data. (c) Whole image segmentation of the same maize plant by a SVM model trained on sorghum data.
Figure 5
Figure 5
Mapping genomic regions controlling variation in sorghum phenotypes. (a–c) Examples of LDA-segmented sorghum plant images with short (a), medium (b), and tall (c) heights to apex and small (c), medium (b), and large (a) panicle sizes. (d) Results from a genome-wide association study for plant height to apex measured using results from LDA segmentation of images of 227 sorghum plants. The horizontal dashed line indicates a Bonferroni multiple testing-corrected threshold for statistical significance equivalent to P = 0.05. The vertical dashed line indicates the genomic location of dwarf2, a gene known to control variation in plant height in sorghum. (e) Results from a genome-wide association study for panicle size measured using results from LDA segmentation of images of 227 sorghum plants.

References

    1. Hedden P. The genes of the green revolution. Trends in Genetics. 2003;19(1):5–9. doi: 10.1016/s0168-9525(02)00009-4. - DOI - PubMed
    1. Quinby J. R., Karper R. E. Inheritance of height in sorghum. Agronomy Journal. 1954;36:211–216.
    1. Duvick D. Genetic progress in yield of united states maize (zea mays l.) Maydica. 2005;50:p. 193.
    1. Pepper G. E., Pearce R. B., Mock J. J. Leaf orientation and yield of maize 1. Crop Science. 1977;17(6):883–886. doi: 10.2135/cropsci1977.0011183X001700060017x. - DOI
    1. Hay R. K. M. Harvest index: a review of its use in plant breeding and crop physiology. Annals of Applied Biology. 1995;126(1):197–216. doi: 10.1111/j.1744-7348.1995.tb05015.x. - DOI

LinkOut - more resources