. 2021 Apr 1;36(22-23):5535-5536.
doi: 10.1093/bioinformatics/btaa1011.

dittoSeq: universal user-friendly single-cell and bulk RNA sequencing visualization toolkit

Affiliations

dittoSeq: universal user-friendly single-cell and bulk RNA sequencing visualization toolkit

Daniel G Bunis et al. Bioinformatics. .

Abstract

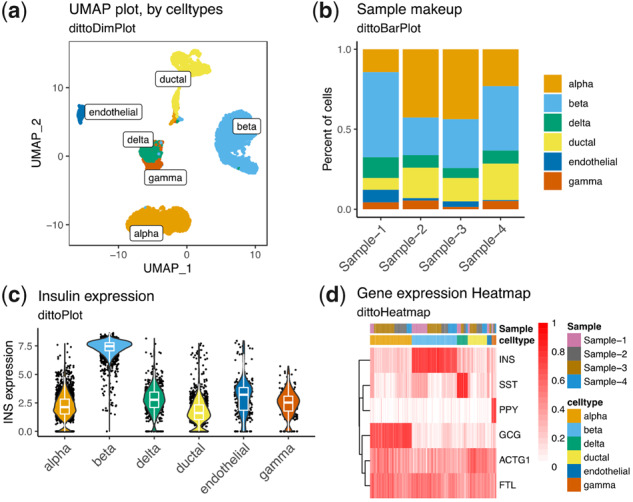
Summary: A visualization suite for major forms of bulk and single-cell RNAseq data in R. dittoSeq is color blindness-friendly by default, robustly documented to power ease-of-use and allows highly customizable generation of both daily-use and publication-quality figures.

Availability and implementation: dittoSeq is an R package available through Bioconductor via an open source MIT license.

Supplementary information: Supplementary data are available at Bioinformatics online.


Figures

Fig. 1.
Fig. 1.
dittoSeq offers a plethora of highly customizable visualization options. Data for these figures come from Baron et al. (2016), subset to only some of the most common cell types for simplicity, then processed with a standard Seurat workflow. Plots were made with (a) dittoDimPlot, (b) dittoBarPlot, (c) dittoPlot and (d) dittoHeatmap. Data are available in the Gene Expression Omnibus at www.ncbi.nlm.nih.gov/geo and and can be accessed with GSE84133.

References

    1. Amezquita R.A. et al. (2020) Orchestrating single-cell analysis with Bioconductor. Nat. Methods, 17, 137–145. - PMC - PubMed
    1. Baron M. et al. (2016) A single-cell transcriptomic map of the human and mouse pancreas reveals inter- and intra-cell population structure. Cells, 3, 346–360.e4. - PMC - PubMed
    1. Butler A. et al. (2018) Integrating single-cell transcriptomic data across different conditions, technologies, and species. Nat. Biotechnol., 36, 411–420. - PMC - PubMed
    1. Love M.I. et al. (2014) Moderated estimation of fold change and dispersion for RNA-seq data with DESeq2. Genome Biol., 15, 550. - PMC - PubMed
    1. Robinson M.D. et al. (2010) edgeR: a Bioconductor package for differential expression analysis of digital gene expression data. Bioinformatics, 26, 139–140. - PMC - PubMed