. 2021 Sep;12(9):717-733.
doi: 10.1007/s13238-020-00811-w. Epub 2020 Dec 12.

Host metabolism dysregulation and cell tropism identification in human airway and alveolar organoids upon SARS-CoV-2 infection

Affiliations

Host metabolism dysregulation and cell tropism identification in human airway and alveolar organoids upon SARS-CoV-2 infection

Rongjuan Pei et al. Protein Cell. 2021 Sep.

Abstract

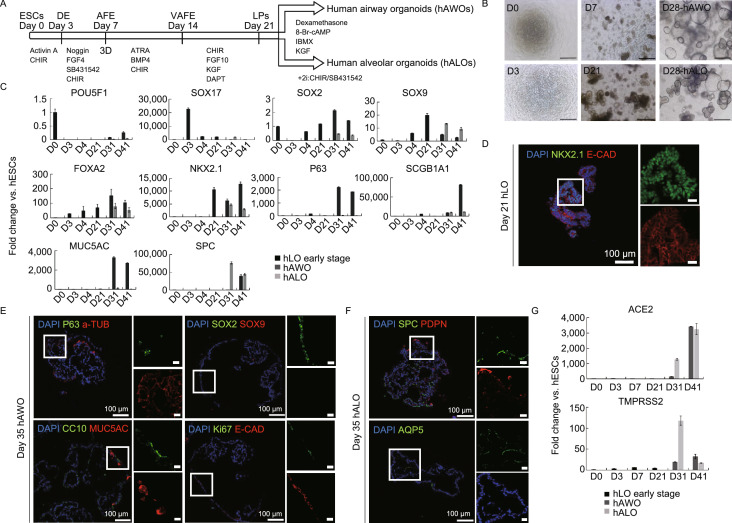
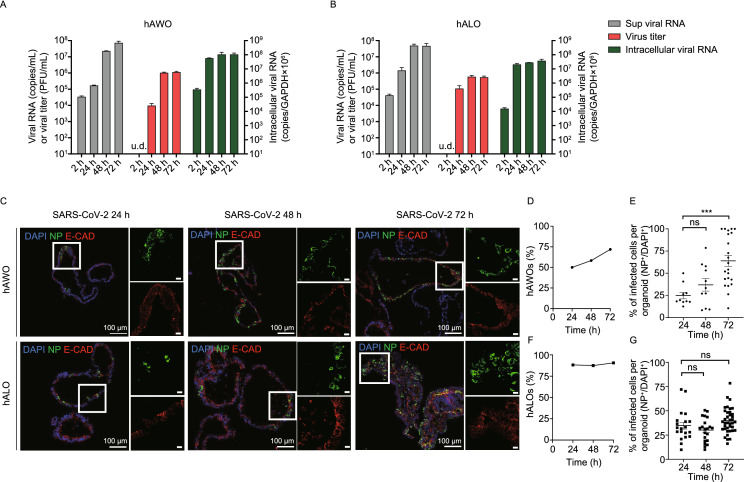
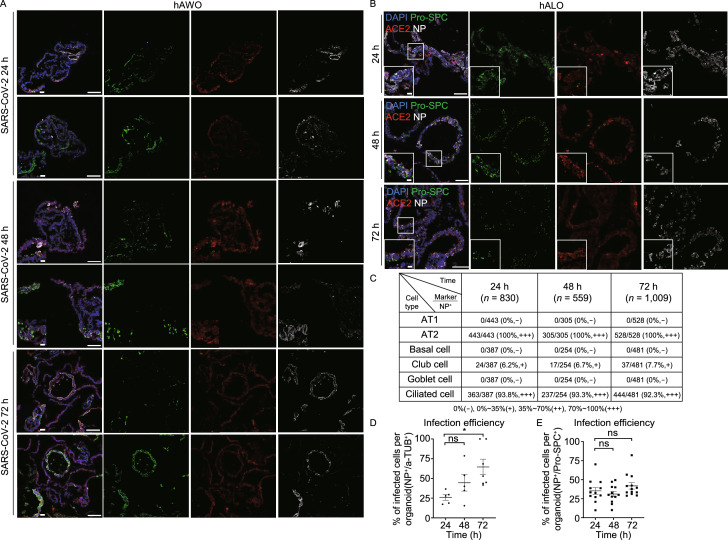
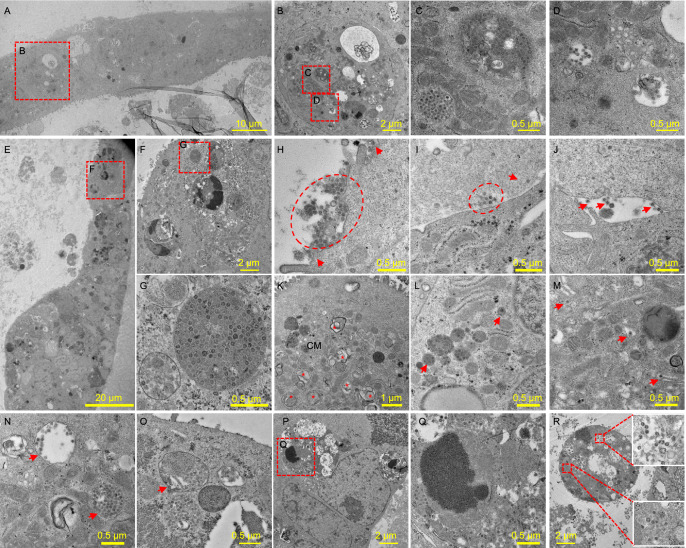
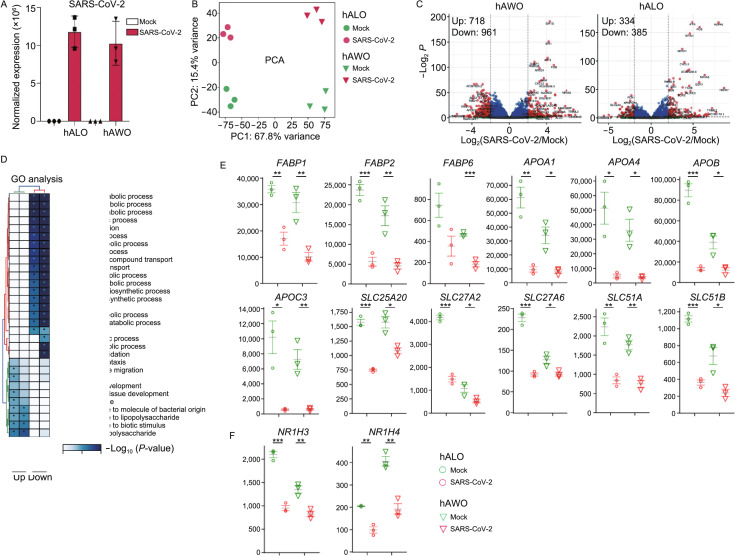
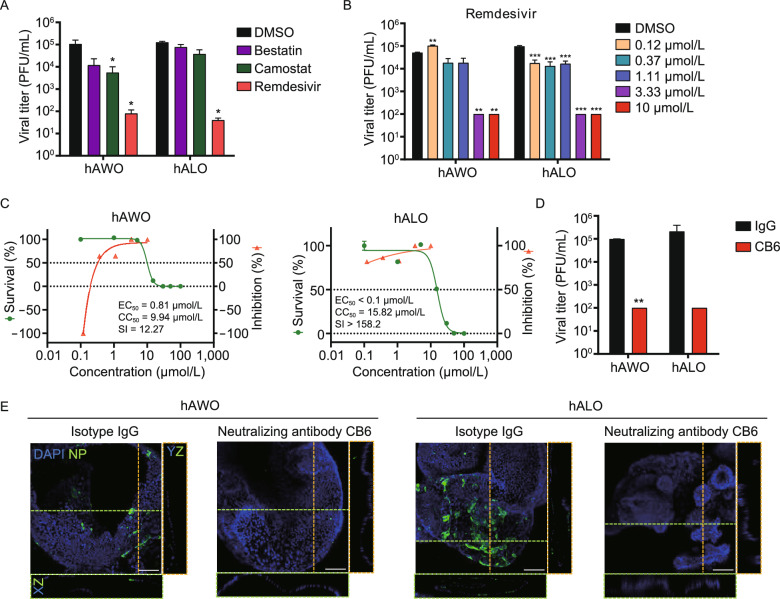
The coronavirus disease 2019 (COVID-19) pandemic is caused by infection with the severe acute respiratory syndrome coronavirus 2 (SARS-CoV-2), which is spread primary via respiratory droplets and infects the lungs. Currently widely used cell lines and animals are unable to accurately mimic human physiological conditions because of the abnormal status of cell lines (transformed or cancer cells) and species differences between animals and humans. Organoids are stem cell-derived self-organized three-dimensional culture in vitro and model the physiological conditions of natural organs. Here we showed that SARS-CoV-2 infected and extensively replicated in human embryonic stem cells (hESCs)-derived lung organoids, including airway and alveolar organoids which covered the complete infection and spread route for SARS-CoV-2 within lungs. The infected cells were ciliated, club, and alveolar type 2 (AT2) cells, which were sequentially located from the proximal to the distal airway and terminal alveoli, respectively. Additionally, RNA-seq revealed early cell response to virus infection including an unexpected downregulation of the metabolic processes, especially lipid metabolism, in addition to the well-known upregulation of immune response. Further, Remdesivir and a human neutralizing antibody potently inhibited SARS-CoV-2 replication in lung organoids. Therefore, human lung organoids can serve as a pathophysiological model to investigate the underlying mechanism of SARS-CoV-2 infection and to discover and test therapeutic drugs for COVID-19.

Keywords: COVID-19; SARS-CoV-2; cell tropism; cellular metabolism; drug discovery; lung organoids.


Figures

Figure 1
Figure 1
Generation of human airway and alveolar organoids from hESCs. (A) Schematic of differentiation protocol and stages from hESCs to human airway organoids (hAWOs) and human alveolar organoids (hALOs). (B) Representative images at the indicated differentiation stages. Scale bar, 500 μm. (C) Fold change of lineage marker genes from day 0 (D0) to D41 over undifferentiated hESCs by quantitative RT-PCR (2−ΔΔCt). D0–D21, hLOs early stage. D21–D41, organoids split into two groups with different differentiated medium (hAWOs and hALOs). POU5F1, embryonic stem cell marker, SOX17, definitive endoderm marker, SOX2, embryonic stem cell and proximal airway cell marker, SOX9, distal alveolar progenitor cell marker, FOXA2 and NKX2.1, lung progenitor lineage marker, P63, basal cell marker, SCGB1A1 (CC10), club cell marker, MUC5AC, goblet cell marker, SPC, AT2 cell marker. Normalized to GAPDH. Bars represent mean ± SD, n = 3. (D–F) Cell lineage marker expression in human lung progenitor organoids (hLOs), human airway organoids (hAWOs), and human alveolar organoids (hALOs). Immunofluorescence images of NKX2.1 and E-Cadherin (epithelial cells) expression in D21 hLOs (D), of P63, SOX2, CC10, Ki67 (proliferation cells) and acetylated tubulin (ciliated cells), SOX9, MUC5AC, E-Cadherin protein expression in D35 hAWOs (E), and of SPC, AQP5 (AT1) and PDPN (AT1) expression in D35 hALOs (F). Nuclei were counterstained with DAPI. Scale bar, 100 μm (left panel); 20 μm (right panel). Boxes represent zoom views. (G) Fold change of ACE2 and TMPRSS2 gene expression from D0 to D41 over undifferentiated hESCs by quantitative RT-PCR (2−ΔΔCt). Normalized to GAPDH. Bars represent mean ± SD, n = 3
Figure 2
Figure 2
SARS-CoV-2 replicates in human airway and alveolar organoids. (A and B) The viral RNA and virus titer in the culture supernatant and relative intracellular viral RNA in cell lysates in hAWOs (A) and hALOs (B) were detected at indicated time points post infection. (C) Immunofluorescence images of viral nucleoprotein (green) and epithelial marker E-cadherin (red) expression with DNA stain (DAPI, blue) in SARS-CoV-2 infected hAWOs and hALOs. Scale bar, 100 μm (left panel); 20 μm (right panel). Boxes represent zoom views. (D and F) Percentage of hAWOs (D) and hALOs (F) harboring SARS-CoV2 infected cells at different time points. At least 30 different organoids were counted per condition. (E and G) Percentage of infected cells per infected hAWOs (E) and hALOs (G). At least 10 organoids were counted in (E) and at least 20 organoids in (G). ***P < 0.001, by one-way ANOVA analysis
Figure 3
Figure 3
SARS-CoV-2 Infects ciliated, club, and alveolar type 2 cells. (A and B) Representative immunofluorescence images of nucleoprotein, ACE2 and indicated cell linage marker expression with DNA stain (DAPI). Club cells (CC10+) and ciliated cells (acetylated Tubulin+) were stained in human airway organoids at indicated time points (A). Arrowheads indicate infected club cells. Alveolar type 2 cells (pro-SPC+) were stained in human alveolar organoids (B). Scale bars, 100 µm; bottom left corner, 20 µm. Boxes represent zoom views. (C) Summary of the percentage of different cell types to SARS-CoV-2 infected cells in human airway and alveolar organoids. 830, 559, and 1,009 nucleoprotein positive cells were counted at 24, 48, and 72 hpi, respectively. − negative for the nucleoprotein staining; +, 0%–35% positive for the nucleoprotein; ++, 35%–70% positive for the nucleoprotein; +++, 70%–100% positive for the nucleoprotein. (D and E) Percentage of infected ciliated cells (acetylated Tubulin+) per infected airway organoid (D) and infected alveolar type 2 cells (pro-SPC+) per alveolar organoid (E). At least 5 organoids were counted in D and at least 13 organoids in E. * P < 0.05, by one-way ANOVA analysis
Figure 4
Figure 4
Transmission electron microscopy analysis of SARS-CoV-2 infected human airway and alveolar organoids. (A–D) Infected hAWOs were fixed and observed under TEM at 96 h post infection. A part of the organoids in one mesh was overviewed (A) and the virus particles in an infected cell were shown (B–D). (E–G) Infected hALOs were fixed at 72 h post infection. A part of the organoids in one mesh (E) and the virus particles in an infected cell (F and G) were shown. (H–R) Representative virus particles and typical structures induced by virus infection in hAWOs (H–N) and hALOs (O–R). Virus particles outside cells at the apical (H), basolateral (I) and lateral side (J). Typical coronavirus replication organelle including double membrane vesicles (DMVs, indicated by asterisks) and convoluted membranes (CMs) with spherules (K). Membrane-bound vesicles with one or groups of virus particles (L). Enveloped virus particles in Golgi apparatus (M). Enveloped virus particles in secretory vesicles (N). Virus particles in a lamella body (O). Virus particles in a late endosome with engulfed cell debris (P and Q). Virus particles in disintegrated dead cells (R)
Figure 5
Figure 5
SARS-CoV-2 infection downregulates metabolic processes in human lung organoids. (A) SARS-CoV-2 viral RNA detected by RNA-seq in mock and infected organoids harvested at 48 hpi. Data are expressed as normalized read counts. (B) PCA plot for the Mock and SARS-CoV-2 infected organoids. (C) Volcano plot showing differentially expressed genes in the SARS-CoV-2 infected organoids compared with mock control. (D) Gene ontology (GO) analysis showing the differentially expressed genes from panel (C). (E) Expression level of lipid metabolism related genes, the grey lines are the means of the three biological replicates, and the error bars are the standard error of the mean. Data are expressed as normalized read counts. P-values are from a one-tailed Student’s t test. *P < 0.05, **P < 0.01, ***P < 0.001, ****P < 0.0001. (F) Expression level of LXRα (also known as NR1H3) and FXR (also known as NR1H4), two critical nuclear receptors regulating sterol, fatty acid and glucose metabolism
Figure 6
Figure 6
Remdesivir and a human neutralizing antibody inhibit SARS-CoV-2 replication in lung organoids. (A) hAWOs and hALOs were infected with SARS-CoV-2, the indicated compounds were added into the culture media 2 h after infection. 48 h later, the virus titers were determined by plaque assay with Vero E6 cells. *P < 0.05, by one-way ANOVA analysis. (B) Virus infected hAWOs and hALOs were treated with remdesivir at indicated concentrations for 48 h. The virus titers were determined by plaque assay. **P < 0.01, ***P < 0.001, by one-way ANOVA analysis. (C) Inhibition and toxicity curves of remdesivir in hAWOs and hALOs. Inhibition and cytotoxicity of remdesivir was quantified by viral titers and viable cell counting, respectively. The left and right Y-axis of these graphs represent mean survival of the cells and inhibition of virus titers, respectively. Bars represent mean ± SD, n = 3. (D and E) hAWOs and hALOs were infected with SARS-CoV-2 at the present of a human neutralizing antibody CB6 or isotype IgG, and virus titers were detected at 48 hpi. **P < 0.01, by unpaired, two-tailed Student’s t test (D). Whole-mount staining of hAWOs and hALOs. Nucleoprotein (NP) was stained to visualize infected cells. The XZ and YZ planes of the horizontal and vertical cut view of Z-stack images are shown at the bottom and right, respectively (E). Scale bars: 100 µm

References

    1. Anderson CM, Stahl A. SLC27 fatty acid transport proteins. Mol Aspects Med. 2013;34:516–528. doi: 10.1016/j.mam.2012.07.010. - DOI - PMC - PubMed
    1. Banu N, Panikar SS, Leal LR, Leal AR. Protective role of ACE2 and its downregulation in SARS-CoV-2 infection leading to macrophage activation syndrome: therapeutic implications. Life Sci. 2020;256:117905. doi: 10.1016/j.lfs.2020.117905. - DOI - PMC - PubMed
    1. Bao L, Deng W, Huang B, Gao H, Liu J, Ren L, Wei Q, Yu P, Xu Y, Qi F, et al. The pathogenicity of SARS-CoV-2 in hACE2 transgenic mice. Nature. 2020;583:830–833. doi: 10.1038/s41586-020-2312-y. - DOI - PubMed
    1. Beigel JH, Tomashek KM, Dodd LE, Mehta AK, Zingman BS, Kalil AC, Hohmann E, Chu HY, Luetkemeyer A, Kline S et al (2020) Remdesivir for the treatment of Covid-19—preliminary report. N Engl J Med. - PMC - PubMed
    1. Bustamante-Marin XM, Ostrowski LE. Cilia and mucociliary clearance. Cold Spring Harb Perspect Biol. 2017;9:a028241. doi: 10.1101/cshperspect.a028241. - DOI - PMC - PubMed

Publication types

MeSH terms