. 2021 Apr;162(4):418-433.
doi: 10.1111/imm.13294. Epub 2021 Jan 24.

The role of neuraminidase in TLR4-MAPK signalling and the release of cytokines by lupus serum-stimulated mesangial cells

Affiliations

The role of neuraminidase in TLR4-MAPK signalling and the release of cytokines by lupus serum-stimulated mesangial cells

Kamala Sundararaj et al. Immunology. 2021 Apr.

Abstract

Previously, we demonstrated neuraminidase (NEU) activity or NEU1 expression, specifically, is increased in the kidneys of lupus mice and urine of human patients with nephritis. Additionally, NEU activity mediates IL-6 secretion from lupus-prone MRL/lpr primary mouse mesangial cells (MCs) in response to an IgG mimic. IL-6 mediates glomerular inflammation and promotes tissue damage in patients and mouse strains with lupus nephritis. This study further elucidates the mechanisms by which NEU activity and NEU1 specifically mediates the release of IL-6 and other cytokines from lupus-prone MCs. We demonstrate significantly increased release of multiple cytokines and NEU activity in MRL/lpr MCs in response to serum from MRL/lpr mice (lupus serum). Inhibiting NEU activity significantly reduced secretion of three of those cytokines: IL-6, GM-CSF and MIP1α. Message levels of Il-6 and Gm-csf were also increased in response to lupus serum and reduced when NEU activity was inhibited. Neutralizing antibodies to cell-surface receptors and MAPK inhibitors in lupus serum- or LPS-stimulated MCs indicate TLR4 and p38 or ERK MAP kinase signalling play key roles in the NEU-mediated secretion of IL-6. Significantly reduced IL-6 release was observed in C57BL/6 (B6) Neu1+/+ primary MCs compared with wild-type (Neu1+/+) B6 MCs in response to lupus serum. Additional results show inhibiting NEU activity significantly increases sialic acid-containing N-glycan levels. Together, our novel observations support a role for NEU activity, and specifically NEU1, in mediating release of IL-6 from lupus-prone MCs in response to lupus serum through a TLR4-p38/ERK MAPK signalling pathway that likely includes desialylation of glycoproteins.

Keywords: Toll-like receptor 4; interleukin-6; lupus; mesangial cell; mitogen-activated protein kinase; neuraminidase.


Conflict of interest statement

The authors declare that they have no conflicts of interest with the contents of this article.

Figures

FIGURE 1
FIGURE 1
Lupus serum stimulates expression and secretion of IL‐6 and GM‐CSF, and secretion of MIP1α from lupus‐prone primary MCs. GM‐CSF (A) and MIP1α (B) were measured by individual ELISAs in the media of primary MRL/lpr MCs cultured for 6 h in the absence (control) or presence of increasing concentrations of lupus serum. IL‐6 (C), GM‐CSF (D) and MIP1α (E) were measured by individual ELISAs in the media of primary MRL/lpr MCs cultured for the indicated time in the absence (Control) or presence of 10% lupus serum. Il‐6 (F), Gm‐csf (G) and Neu1 (H) mRNA expressions were measured by real‐time RT‐PCR in primary MRL/lpr MCs cultured for 0.5–6 h in the absence (control) or presence of 10% lupus serum. Experiments were performed three times in A and B and two times in C‐H with independent serum collections. Global p‐values in A‐B and individual p‐values between control and lupus serum at each time point for C‐H were calculated across replicate experiments as described in Statistical analyses section and provided on graphs of data from representative experiments
FIGURE 2
FIGURE 2
Inhibiting NEU activity significantly reduces lupus serum‐stimulated secretion of IL‐6, GM‐CSF and MIP1α, and expression of Il‐6. Primary MRL/lpr MCs were cultured in the absence or presence of 10% lupus serum (LS) and 500 μM NEU inhibitor oseltamivir phosphate (OP). IL‐6 (A), GM‐CSF (B) and MIP1α (C) were measured by individual ELISAs in the media 6 h after addition of LS. D) Il‐6, Gm‐csf and Neu1 mRNA expression were measured by real‐time RT‐PCR 6 h after addition of LS. Control, treated with vehicle (water) only (no OP or LS). E) NEU activity by addition of substrate to live cells was measured after stimulation with LS for 3 h. Experiments were performed three times in A, B, D and E and twice in C with independent serum collections. p‐values were calculated across replicate experiments as described in Statistical analyses section and provided on graphs of data from representative experiments
FIGURE 3
FIGURE 3
Genetically reducing Neu1 significantly reduces basal and lupus serum‐stimulated NEU activity and lupus serum‐stimulated secretion of IL‐6. A) Primary C57BL/6 Neu1+/+ and Neu1 ± MCs were cultured in the absence (control) or presence of 20% lupus serum (LS) for 3 h. NEU activity was measured after addition of NEU substrate to live cells. B) Primary C57BL/6 Neu1+/+ Neu1 ± MCs were cultured in the absence (control) or presence of 20% or 40% lupus serum (LS) or 40% C57BL/6 (B6) serum. IL‐6 was measured by ELISA in the media 24 h after addition of serum. Experiments were performed four times in A and twice in B with at least two independent serum collections. p‐values were calculated across replicate experiments as described in Statistical analyses section and provided on graphs of data from representative experiments
FIGURE 4
FIGURE 4
Blocking TLR4 significantly decreased lupus serum‐stimulated IL‐6 secretion. Primary MRL/lpr MCs were cultured with 10% lupus serum for 6 h following pretreatment without or with the indicated antibodies (Ab). IL‐6 (A), GM‐CSF (B), and MIP1α (C) were measured in the media by ELISA. Secretion in the presence of LS and No Ab was set to 1 for each cytokine and relative fold change in the presence of Ab presented. Experiments were performed three times in A‐B and twice in C with at least two different serum collections and fold change averaged across experiments. Absolute levels of all three cytokines across replicate experiments were similar to levels observed in Figures 1 and 2 in response to lupus serum. Individual p‐values are provided on the graphs and calculated as described in Statistical analyses section. Isotype controls include mouse (Ms), hamster (Hm) and rat (Rt) IgGs (grey bars)
FIGURE 5
FIGURE 5
LPS stimulates expression and secretion of IL‐6 and GM‐CSF, and secretion of MIP1α from lupus‐prone primary MCs. Primary MRL/lpr MCs were cultured for 6 h in the absence (control) or presence of increasing amounts of LPS. IL‐6 (A), GM‐CSF (B) and MIP1α (C) were measured by individual ELISAs in the media. Primary MRL/lpr MCs were cultured for the indicated time in the absence (Control) or presence of 5 ng/ml LPS. IL‐6 (D), GM‐CSF (E) and MIP1α (F) were measured by individual ELISAs in the media. Il‐6 (G), Gm‐csf (H) and Neu1 (I) mRNA expressions were measured by real‐time RT‐PCR. Experiments were performed three times in A‐C and twice in D‐H. Global p‐values (A‐C) or individual p‐values (D‐I) are provided on the graphs. p‐values were calculated across replicate experiments as described in Statistical analyses section with representative experiments presented
FIGURE 6
FIGURE 6
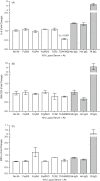
Inhibiting NEU activity or TLR4 significantly reduces LPS‐stimulated secretion of IL‐6, GM‐CSF and MIP1α, and expression of Il‐6 and Gm‐csf. Primary MRL/lpr MCs were cultured in the absence or presence of 500 μM NEU inhibitor oseltamivir phosphate (OP) and then stimulated with 5 ng/ml LPS for 6 h. IL‐6 (A), GM‐CSF (B) and MIP1α (C) were measured by individual ELISAs in the media. Il‐6 and Gm‐csf (D) mRNA expressions were measured by real‐time RT‐PCR in the cells. E) Primary MCs were pretreated without or with 500 μM OP followed by stimulation with 5 ng/ml LPS for 3 h, and NEU activity was measured after addition of substrate to live cells. Control, treated with vehicle (water) only (no OP or LPS). F) Primary MCs were pretreated without (No Ab) or with TLR4/MD2 antibodies and stimulated with 5 ng/ml LPS for 6 h. IL‐6, GM‐CSF and MIP1α were measured in the media by ELISA. Rt IgG, rat isotype control. Secretion in the presence of LPS with No Ab was set to 1 for each cytokine and relative fold change in the presence of TLR4/MD2 Ab calculated. Experiments in A, B, and E were performed three times, and all other experiments were performed twice. p‐values were calculated across replicate experiments as described in Statistical analyses section and provided on graphs of data from representative experiments
FIGURE 7
FIGURE 7
NEU activity mediates IL‐6 and GM‐CSF secretion through ERK or p38 MAPK signalling. A‐B) MRL/lpr primary MCs were incubated without inhibitor (control) or with 10 μM ERK (U0126), p38 (SB203580), JNK (SP600125) or PI3K (Wortmannin) inhibitors for 2 h prior to addition of 10% lupus serum (A) or 5 ng/ml LPS (B) for 3 h. Data for one experiment representative of three independent experiments are presented. Levels of all three cytokines across replicate experiments were similar to levels observed in Figures 1 and 2 in response to lupus serum and in Figure 5 in response to LPS. p‐values were calculated across replicate experiments as described in Statistical analyses section. #, significant increase at p < 0.001 vs control. All other p‐values are provided on the graphs. Graphs are data from representative experiments. C‐D) Cells were pretreated with vehicle (water) or 500 μM NEU inhibitor oseltamivir phosphate (OP) for 16 h and then stimulated with 10% lupus serum (C) or 5 ng/ml LPS (D) for 15–45 min. Whole‐cell extracts were prepared and subjected to Western immunoblot using antibodies to phosphorylated ERK or p38 (Phospho), or total ERK or p38 (Total). Ratio of band intensities for phosphorylated to total ERK and p38 is provided below each blot. Results are representative of three independent experiments with consistent decreases observed after stimulation for 45 min with lupus serum (C) and 30 min with LPS (D) in the presence of OP vs absence of OP
FIGURE 8
FIGURE 8
Blocking NEU activity significantly increased sialic acid‐containing N‐linked glycoproteins in lupus serum‐stimulated MCs. MRL/lpr primary MCs were pretreated with vehicle (water) or with 500 μM NEU activity inhibitor oseltamivir phosphate (OP) and stimulated with 10% lupus serum (LS) for 3 h. N‐glycans were analysed by MALDI‐FTICR. Intensities of 19 sialylated N‐glycans clearly identified after background subtraction are presented. Structures for sialylated N‐glycans for which the structures are known, including m/z 2122 and m/z 2853 that were significantly increased by OP, are shown on the graph. Data presented are the average of replicate wells + SD. Adjusted p‐values on the graph were calculated as described in Materials and Methods

References

    1. Nowling TK, Mather AR, Thiyagarajan T, Hernández‐Corbacho MJ, Powers TW, Jones EE, et al. Renal glycosphingolipid metabolism is dysfunctional in lupus nephritis. J Am Soc Nephrol. 2015;26:1402–13. - PMC - PubMed
    1. Natoli TA, Smith LA, Rogers KA, Wang B, Komarnitsky S, Budman Y, et al. Inhibition of glucosylceramide accumulation results in effective blockade of polycystic kidney disease in mouse models. Nat Med. 2010;16:788–92. - PMC - PubMed
    1. Natoli TA, Husson H, Rogers KA, Smith LA, Wang B, Budman Y, et al. Loss of GM3 synthase gene, but not sphingosine kinase 1, is protective against murine nephronophthisis‐related polycystic kidney disease. Hum Mol Genet. 2012;21:3397–407. - PMC - PubMed
    1. Subathra M, Korrapati M, Howell LA, Arthur JM, Shayman JA, Schnellmann RG, et al. Kidney glycosphingolipids are elevated early in diabetic nephropathy and mediate hypertrophy of mesangial cells. Am J Physiol Renal Physiol. 2015;309:F204–F215. - PMC - PubMed
    1. Nitta T, Kanoh H, Inamori KI, Suzuki A, Takahashi T, Inokuchi JI. Globo‐series glycosphingolipids enhance Toll‐like receptor 4‐mediated inflammation and play a pathophysiological role in diabetic nephropathy. Glycobiology. 2019;29:260–8. - PubMed

Publication types

MeSH terms