

A conserved cysteine-based redox mechanism sustains TFEB/HLH-30 activity under persistent stress
- PMID: 33314217
- PMCID: PMC7849306
- DOI: 10.15252/embj.2020105793
A conserved cysteine-based redox mechanism sustains TFEB/HLH-30 activity under persistent stress
Abstract
Mammalian TFEB and TFE3, as well as their ortholog in Caenorhabditis elegans HLH-30, play an important role in mediating cellular response to a variety of stress conditions, including nutrient deprivation, oxidative stress, and pathogen infection. In this study, we identify a novel mechanism of TFEB/HLH-30 regulation through a cysteine-mediated redox switch. Under stress conditions, TFEB-C212 undergoes oxidation, allowing the formation of intermolecular disulfide bonds that result in TFEB oligomerization. TFEB oligomers display increased resistance to mTORC1-mediated inactivation and are more stable under prolonged stress conditions. Mutation of the only cysteine residue present in HLH-30 (C284) significantly reduced its activity, resulting in developmental defects and increased pathogen susceptibility in worms. Therefore, cysteine oxidation represents a new type of TFEB post-translational modification that functions as a molecular switch to link changes in redox balance with expression of TFEB/HLH-30 target genes.
Keywords: HLH-30; TFE3; TFEB; glutathionylation; lysosomes.
© 2020 The Authors.
Conflict of interest statement
The authors declare that they have no conflict of interest.
Figures
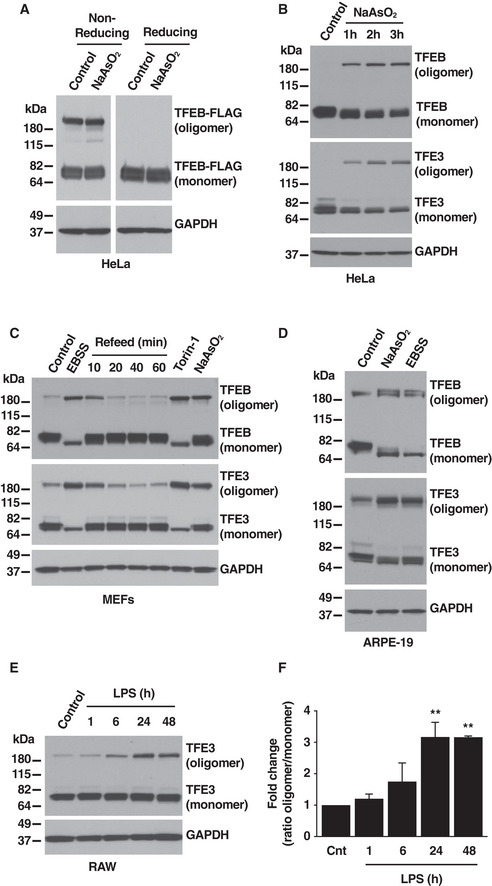
Immunoblot analysis of protein lysates from HeLa cells stably expressing TFEB‐FLAG treated with 250 μM NaAsO2 for 1 h run under either non‐reducing or reducing conditions.
Immunoblot analysis of protein lysates from HeLa cells treated with 250 μM of NaAsO2 for the indicated times and run under non‐reducing conditions.
Immunoblot analysis of protein lysates from MEF cells treated with EBSS, 250 nM Torin‐1, or 100 μM NaAsO2 for 1 h and run under non‐reducing conditions. For refeed condition, starved cells were incubated in complete medium for the indicated times.
Immunoblot analysis of protein lysates from ARPE‐19 cells treated with 250 μM NaAsO2 or EBSS for 1 h and run under non‐reducing conditions.
Immunoblot analysis of protein lysates from Raw 264.7 cells treated with 1 μg/ml LPS for the indicated times and run under non‐reducing conditions. Immunoblots are representative of at least three independent experiments.
Quantification of oligomer versus monomer ratios from Raw 264.7 cells treated with 1 μg/ml LPS, as shown in (E). Quantified results are fold change of oligomer versus monomer ratios from its corresponding vehicle‐treated cells. Data are presented as mean ± SD using one‐way ANOVA **P < 0.01, from two independent experiments.
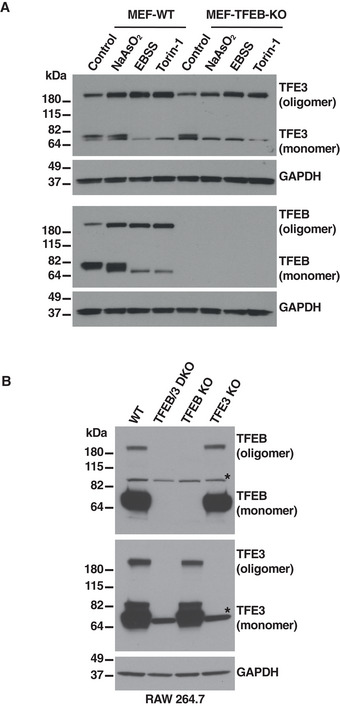
Immunoblot analysis of protein lysates from MEFs wild‐type (WT) or MEFs TFEB knockout treated with 100 μM NaAsO2, EBSS, or 250 nM Torin‐1 for 1 h run under non‐reducing conditions.
Immunoblot analysis of protein lysates from RAW 264.7 cells wild type (WT), TFEB/TFE3 double knockout (DKO), TFEB knockout or TFE3 knockout run under non‐reducing conditions. Asterisks indicate non‐specific protein bands recognized by the antibodies.

Multi sequence alignment of TFEB orthologs showing conserved homology between different species of the region containing TFEB Cysteine 212.
Sequence homology analysis between human TFEB and TFE3 depicting the region containing the single cysteine residue in the entire proteins. Multi sequence alignment of TFE3 orthologs showing conserved homology between different species of the region containing TFE3 Cysteine 322.
Immunoblot analysis of protein lysates from ARPE‐19 cells expressing TFEB‐FLAG‐WT or mutants treated with 250 μM NaAsO2 or EBSS for 1 h and run under non‐reducing condition.
Immunoblot analysis of protein lysates from ARPE‐19 cells expressing TFE3‐GFP‐WT or mutants run under non‐reducing condition.
Immunoblot analysis of co‐immunoprecipitated TFEB‐FLAG and 14‐3‐3 from ARPE‐19 cells overexpressing TFEB‐WT or TFEB‐C212S mutant.
Immunoblot analysis of co‐immunoprecipitated TFEB‐FLAG, 14‐3‐3 and endogenous TFE3 from ARPE‐19 cells overexpressing TFEB‐WT or TFEB‐C212A mutant. Immunoblots are representative of at least three independent experiments.

- A
Immunoblot analysis of co‐immunoprecipitated TFEB‐WT and TFE3‐WT and corresponding cysteine mutants from ARPE‐19 cells overexpressing TFEB‐WT‐FLAG, TFE3‐WT‐GFP, TFEB‐C212A‐FLAG, and TFE3‐C322A‐GFP.
- B, C
Immunoblot analysis of protein lysates from ARPE‐19 (B) and HeLa (C) cells treated with 250 μM NaAsO2 or 250 nM Torin‐1 for 1 h, 50 μM MB‐3 for 16 h or a combination of these drugs with MB‐3 and run under non‐reducing condition.

Immunoblot analysis of protein lysates from HeLa cells treated with 250 μM NaAsO2, EBSS, 250 nM Torin‐1, 15 mM NAC, or a combination of these drugs with NAC for 1 h and run under non‐reducing condition.
Quantification of immunoblot data shown in (A). Data are presented as mean ± SD using one‐way ANOVA *P < 0.05, ***P < 0.001, and ****P < 0.0001 from two independent experiments.
Higher‐energy collisional dissociation (HCD) spectrum of TFEB‐C212 containing peptide (VGVTSSSCPADL), left top panel indicates the assigned b‐ and y‐fragment ions, and left bottom panel their mass deviations from corresponding theoretical values showing glutathionylation at Cysteine 212. Right panel shows extracted ion chromatograms (XIC) of TFEB glutathionylated peptide from cells either untreated (control) or treated with NaAsO2.
Immunoblot analysis of protein lysates from ARPE‐19 cells overexpressing TFEB‐FLAG or TFE3‐MYC, treated with 250 nM Torin‐1 for 1 h and run under non‐reducing condition.
Quantification of immunoblot data shown in (D). Data are presented as mean ± SD using two‐tailed t‐test *P < 0.05 from three independent experiments.
Immunoblot analysis of protein lysates from ARPE‐19 cells overexpressing TFEB‐FLAG‐WT, TFEB‐FLAG‐S211A, TFE3‐MYC‐WT, or TFE3‐MYC‐S321A and run under non‐reducing condition.
Quantification of immunoblot data shown in (F). Data are presented as mean ± SD using two‐tailed t‐test *P < 0.05 and **P < 0.01 from three independent experiments.

Immunoblot analysis of protein lysates from ARPE‐19 cells treated with 250 μM NaAsO2, EBSS, 250 nM Torin‐1, 15 mM NAC, or a combination of these drugs with NAC for 1 h and run under non‐reducing condition.
Quantification of immunoblot data shown in (A). Data are presented as mean ± SD using one‐way ANOVA *P < 0.05, **P < 0.01 from two independent experiments.
Extracted ion chromatograms (XIC) of TFEB glutathionylated peptide from cells either untreated (control) or treated with NaAsO2.
Immunoblot analysis of protein lysates from ARPE‐19 cells expressing TFEB‐FLAG‐WT or TFEB‐C212A‐FLAG.
Quantification of immunoblot data shown in (D). Data are presented as mean ± SD using two‐tailed t‐test **P < 0.01 from five independent experiments.
Quantification of immunoblot data shown in (Fig 2F). Data are presented as mean ± SD using two‐tailed t‐test ***P < 0.001 from three independent experiments.

Immunofluorescence confocal microscopy of ARPE‐19 cells overexpressing TFEB‐FLAG‐WT or TFEB‐FLAG‐C212A showing the subcellular distribution of recombinant TFEB in response to treatments with EBSS for 4 h or 250 μM NaAsO2 for 1 h. Scale bars, 10 μm.
Quantification of the nuclear localization of recombinant TFEB in ARPE‐19 cells treated with 250 μM NaAsO2 for 1 h or EBSS for 4h and incubated in complete medium (refeed) for the indicated times. Data are presented as mean ± SD using two‐way ANOVA, (ns) not significant as compared to the same treatment in TFEB‐WT overexpressing cells, with > 200 cells counted per trial from three independent experiments.
Immunoblot analysis of protein lysates from MEF cells treated with EBSS, 250 nM Torin‐1, or 100 μM NaAsO2 for 1 h, subjected to subcellular fractionation and run under non‐reducing condition.
Relative quantitative RT–PCR analysis of the mRNA expression of autophagy‐ (UVRAG), mitochondria‐ (PGC‐1α) and lysosome (MCOLN1, ATPV1C1, and HEXA)‐related genes in ARPE‐19 cells overexpressing TFEB‐FLAG‐WT or TFEB‐FLAG‐C212A. Data are presented as mean ± SD using two‐way ANOVA, (ns) not significant as compared to the same gene in TFEB‐WT overexpressing cells, from three independent experiments.
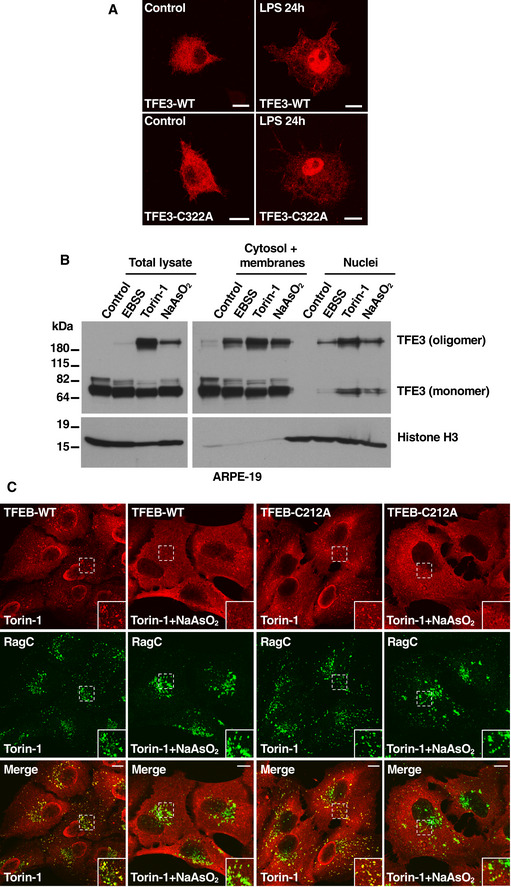
Immunofluorescence confocal microscopy of RAW 264.7 cells overexpressing TFE3‐FLAG‐WT or TFE3‐FLAG‐C322A untreated (control) or treated with 1 μg/ml LPS for 24 h. Scale bars, 10 μm.
Immunoblot analysis of protein lysates from ARPE‐19 cells treated with EBSS, 250 nM Torin‐1, or 250 μM NaAsO2 for 1 h, subjected to subcellular fractionation and run under non‐reducing condition.
Immunofluorescence confocal microscopy of ARPE‐19 cells overexpressing TFEB‐FLAG‐WT or TFEB‐FLAG‐C212A showing lysosomal colocalization with RagC (yellow color in merge images) in the presence of 250 nM Torin‐1 or Torin‐1 in combination with 300 μM NaAsO2 treatment for 1 h. Insets represent a 1.85‐fold magnification of the indicated area. Scale bars, 10 μm.

Immunoblot analysis of protein lysates from ARPE‐19 and HeLa cells treated for the indicated times with 100 μM and 50 μM NaAsO2, respectively, and run under non‐reducing conditions.
Quantification of immunoblot data shown in (A). Data are presented as mean ± SD using one‐way ANOVA *P < 0.05, **P < 0.01, ***P < 0.001, and ****P < 0.0001 from three independent experiments.
Quantification of immunoblot data shown in (A). Data are presented as mean ± SD using one‐way ANOVA *P < 0.05, **P < 0.01, and ***P < 0.001 from three independent experiments.
Immunoblot analysis of protein lysates from ARPE‐19 cells overexpressing TFEB‐FLAG‐WT or TFEB‐FLAG‐C212A treated with 100 μM NaAsO2 for the indicated times and run under non‐reducing conditions.
Quantification of immunoblot data from TFEB‐WT shown in (D). Data are presented as mean ± SD using one‐way ANOVA *P < 0.05, **P < 0.01, and ***P < 0.001 from three independent experiments. Some error bars are the same size or smaller than the data point symbols.
Immunofluorescence confocal microscopy of ARPE‐19 cells showing the nuclear localization of TFE3 in response to treatment with 100 μM NaAsO2 for 8 h. Scale bars, 10 μm.
Relative quantitative RT–PCR analysis of the mRNA expression of lysosome‐related genes (MCOLN1 and ATPV61C1) in ARPE‐19 and HeLa cells treated with 100 μM and 50 μM NaAsO2, respectively, for the indicated times. Data are presented as mean ± SD using one‐way ANOVA *P < 0.05, **P < 0.01, ***P < 0.001 from two independent experiments.
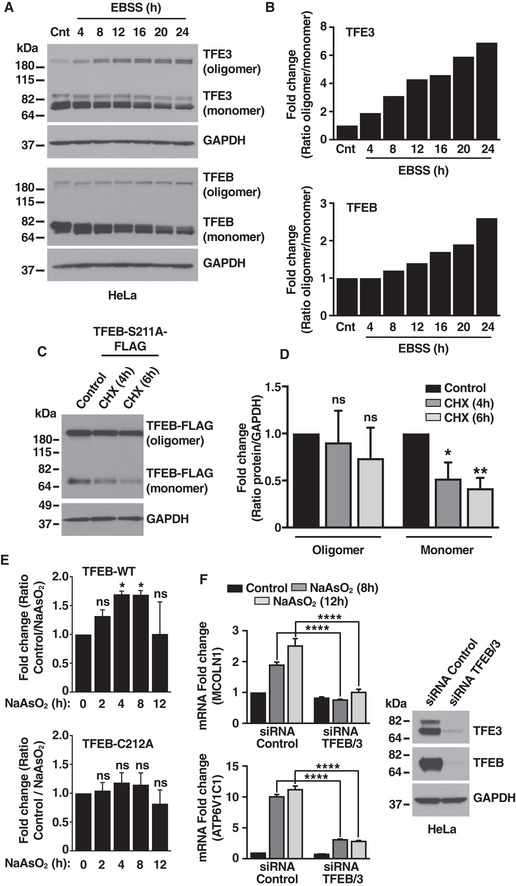
Immunoblot analysis of protein lysates from HeLa cells treated with EBSS for the indicated times.
Quantification of immunoblot data shown in (A) from one experiment.
Immunoblot analysis of protein lysates from ARPE‐19 cells expressing TFEB‐S211A‐FLAG treated with Cycloheximide (CHX) for the indicated times.
Quantification of immunoblot data shown in (C). Data are presented as mean ± SD using one‐way ANOVA *P < 0.05, and **P < 0.01 from three independent experiments.
Quantification of immunoblot data shown in (Fig 5D) run under reducing conditions. Data are presented as mean ± SD using one‐way ANOVA *P < 0.05 from three independent experiments.
Immunoblot analysis of protein lysates from HeLa cells treated with siRNA control or TFEB/TFE3. Relative quantitative RT–PCR analysis of the mRNA expression of lysosome‐related genes (MCOLN1 and ATPV1C1) in HeLa cells treated with siRNA control or TFEB/TFE3 and 50 μM NaAsO2 for the indicated times. Data are presented as mean ± SD using two‐way ANOVA ****P < 0.0001 from two independent experiments.

Immunoblot analysis of protein lysates from HeLa cells treated with EBSS for 1 h and then incubated with complete medium (refeed) for the indicated times. Samples were run under non‐reducing conditions.
Quantification of immunoblot data shown in (A). Data are presented as mean ± SD using one‐way ANOVA *P < 0.05, and ***P < 0.001 from three independent experiments.
Quantification of immunoblot data shown in (A). Data are presented as mean ± SD using one‐way ANOVA *P < 0.05, and ***P < 0.001 from three independent experiments.
Relative quantitative RT–PCR analysis of the mRNA expression of autophagy‐ (UVRAG), lysosome‐ (ATP6V1C1), oxidative stress response‐ (TXNRD1 and HMOX1), cell cycle control‐ (CDKN1a), and cytokine production (IL6)‐related genes in TFEB/TFE3‐double knockout MEFs cells stably expressing TFEB‐FLAG‐WT or TFEB‐FLAG‐C212A and treated with 5 μM arsenic trioxide (ATO) or 12.5 μM NaAsO2 for 12 h. Data are presented as mean ± SD using two‐way ANOVA *P < 0.05, **P < 0.01, ***P < 0.001, and ****P < 0.0001 from three independent experiments.
Schematic representation of TFEB/TFE3 redox regulation in response to chronic stress conditions.

Immunoblot analysis of protein lysates from ARPE‐19 cells overexpressing FLAG‐tagged C. elegans HLH‐30 wild‐type or mutated HLH‐30(C284A) mutant. Samples were run under non‐reducing conditions.
Immunoblot analysis of protein lysates from C. elegans knock‐in strains expressing HLH‐30::3xFLAG::eGFP and HLH‐30(C284A)::3xFLAG::eGFP subjected to 4 h of starvation. Samples were run under non‐reducing conditions.
Representative examples of HLH‐30::3xFLAG::eGFP subcellular localization: Cytoplasmic, diffuse GFP distribution along the whole body of the worm; Weak nuclear, some cells in the posterior part of the worm display nuclear GFP labeling but no nuclear labeling is found in the head cells; Strong nuclear, distinct nuclear GFP labeling in cells along the worm body, including neurons in the head area. Arrowheads denote nuclear localization of HLH‐30::3xFLAG::eGFP. Scale bar 200 µm and 50 µm.
Quantification of the subcellular distribution of HLH‐30::3xFLAG::eGFP and HLH‐30(C284A)::3xFLAG::eGFP upon treatment with different stimuli. Data are from three independent experiments with at least 50 animals per experiment.

Lifespan assay of hlh‐30 mutants at 25°C. Graph represents Kaplan–Meier survival plots of two independent experiments initiated with 100 animals per strain. **P < 0.01 and ****P < 0.0001 by Log‐rank (Mantel‐Cox) test compared with wild‐type control.
Survival of hlh‐30 mutants on 7.5 mM NaAsO2. Data are the mean ± SD of three independent experiments initiated with 120 animals per strain. ****P < 0.0001 by two‐way ANOVA compared with wild‐type control.
Survival of hlh‐30 mutants to infection by Staphylococcus aureus. Data are the mean ± SD of three independent experiments initiated with 100 animals per strain. ****P < 0.0001 by two‐way ANOVA compared with wild‐type control.
Quantification of the subcellular distribution of HLH‐30::3xFLAG::eGFP and HLH‐30(C284A)::3xFLAG::eGFP in an eat‐2(ad1116) mutant background. Data are from three independent experiments with at least 50 animals per experiment.
Synthetic developmental delay phenotype of eat‐2(ad1116) worms carrying mutations in the hlh‐30 gene. Data are the mean ± SD of three independent experiments with at least 20 animals per assay. ****P < 0.0001 by one‐way ANOVA with multiple comparison test.
Representative images of worms quantified in (E). Scale bars 200 µm.
Quantification of the subcellular distribution of HLH‐30::3xFLAG::eGFP and HLH‐30(C284A)::3xFLAG::eGFP in a daf‐2(e1370) mutant background. Data are from three independent experiments with at least 50 animals per experiment.
Effect of hlh‐30 mutations on the dauer formation phenotype of daf‐2(e1370) worms. Data are the mean ± SD of four independent experiments. ***P < 0.001; ****P < 0.0001 by one‐way ANOVA with multiple comparison test.
Effect of hlh‐30 mutations on the dauer recovery phenotype of daf‐2(e1370) worms. Data are the mean ± SD of three independent experiments. ****P < 0.0001 by two‐way ANOVA compared with wild‐type control.
