. 2021 Mar 1;218(3):e20201416.
doi: 10.1084/jem.20201416.

Mitophagy-mediated adipose inflammation contributes to type 2 diabetes with hepatic insulin resistance

Affiliations

Mitophagy-mediated adipose inflammation contributes to type 2 diabetes with hepatic insulin resistance

Feng He et al. J Exp Med. .

Erratum in

Abstract

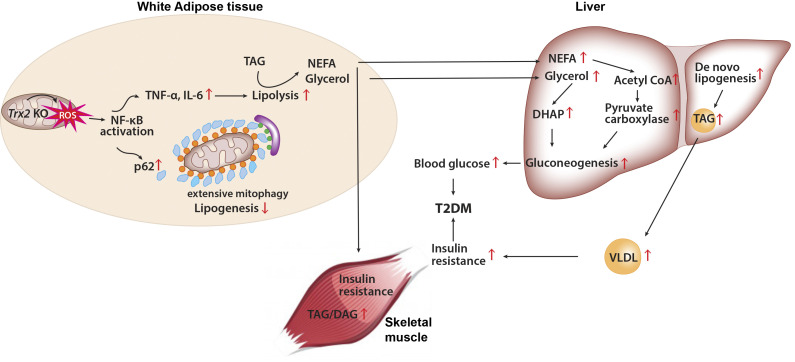
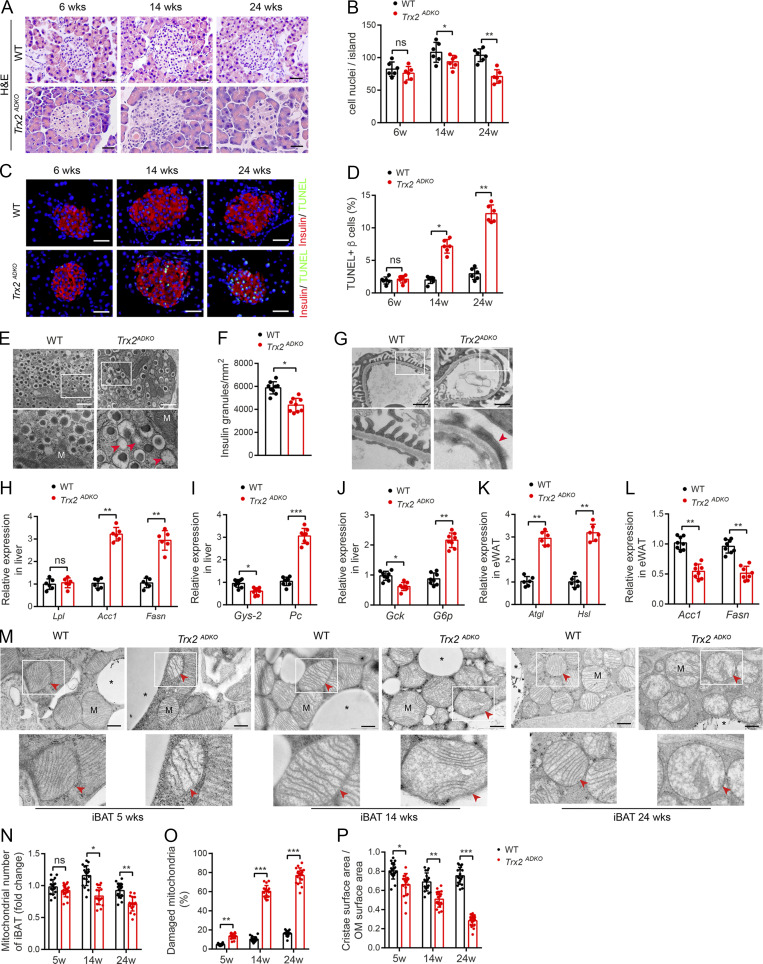
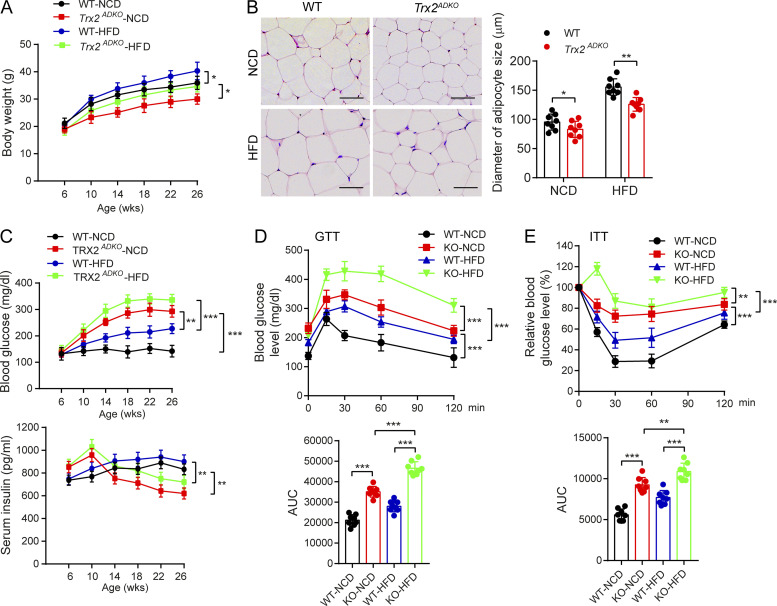
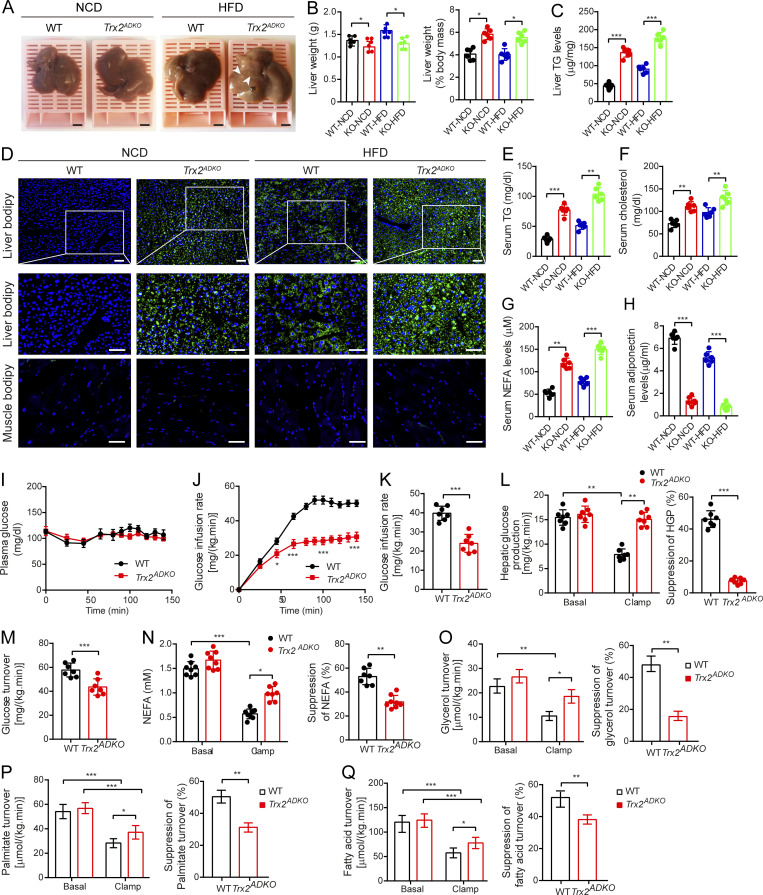
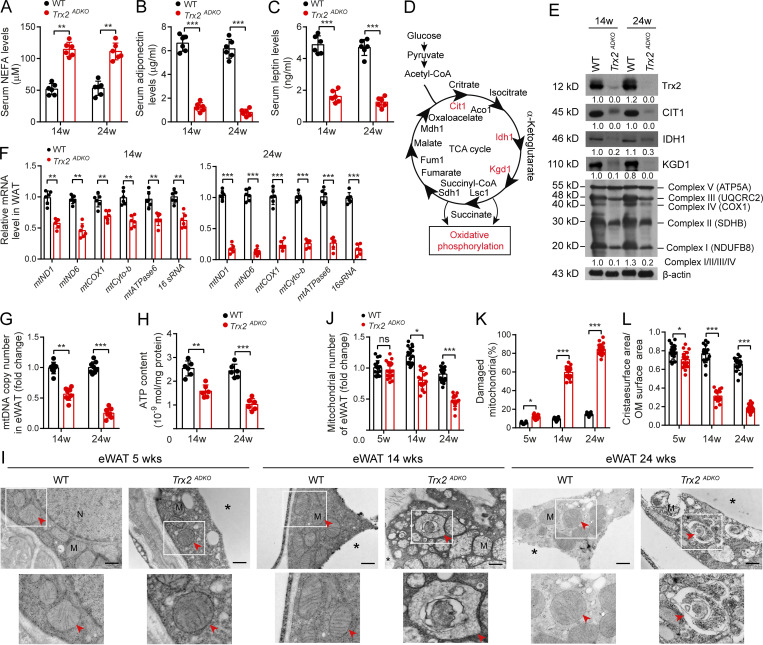
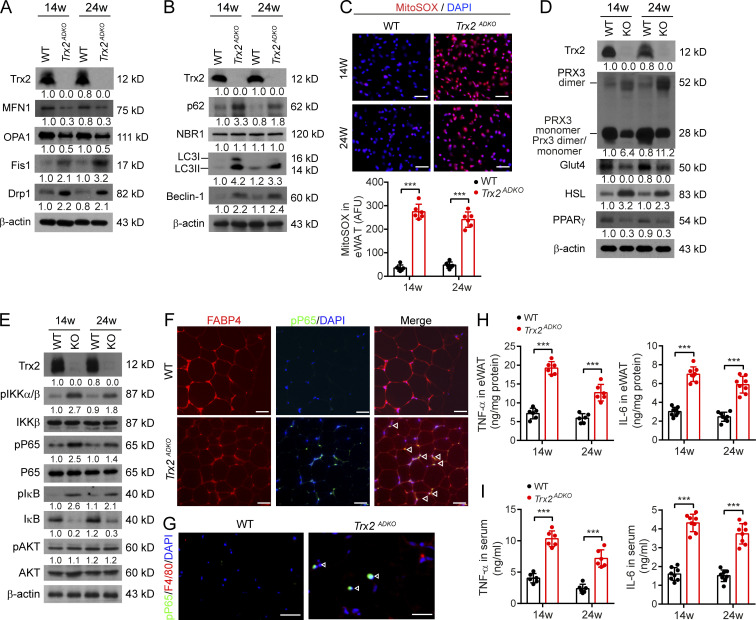
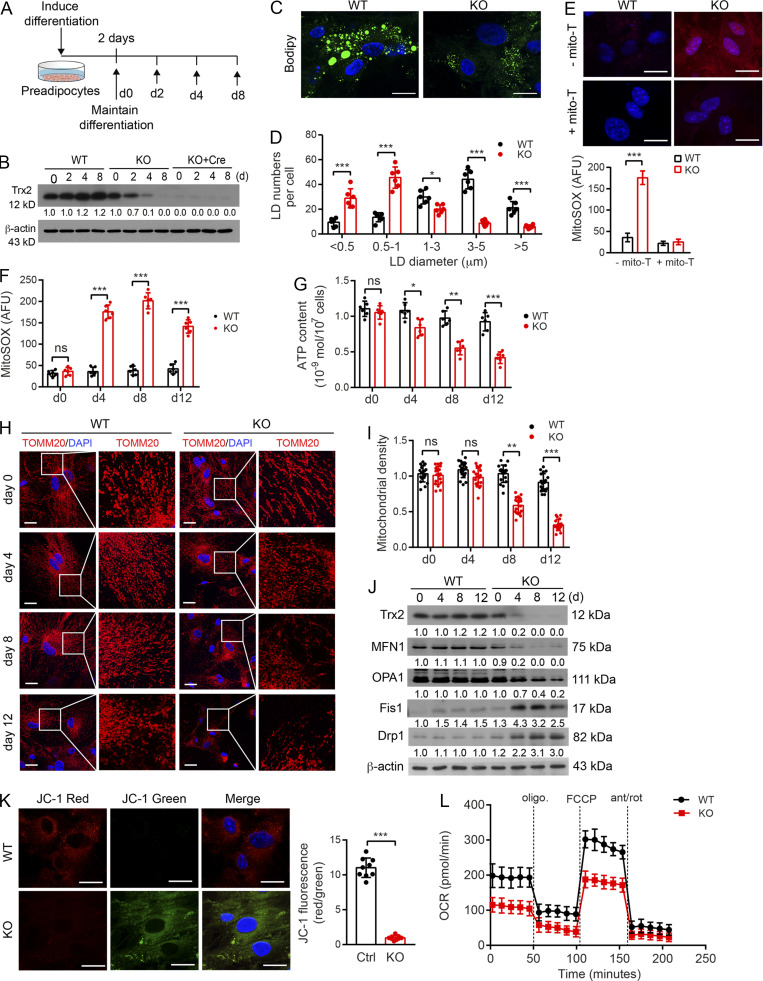
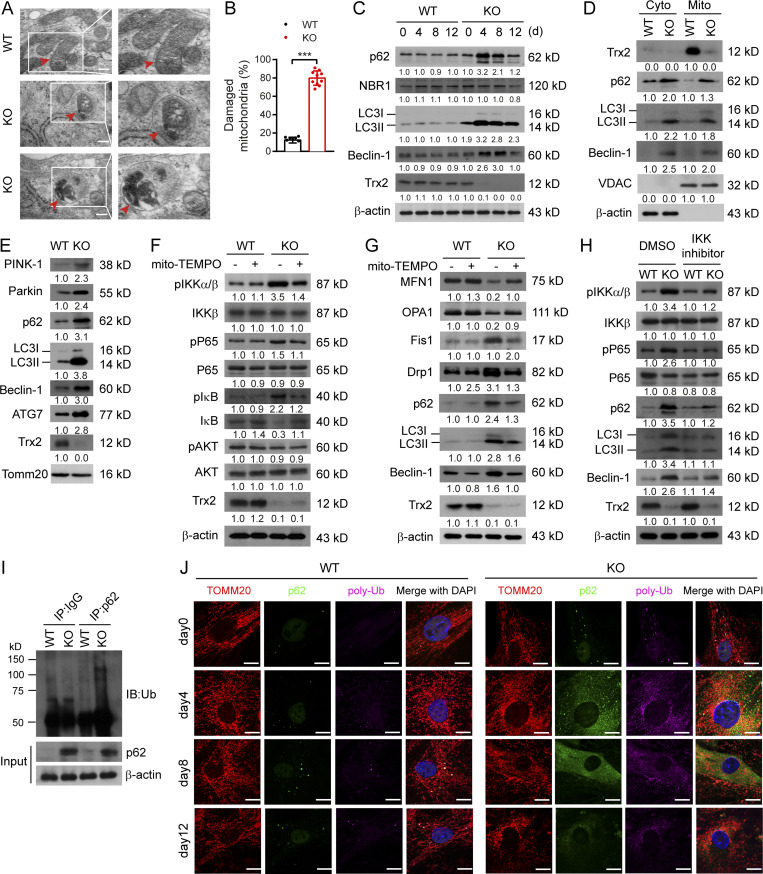
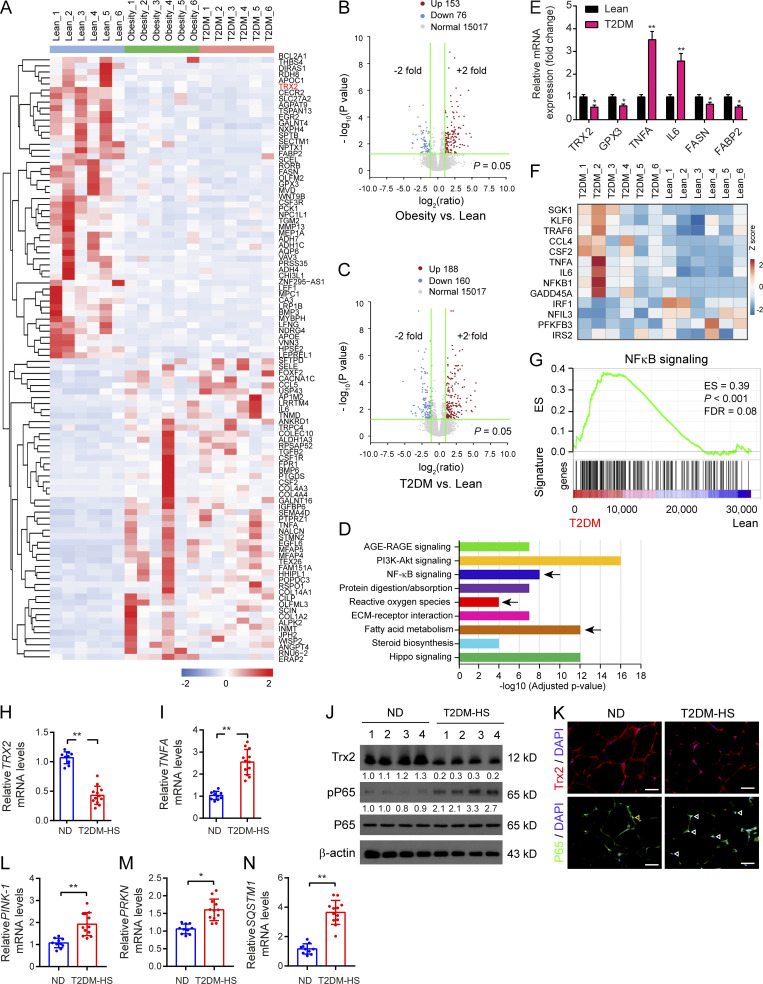
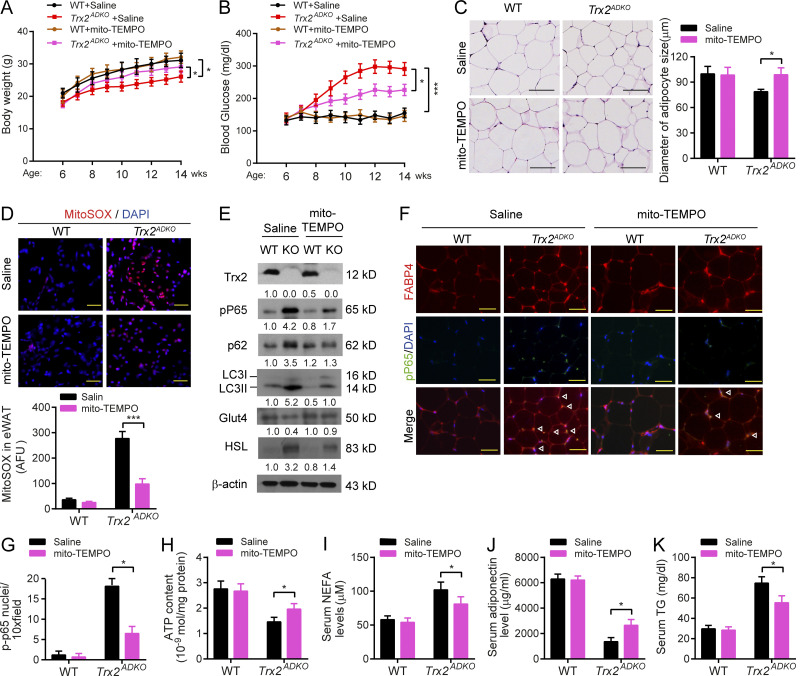
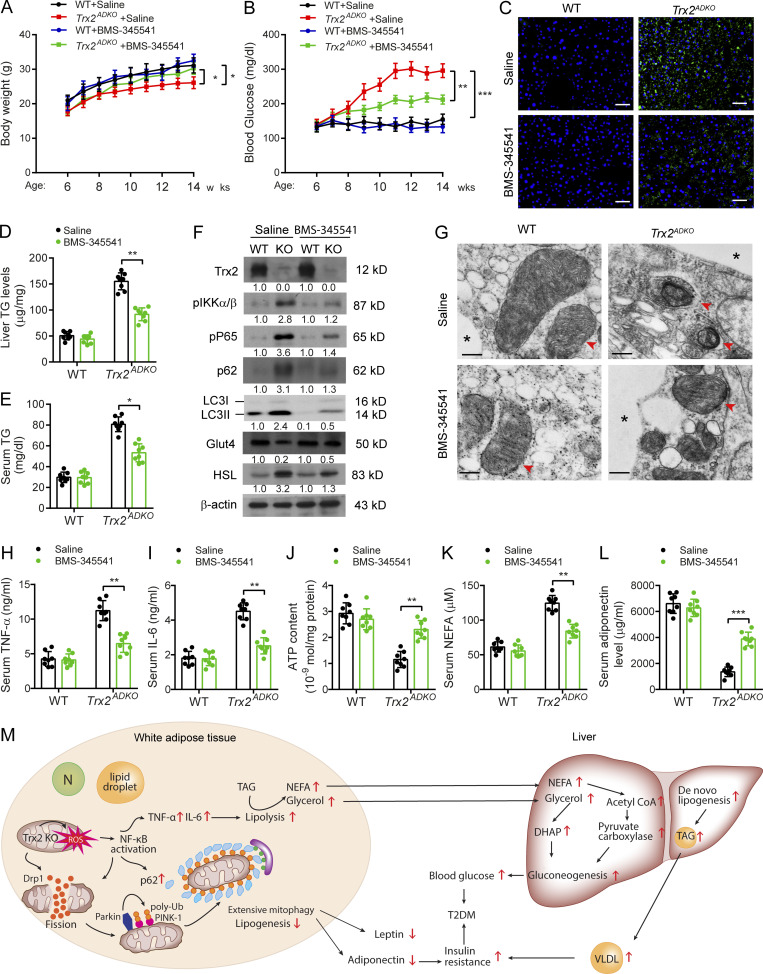
White adipose tissues (WAT) play crucial roles in maintaining whole-body energy homeostasis, and their dysfunction can contribute to hepatic insulin resistance and type 2 diabetes mellitus (T2DM). However, the mechanisms underlying these alterations remain unknown. By analyzing the transcriptome landscape in human adipocytes based on available RNA-seq datasets from lean, obese, and T2DM patients, we reveal elevated mitochondrial reactive oxygen species (ROS) pathway and NF-κB signaling with altered fatty acid metabolism in T2DM adipocytes. Mice with adipose-specific deletion of mitochondrial redox Trx2 develop hyperglycemia, hepatic insulin resistance, and hepatic steatosis. Trx2-deficient WAT exhibited excessive mitophagy, increased inflammation, and lipolysis. Mechanistically, mitophagy was induced through increasing ROS generation and NF-κB-dependent accumulation of autophagy receptor p62/SQSTM1, which recruits damaged mitochondria with polyubiquitin chains. Importantly, administration of ROS scavenger or NF-κB inhibitor ameliorates glucose and lipid metabolic disorders and T2DM progression in mice. Taken together, this study reveals a previously unrecognized mechanism linking mitophagy-mediated adipose inflammation to T2DM with hepatic insulin resistance.


Conflict of interest statement

Disclosures: G. Shulman reported grants from NIH (R01 DK119668, R01 DK116774, R01 DK113984, R01 DK114793, RC2 DK120534, and P30 DK045735), Gilead Sciences, Inc., AstraZeneca, and Merck & Co., Inc.; non-financial support from Gilead Sciences, Inc., AstraZeneca, Merck & Co., Inc., Janssen Research & Development, and Novo Nordisk; and personal fees from Gilead Sciences, Inc., AstraZeneca, Merck & Co., Inc., Janssen Research & Development, Novo Nordisk, iMetabolic Biopharma Corp., Maze Therapeutics, Inc., Generian Pharmaceuticals, Ionis Pharmaceuticals, Inc., BridgeBio, Esperion, 89Bio, Inc., Nimbus Discovery, Inc., Staten Biotechnology, Longitude Capital, Celgene Corp., and Aegerion Pharmaceuticals during the conduct of the study. No other disclosures were reported.

Figures

None
Graphical abstract
Figure S1.
Figure S1.
Trx2 targeting strategy and adipocyte-specific deletion. (A) Schematic diagram of adipocyte-specific Trx2 KO by the loxP-Cre system. (B) Genotyping results of Trx2lox/lox (WT) and Trx2ADKO (Trx2lox/lox;Adipo-Cre; KO) mice. Note that WT mice did not contain Cre. (C) Representative Western blot analysis of Trx2 expression in eWAT, interscapular BAT (iBAT), and pancreas from WT and KO mice. β-Actin was used as a loading control. TK, thymidine kinase.
Figure 1.
Figure 1.
Adipocyte-specific KO of Trx2 results in hyperglycemia and insulin resistance. (A) Representative immunoblot analysis of Trx2 protein in WAT and BAT of Trx2ADKO mice relative to the WT controls. Trx2 protein levels were quantified and presented as fold changes by taking WT as 1.0. n = 3 male mice. Female mice show similar Trx2 deletion. (B) Representative hematoxylin and eosin images of eWAT and ingWAT from 14-wk-old WT and Trx2ADKO mice (n = 6 male). Diameters of adipocyte in eWAT and ingWAT were quantified. Female mice show similar phenotype in adipocyte size. Scale bars, 100 µm. (C–F) Food intake, oxygen consumption corrected for lean mass, energy expenditure corrected for lean mass, and RER of 14-wk-old WT and Trx2ADKO mice (n = 6). (G and H) Fasting blood glucose and serum insulin levels over time in WT and Trx2ADKO mice (n = 6). (I and J) GTT and ITT in 14-wk-old male WT and Trx2ADKO mice (n = 8). AUC 120 min was calculated. Quantitative data are presented as mean ± SEM. *, P < 0.05; **, P < 0.01; ***, P < 0.001 versus the corresponding value for WT. Significance was analyzed by two-tailed Student’s t test. ns, not significant.
Figure S2.
Figure S2.
Type 2 diabetic phenotype of adipocyte-specific Trx2-KO mice. (A) Growth curves of male WT and Trx2ADKO mice (n = 8). (B) EchoMRI analysis of fat and lean mass of 14-wk-old male WT and Trx2ADKO mice (n = 8). (C and D) Oxygen consumption corrected for TBW (C) and oxygen consumption corrected for TBW (D). EE, energy expenditure. (E and F) Blood glucose levels in random fed WT and Trx2ADKO male (E) and female mice (F). Both male and female mice exhibited similar phenotypes in blood glucose levels (n = 8 for each group). (G and H) GTT (G) and ITT (H) results of 6-wk-old male WT and Trx2ADKO mice (n = 8). AUC (120 min) was calculated. Quantitative data represent the mean ± SEM. *, P < 0.05; **, P < 0.01; ***, P < 0.001 compared with WT controls. Significance was analyzed by two-tailed Student’s t test.
Figure S3.
Figure S3.
Trx2ADKO mice develop T2DM-related end-organ damage. (A–E) Trx2-KO mice exhibit decreased insulin content and increased β cell apoptosis. (A) Representative hematoxylin and eosin–stained pancreas sections showing pancreatic islets of WT and Trx2ADKO mice at the indicated ages. Scale bars, 20 µm. (B) Nuclei density of six randomly selected pancreatic islets (n = 6 mice). (C) Detection of β cell apoptosis by costaining of TUNEL (green) and insulin (red). Representative images from WT and Trx2ADKO mice at the indicated ages. Scale bars, 20 µm. (D) Quantification of TUNEL-positive β cells (right panel; n = 6 mice). (E) Representative transmission electron micrographs of pancreas tissue from WT and Trx2 ADKO mice (three images/mouse, n = 3 mice/group). Squares correspond to the magnified areas (bottom panel). Scale bars, 1 µm. M, mitochondria. Arrowheads indicate empty granules. (F) Quantification of insulin granules per µm2 islet. (G) Representative transmission electron micrographs of kidney tissue from WT and Trx2ADKO mice (n = 3). White squares correspond to the magnified areas (bottom panel). Red arrowhead indicates podocyte foot process fusion. Scale bars, 1 µm. (H–L) Quantitative analysis of de novo lipogenesis and hepatic gluconeogenic genes. (H) Relative mRNA expression of lipogenesis genes in liver in 14-wk-old male WT and Trx2ADKO mice (n = 6). (I and J) Relative mRNA expression of hepatic gluconeogenic genes in liver of 14-wk-old male WT and Trx2ADKO mice (n = 8). (K) Relative mRNA expression of the indicated de novo lipogenesis genes in eWAT of 14-wk-old male WT and Trx2ADKO mice (n = 8). (L) Relative mRNA expression of lipolysis genes in eWAT in 14-wk-old male WT and Trx2ADKO mice (n = 6). Quantitative data represent the mean ± SEM. ns, not significant; **, P < 0.01; ***, P < 0.001 compared with WT controls (two-tailed Student’s t test). Acc, acetyl-CoA carboxylase 1; Atgl, adipose TG lipase; Fasn, fatty acid synthase; G6p, glucose 6-phosphatase; Gck, glucokinase; Gys2, glycogen synthase 2; Hsl, hormone-sensitive lipase; Lpl, lipoprotein lipase; Pc, pyruvate carboxylase. (M–P) TEM analysis of brown adipose mitochondria. (M) Representative transmission electron micrographs of interscapular BAT (iBAT) sections from WT and Trx2ADKO mice at the indicated ages. Asterisks indicate LDs. Squares correspond to the magnified areas (bottom panel). Arrowheads indicate mitochondria. Scale bars, 0.5 µm. (N–P) Number of mitochondria, number of damaged mitochondria, and cristae surface area/outer membrane (OM) surface area (six images/mouse; n = 3 mice/group). Quantitative data represent the mean ± SEM. ns, not significant; *, P < 0.05; **, P < 0.01; ***, P < 0.001 versus WT (two-tailed Student’s t test). w, weeks.
Figure 2.
Figure 2.
HFD enhances type 2 diabetic phenotype in Trx2ADKO mice. (A) Growth curves of WT and Trx2ADKO male mice fed the NCD or HFD (n = 8). (B) Hematoxylin and eosin–stained sections of eWAT from 14-wk-old WT and Trx2ADKO mice fed the NCD or HFD for 8 wk. Diameters of adipocyte in eWAT and ingWAT were quantified. n = 8. Scale bars, 100 µm. (C) Fasting blood glucose levels and serum insulin levels of WT and Trx2ADKO mice fed the NCD or HFD (n = 8). (D and E) GTT (D) and ITT (E) assays in 14-wk-old male WT and Trx2ADKO mice fed the NCD or HFD for 8 wk (n = 8). AUC (120 min) was calculated (bottom panel). Quantitative data are presented as mean ± SEM. *, P < 0.05; **, P < 0.01; ***, P < 0.001 versus the indicated comparisons. Significance was assessed by one-way ANOVA followed by Tukey’s post hoc test.
Figure 3.
Figure 3.
Adipocyte-specific Trx2 KO promotes hepatic steatosis and hepatic insulin resistance. (A) Representative photograph of livers from 14-wk-old male WT and Trx2ADKO mice fed the NCD or HFD for 8 wk (n = 6). Arrowheads indicate visible lipid deposition. Scale bars, 2 mm. (B) Liver weight and liver weight to body weight ratios of WT and Trx2ADKO mice (KO) mice. (C) Liver TG content of mice. (D) Representative images of BODIPY staining of liver and quadriceps muscle from 14-wk-old male WT and Trx2ADKO mice fed the HFD for 8 wk (n = 6). Squares correspond to the magnified areas (middle panel). Scale bars, 50 µm. (E–H) Serum concentration of TG (E), cholesterol (F), NEFA (G), and adiponectin (H) in WT and Trx2ADKO mice (n = 6). (I–Q) The hyperinsulinemic-euglycemic clamp study from WT and Trx2ADKO mice (n = 7). (I) A steady plasma glucose is shown. (J) Levels of glucose after external infusion. (K) Glucose infusion rate required to maintain euglycemia during the final 40 min of the clamp. (L) Hepatic glucose production and suppression of HGP under basal and insulin-stimulated (clamp) conditions. (M) Insulin-stimulated whole-body glucose uptake. (N) Plasma NEFA concentrations and suppression of NEFA under basal and insulin-stimulated (clamp) conditions. (O–Q) Lipolysis with decreased suppression of glycerol, palmitate, and fatty acid turnover under basal and insulin-stimulated (clamp) conditions. Quantitative data are shown as mean ± SEM. *, P < 0.05; **, P < 0.01; ***, P < 0.001 versus the indicated comparisons. Significance was established using one-way ANOVA followed Tukey’s post hoc test (B, C, and E–H) and two-tailed Student's t test (I–Q).
Figure 4.
Figure 4.
Adipocyte-specific Trx2 KO results in severe mitophagy and mitochondrial dysfunction. (A–C) Serum levels of NEFA (A), adiponectin (B), and leptin (C) in WT and Trx2ADKO mice (n = 6). (D) Diagram of tricarboxylic acid (TCA) cycle and OXPHOS. Cit1 (citrate synthase), Idh1 (isocitrate dehydrogenase), Kgd1 (α-ketoglutarate dehydrogenase), Lsc1 (succinyl-CoA ligase), Sdh1 (succinate dehydrogenase), Fum1 (fumarase), and Mdh1 (mitochondrial malate dehydrogenase). (E) Immunoblot analysis of Trx2 and rate-limiting enzymes of the tricarboxylic acid cycle and OXPHOS complexes I–V from WT and Trx2ADKO mice. Protein levels were quantified and presented as fold changes by taking WT as 1.0. n = 4 mice for each group. (F) Real-time PCR analysis of mitochondrial genes in eWAT from WT and Trx2ADKO mice at 14 and 24 wk (n = 8). (G) Mitochondrial DNA content in eWAT of WT and Trx2ADKO mice (n = 8). (H) ATP content of mitochondria isolated from eWAT of WT and Trx2ADKO mice (n = 6). (I) Representative transmission electron micrographs of eWAT sections from WT and Trx2ADKO mice at 5, 14, and 24 wk (six images/mouse, n = 3 mice/group). Asterisks indicate LDs. Arrowheads indicate mitochondria. Scale bars, 0.5 µm. Squares correspond to the magnified areas (bottom panel). (J–L) Quantification of total number of mitochondria, damaged mitochondria, and ratio of cristae surface area/outer membrane (OM) surface area (six images/mouse, n = 3 mice/group). Quantitative data are presented as mean ± SEM. ns, not significant; *, P < 0.05; **, P < 0.01; ***, P < 0.001 for the indicated comparisons (two-tailed Student’s t test). w, weeks.
Figure 5.
Figure 5.
Trx2 deficiency increases mitochondrial ROS generation and NF-κB activation. (A and B) Immunoblot analysis of proteins involved in mitochondrial dynamics and mitophagy in eWAT of WT and Trx2ADKO mice at 14 and 24 wk (n = 3). β-Actin was used as a loading control. (C) Representative micrographs of eWAT sections showing ROS levels, as assessed by the mitochondrial-specific ROS probe mitoSOX, and quantification of fluorescence intensity in WT and Trx2ADKO mice at 14 and 24 wk (n = 6). AFU, arbitrary fluorescence unit. (D) Representative Western blot showing protein levels of Trx2, Prx3, Glut4, HSL, and PPARγ in eWAT from WT and Trx2ADKO mice at 14 and 24 wk. (E) Immunoblot analysis of IKK–NF-κB signaling molecules (phospho-IKKα/β, IKKβ, phospho-P65, P65, phospho-IκB, IκB, phospho-AKT, and AKT) in eWAT from WT and Trx2ADKO mice at 14 and 24 wk. Protein levels (A, B, D, and E) were quantified and presented as fold changes by taking WT as 1.0. n = 3 mice for each group. (F) Coimmunostaining of phospho-P65 (green) and adipocyte marker FABP4 (red) in eWAT sections from 14-wk-old male WT and Trx2ADKO mice (n = 6). White arrowheads indicate phospho-p65 in the nucleus. (G) Coimmunostaining of P65 (green) and macrophage marker F4/80 (red) in eWAT sections from 14-wk-old male WT and Trx2ADKO mice.(H and I)Quantification of TNF-α and IL-6 in eWAT and serum of WT and Trx2ADKO mice at 14 and 24 wk (n = 8). Data are presented as mean ± SEM. **, P < 0.01; ***, P < 0.001 for the indicated comparisons. Significance was assessed by two-tailed Student’s t test. Scale bars, 50 µm (C); 20 µm (F and G). w, weeks.
Figure S4.
Figure S4.
Trx2 deficiency increases ROS in isolated adipocytes and alters mitochondrial energetics and oxidative metabolism. (A–D) TRX2 deficiency reduces lipogenesis during preadipocytes differentiation. (A) Differentiation scheme of preadipocytes isolated from eWAT of WT (Trx2lox/lox) and Trx2ADKO (KO) mice. (B) Representative Western blots confirming a decrease of TRX2 expression in Trx2ADKO adipocytes during differentiation upon Adipo-Cre was activated on day 4. Adeno-Cre infection rapidly induced Trx2 deletion. Protein levels were quantified and are presented as fold changes by taking WT as 1.0. n = 3. (C and D) Representative BODIPY staining images of WT and KO differentiated adipocytes at day 8 (C) and LD sizes (D) from six random fields were quantified (n = 3 biological repeats). (E) Representative micrographs of mitochondrial ROS levels by the mitoSOX staining of WT and Trx2ADKO (KO) differentiated adipocytes at day 4 in the presence or absence of mito-TEMPO (n = 3). (F) Quantification of mitochondrial ROS levels of WT and KO differentiated adipocytes at different time points (n = 3). AFU, arbitrary fluorescence unit. (G) ATP content of mitochondria from WT and KO adipocytes during differentiation (n = 6). (H and I) Confocal fluorescence images showing mitochondrial dynamics stained with TOMM20 antibody (H) and quantified mitochondrial density via fluorescence intensity (I; six images/mouse, n = 3 mice/group). (J) Western blot analysis of mitochondrial fusion mediators MFN1 and OPA1, fusion mediators Drp1 and Fis1 from WT and KO adipocytes at different differentiation time points. Protein levels were quantified and presented as fold changes by taking WT as 1.0 (n = 3). (K) Trx2 deletion in adipocytes decreased mitochondrial membrane potential. Mitochondrial membrane potential (ΔΨm) was assessed with the JC-1 probe by confocal microscopy at day 4 (left panel) and quantified by a red to green fluorescence intensities ratio (right panel). Scale bars, 20 µm. Data are representative of three experiments in 10 randomly selected fields from each group (n = 3). Ctrl, control. (L) The oxygen consumption rate (OCR) of WT and KO differentiated adipocytes measured by Seahorse at day 4 (n = 3). Quantitative data are presented as mean ± SEM. ns, not significant; *, P < 0.05; **, P < 0.01; ***, P < 0.001 versus the corresponding value for control. Significance was analyzed by two-tailed Student’s t test. Scale bars, 20 µm (C, E, H, and K). FCCP, carbonyl cyanide-4-(trifluoromethoxy)phenylhydrazone.
Figure 6.
Figure 6.
Trx2 deficiency promotes mitophagy through NF-κB–dependent p62/SQSTM1 accumulation and mitochondrial recruitment. (A) Representative transmission electron micrographs showing typical mitophagy in differentiated adipocytes of Trx2ADKO mice on day 8 (n = 3 mice/group). Squares correspond to the magnified areas. Arrows indicate mitochondria. Scale bars, 1 µm. (B) Percentage of damaged mitochondria in 10 random fields (n = 20 cells/group). (C) Immunoblot analysis of Trx2, mitophagy receptors p62 and NBR1, and autophagy markers LC3 and Beclin-1 in differentiated adipocytes of WT and Trx2ADKO mice during differentiation. (D) Subcellular distribution of p62, LC3, and Beclin-1 in differentiated adipocytes of WT and Trx2ADKO mice at day 4. Voltage-dependent anion channel was used as a mitochondrial control. (E) Immunoblot analysis of mitophagy-related proteins in mitochondrial fraction of differentiated adipocytes of WT and Trx2ADKO mice at day 4 of differentiation. Inner membrane protein TOMM20 was used as a control. (F) Immunoblot analysis of NF-κB signaling proteins from differentiated adipocytes (day 4) of WT and Trx2ADKO mice in the absence or presence of mito-TEMPO. (G) Representative immunoblot analysis of mitochondrial dynamics and mitophagy-related proteins from day differentiated adipocytes of WT and Trx2ADKO mice in the absence or presence of mito-TEMPO. (H) Representative immunoblot of NF-κB signaling proteins and mitophagy-related proteins with and without IKK inhibitor BMS-345541 in differentiated adipocytes (day 4) of WT and Trx2ADKO mice. Protein levels (C–H) were quantified and presented as fold changes by taking untreated WT as 1.0. n = 3 mice for each group. (I) Coimmunoprecipitation (IP) was performed using anti-IgG or anti-p62 and immunoblotting (IB) with anti-ubiquitin antibody (Ub) in differentiated adipocytes of WT and Trx2ADKO mice at day 4. The experiment was repeated three times. (J) Confocal fluorescence images showing colocalization of p62 (green) and polyubiquitin (poly-Ub, purple) with mitochondria (TOMM20, red) in adipocytes of WT and Trx2ADKO mice during differentiation. Images are representative of three independent experiments. Scale bars, 10 µm. Quantitative data represent the mean ± SEM. ***, P < 0.001 versus WT (two-tailed Student’s t test).
Figure 7.
Figure 7.
Elevated oxidative stress–NF-κB–p62 pathway in adipose tissues from T2DM patients. (A) The heatmap displayed DEGs among isolated primary human adipocytes from the lean, obesity, and T2DM groups using hierarchical clustering analysis (n = 6/group). (B and C) Statistical analysis of RNA-sequencing gene expression for obesity (B) and T2DM (C) compared with lean as volcano plots. (D) KEGG pathway analysis of DEGs indicated that ROS pathway, NF-κB signaling, and fatty acid metabolism were affected pathway in T2DM adipocytes (arrow). (E) The mRNA level of representative genes related to ROS regulation, inflammation, and fatty acid metabolism in adipocytes (n = 6/group). (F) Heatmap showing the expression of key inflammatory activation related genes in adipocytes between the lean and T2DM groups. (G) GSEA demonstrating enrichment score (ES) of gene sets in RNA-sequencing data of adipocytes. Genes in each gene set were ranked by signal-to-noise ratio according to their differential expression between the lean group and the T2DM group. FDR, false discovery rate. (H–N) Trx2–NF-kB analyses in ND subjects (n = 10) and patients with T2DM-HS (n = 12). (H and I) Relative levels of Trx2 and TNFA mRNA in visceral adipose tissues. (J) Representative Western blot analysis of Trx2, phospho-P65, and P65 in individual visceral adipose tissues of ND and T2DM-HS. Protein levels were quantified and presented as fold changes by taking WT as 1.0. n = 4 for each group. (K) Representative immunofluorescence staining of Trx2 and P65 in visceral adipose tissues from ND and T2DM-HS. (L–N) Gene expression of PINK-1, PRKN, and SQSTM1 in isolated visceral adipose tissues from ND and T2DM-HS patients. Quantitative data are presented as mean ± SEM. ns, not significant, *, P < 0.05; **, P < 0.01 versus corresponding control. Significance was assessed by two-tailed Student’s t test. Scale bars, 50 µm (K). AGE-RAGE, advanced glycation end product–receptor for advanced glycation end product.
Figure S5.
Figure S5.
Mitochondria-specific antioxidant mito-TEMPO ameliorates adipocyte dysfunction and T2DM in Trx2ADKO mice. WT and Trx2ADKO mice at age of 6 wk received injections of mito-TEMPO (0.7 mg/kg/d, i.p. every other day) or vehicle (saline) for 8 wk. Body weight and blood glucose levels were measured at various ages and mouse tissues were harvested at week 14 for analyses. (A and B) Body weight (A) and fasting blood glucose levels (B) of mice at the indicated ages (n = 8 per group). (C) Representative hematoxylin and eosin staining showing overall eWAT morphology and adipocyte size in eWAT (n = 3 per group). (D) ROS analysis was performed by immunofluorescence microscopy of mitoSOX-stained eWAT, and quantification of fluorescence intensity with and without mito-TEMPO treatment. AFU, arbitrary fluorescence unit (n = 3 per group). (E) Immunoblot analysis of eWAT tissues (n = 3 per group). Protein levels were quantified and presented as fold changes by taking WT as 1.0. n = 3 mice for each group. (F and G) Coimmunostaining of phospho-P65 (green) and FABP4 (red) in eWAT sections. Representative images are shown in F with quantifications in G. n = 3 per group. White arrowheads indicate phospho-P65 in the nucleus. (H) ATP content of mitochondria isolated from eWAT of mice (n = 6 per group). (I–K) Plasma levels of NEFA (I), adiponectin (J), and TG (K; n = 8 per group). *, P < 0.05; ***, P < 0.001 (one-way ANOVA followed by Tukey’s post hoc test). Scale bars, 20 µm (C), 100 µm (D), and 50 µm (F).
Figure 8.
Figure 8.
Inhibition of NF-κB activity ameliorates T2DM in Trx2ADKO mice. 6-wk-old male Trx2ADKO and WT mice were treated with 60 mg/kg BMS-345541 by i.p. injection once every 2 d for 8 wk. (A and B) Body weight (A) and fasting blood glucose levels (B) in WT and Trx2ADKO mice with or without BMS-345541 treatment (n = 8) at the indicated ages. (C) Representative images of BODIPY staining showing liver lipid deposition of mice at 14 wk of age. Scale bars, 50 µm. (D and E) Liver TG content and serum TG level were measured. n = 6. (F) Immunoblot analysis of eWAT tissues from mice at 14 wk of age. Protein levels were quantified and presented as fold changes by taking WT as 1.0. n = 3 mice for each group. (G) Representative transmission electron micrographs of eWAT sections from mice at 14 wk of age (six images/mouse, n = 3 mice/group). Asterisks indicate LDs. Arrowheads indicate mitochondria. Scale bars, 0.5 µm. (H and I) Serum cytokines TNF-α and IL-6 proteins were measured by ELISA kits (n = 8). (J) ATP content of mitochondria isolated from eWAT of mice at 14 wk of age (n = 8). (K and L) Serum levels of NEFA (K) and adiponectin (L) of 14-wk-old mice (n = 8). Quantitative data are presented as mean ± SEM. *, P < 0.05; **, P < 0.01; ***, P < 0.001 versus the indicated comparisons. Significance was assessed by one-way ANOVA followed by Tukey’s post hoc test. (M) A schematic diagram summarizing our findings that Trx2 deficiency promotes severe mitophagy via mitochondrial ROS/NF-κB/p62 signaling, which contributes to hepatic insulin resistance related T2DM (see text for details). N, nucleus; DHAP, dihydroxyacetonephosphate. TAG, triacylglycerol; VLDL, very low-density lipoprotein.

References

    1. Baixauli, F., Martin-Cofreces N.B., Morlino G., Carrasco Y.R., Calabia-Linares C., Veiga E., Serrador J.M., and Sanchez-Madrid F.. 2011. The mitochondrial fission factor dynamin-related protein 1 modulates T-cell receptor signalling at the immune synapse. EMBO J. 30:1238–1250. 10.1038/emboj.2011.25 - DOI - PMC - PubMed
    1. Baker, R.G., Hayden M.S., and Ghosh S.. 2011. NF-kappaB, inflammation, and metabolic disease. Cell Metab. 13:11–22. 10.1016/j.cmet.2010.12.008 - DOI - PMC - PubMed
    1. Bi, P., Shan T., Liu W., Yue F., Yang X., Liang X.R., Wang J., Li J., Carlesso N., Liu X., and Kuang S.. 2014. Inhibition of Notch signaling promotes browning of white adipose tissue and ameliorates obesity. Nat. Med. 20:911–918. 10.1038/nm.3615 - DOI - PMC - PubMed
    1. Birkenfeld, A.L., and Shulman G.I.. 2014. Nonalcoholic fatty liver disease, hepatic insulin resistance, and type 2 diabetes. Hepatology. 59:713–723. 10.1002/hep.26672 - DOI - PMC - PubMed
    1. Bogacka, I., Xie H., Bray G.A., and Smith S.R.. 2005. Pioglitazone induces mitochondrial biogenesis in human subcutaneous adipose tissue in vivo. Diabetes. 54:1392–1399. 10.2337/diabetes.54.5.1392 - DOI - PubMed

Publication types

MeSH terms