. 2020 Dec 14;18(12):e3001008.
doi: 10.1371/journal.pbio.3001008. eCollection 2020 Dec.

Neuroinflammation in the normal-appearing white matter (NAWM) of the multiple sclerosis brain causes abnormalities at the nodes of Ranvier

Affiliations

Neuroinflammation in the normal-appearing white matter (NAWM) of the multiple sclerosis brain causes abnormalities at the nodes of Ranvier

Patricia Gallego-Delgado et al. PLoS Biol. .

Abstract

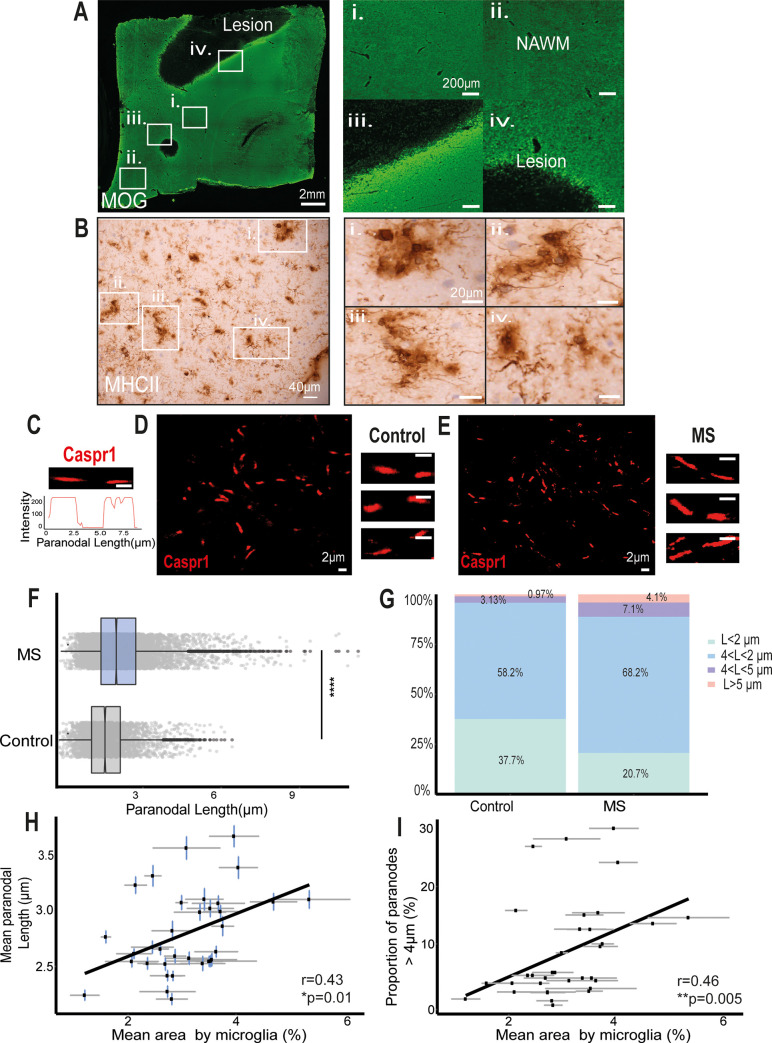
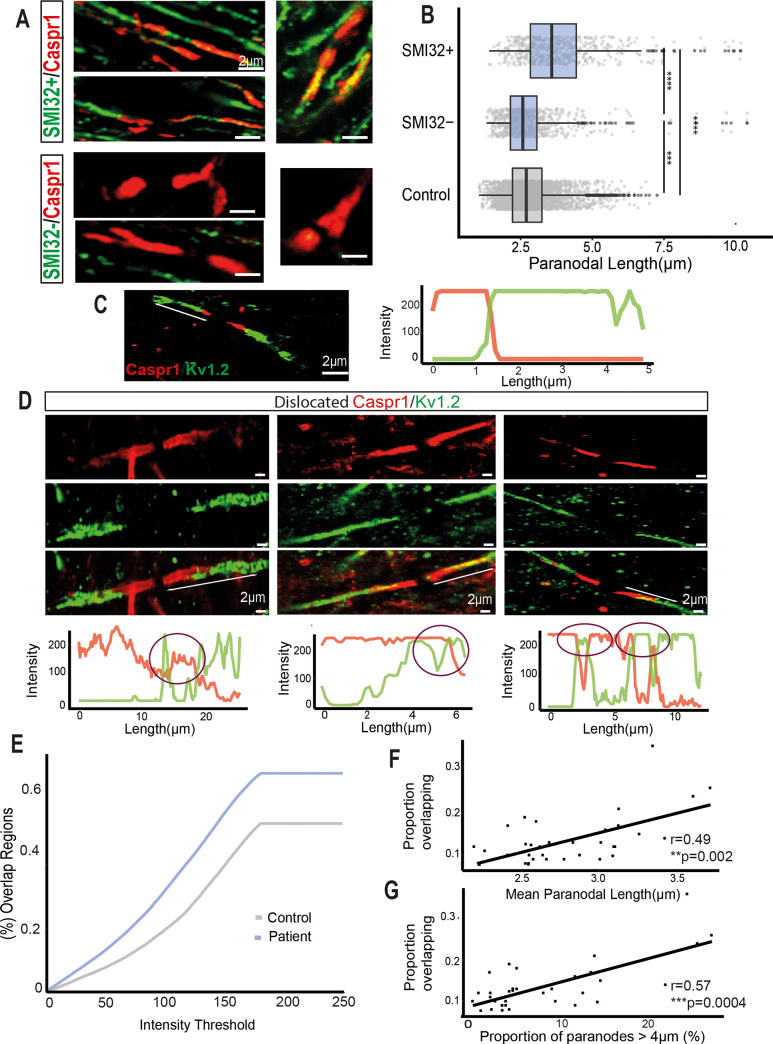
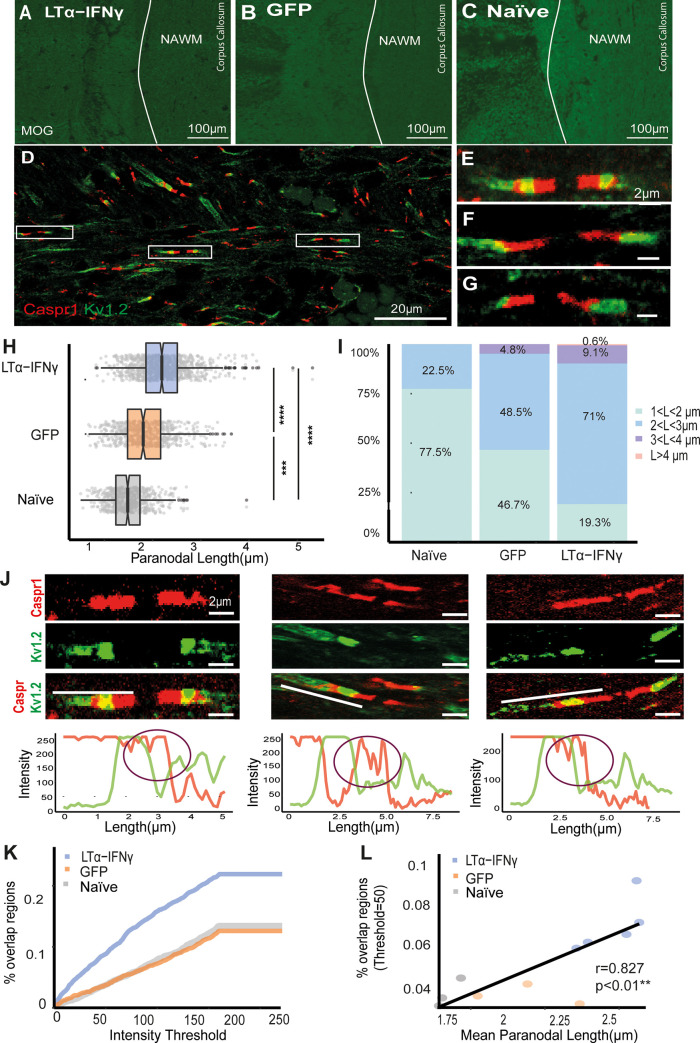
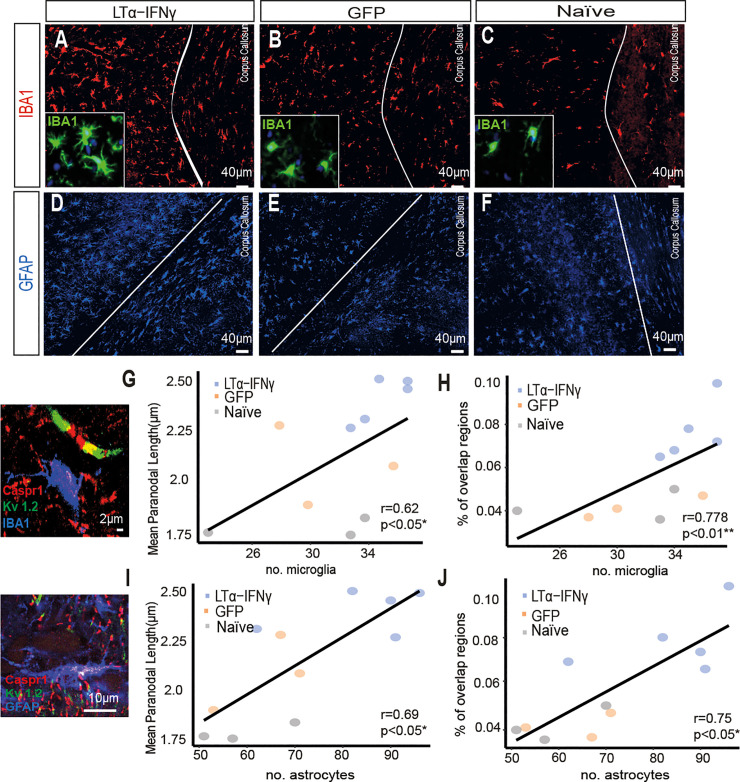
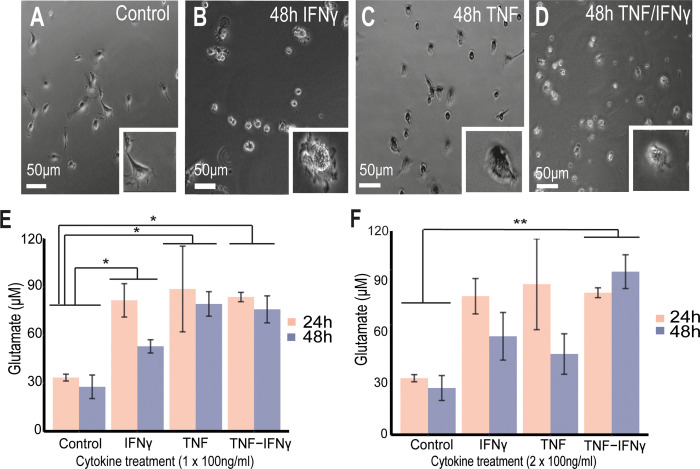
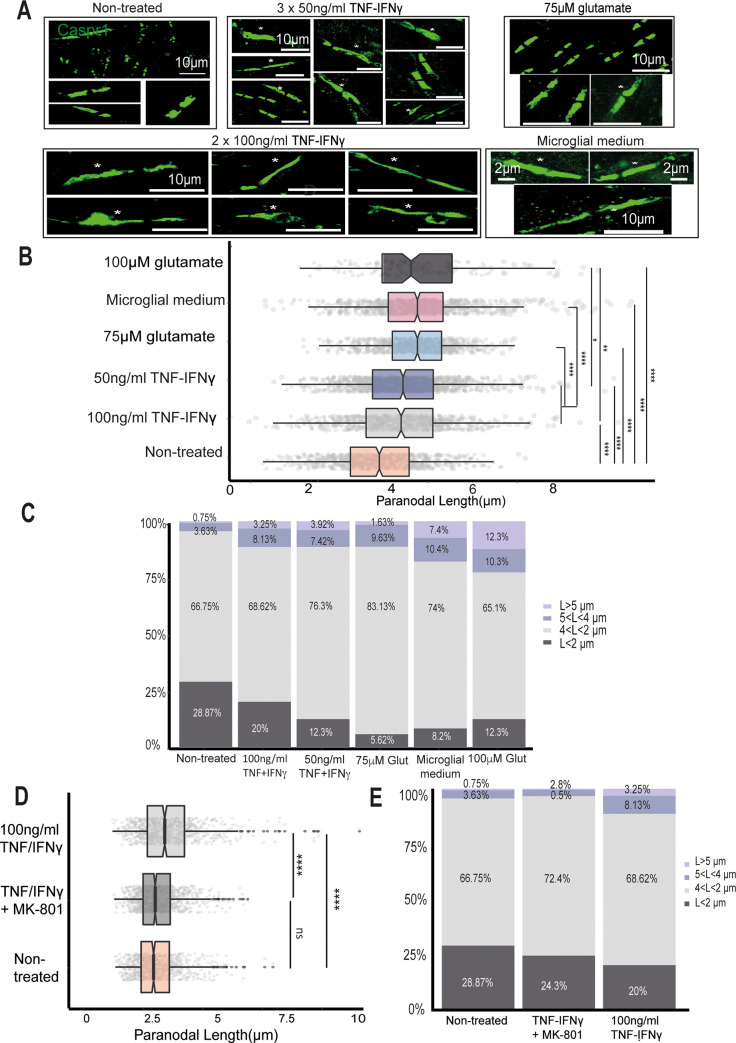
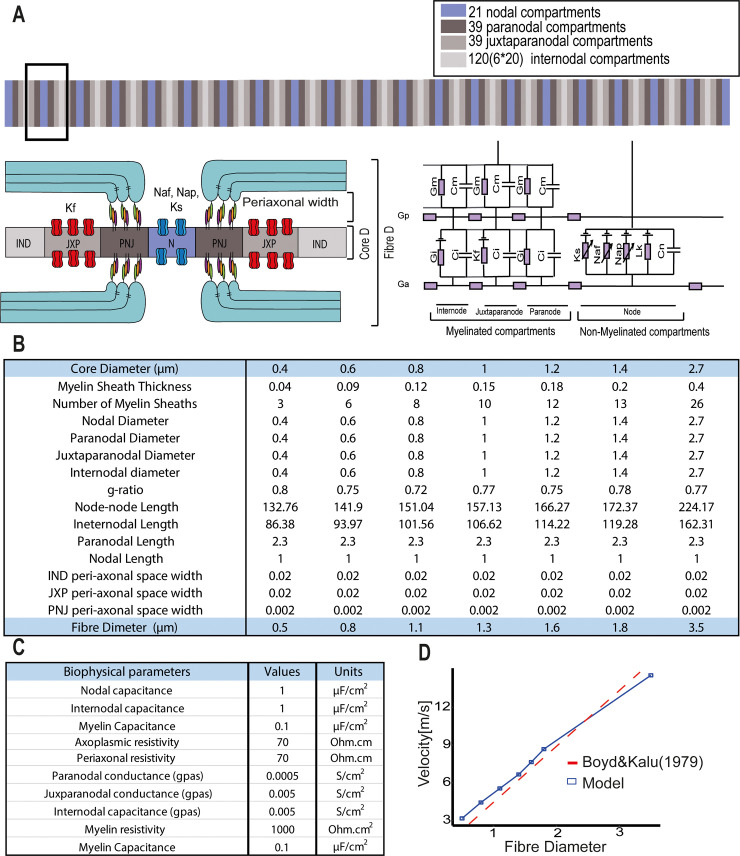
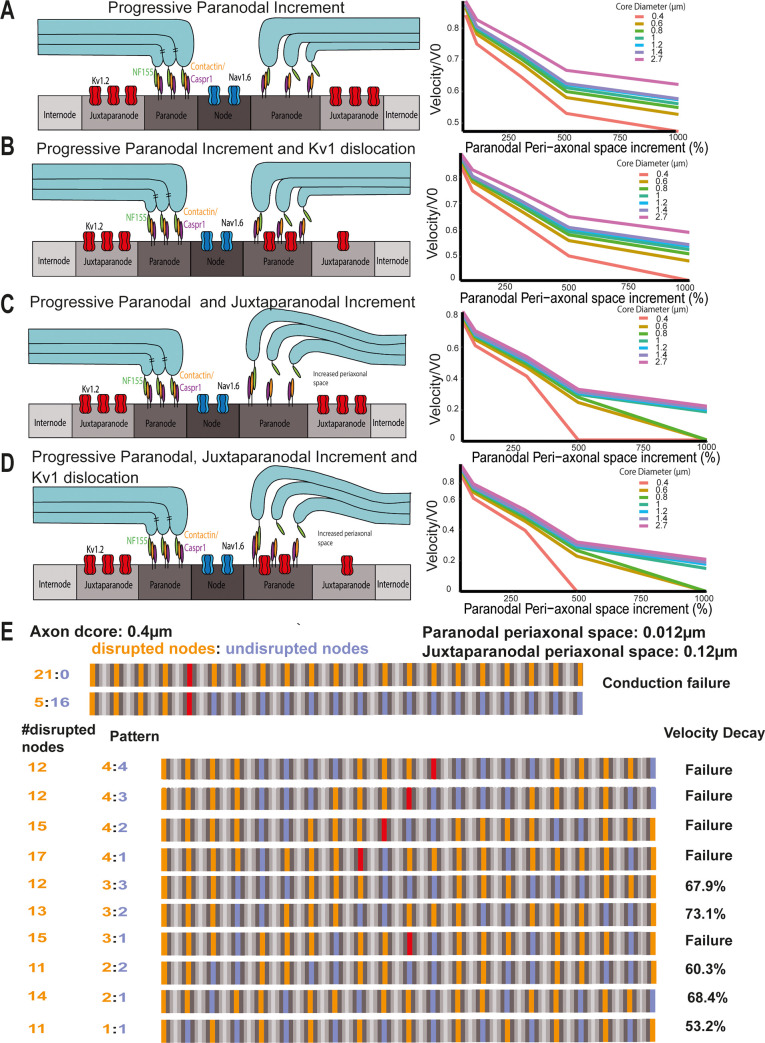
Changes to the structure of nodes of Ranvier in the normal-appearing white matter (NAWM) of multiple sclerosis (MS) brains are associated with chronic inflammation. We show that the paranodal domains in MS NAWM are longer on average than control, with Kv1.2 channels dislocated into the paranode. These pathological features are reproduced in a model of chronic meningeal inflammation generated by the injection of lentiviral vectors for the lymphotoxin-α (LTα) and interferon-γ (IFNγ) genes. We show that tumour necrosis factor (TNF), IFNγ, and glutamate can provoke paranodal elongation in cerebellar slice cultures, which could be reversed by an N-methyl-D-aspartate (NMDA) receptor blocker. When these changes were inserted into a computational model to simulate axonal conduction, a rapid decrease in velocity was observed, reaching conduction failure in small diameter axons. We suggest that glial cells activated by pro-inflammatory cytokines can produce high levels of glutamate, which triggers paranodal pathology, contributing to axonal damage and conduction deficits.


Conflict of interest statement

I have read the journal's policy and the authors of this manuscript have the following competing interests: PG, RJ, EB, JM, SU and CP have no competing interests. RR has received research funds from MedImmune plc and consultancy fees from Roche and Novartis. OWH has received consultancy fees from Roche.

Figures

Fig 1
Fig 1. MS NAWM regions contained a larger proportion of elongated paranodes associated with activated microglia.
(A) Anti-MOG-myelin immunofluorescence was used to identify areas of demyelination and normal appearing myelin. NAWM regions of interest (i, ii) were selected as areas distant from demyelinating lesions (iii, iv). (B) Clusters of process bearing anti-HLA-DR+ microglia with an activated morphology were found throughout the NAWM regions of interest and are illustrated at higher magnification in panels i–iv. (C) Confocal image of single Caspr1-stained paranode in cross-section and its intensity profile. (D, E) Confocal images of paranodes from human postmortem non-neurological control (D) and NAWM MS tissue (E). (F) Significantly different distributions of Caspr1+ paranodal lengths occurred in NAWM MS tissue in comparison to non-neurological control tissue (p < 0.0001, Mann–Whitney test). (G) NAWM MS tissue contained a larger proportion of Caspr1+ paranodes longer than 4 μm and 5 μm than the control tissue. (H) The mean paranodal length per block correlated with the mean area occupied by HLA-DR+ microglia/ macrophages (r = 0.43, *p < 0.5, Spearman rank correlation test). (I) The mean area occupied by HLA-DR+ microglia/macrophages per block correlated with the proportion of paranodes longer than 4 μm (r = 0.46, **p < 0.01, Spearman rank correlation test). MOG, myelin oligodendrocyte glycoprotein; MS, multiple sclerosis; NAWM, normal-appearing white matter. Data and code to reproduce this figure can be found at: https://github.com/PatGal2020/PLOS_submission
Fig 2
Fig 2. Paranodal elongation was associated with SMI32+ axons and the dislocation of juxtaparanodal voltage-gated Kv1.2 channels.
(A) Confocal images of long Caspr1+ paranodes co-stained with SMI32 antibody. SMI32+ axons characterised by dephosphorylated neurofilaments had elongated paranodes. (B) Paranodal length distributions of SMI32+ and SMI32− axons from MS NAWM and non-neurological control tissue (**** p < 0.0001, Mann–Whitney test). (C) Confocal image from a node showing the expression of Caspr1 in the paranode (red) and Kv1.2 channels in the juxtaparanodes (green) do not overlap under non-pathological conditions and the respective RGB profile. (D) Confocal images from nodes where Caspr1 and Kv1.2 are colocalising, and therefore possibly being affected by MS neuropathological conditions and their intensity RGB profiles. The purple circles denote regions where both signals are colocalising: overlapping regions. (E) When the difference between Caspr1 and Kv1.2 signals was smaller than a variable intensity threshold, we considered that point as an overlapping region. For every threshold calculated, the proportion of overlapping regions was larger in MS NAWM tissue (blue) than in non-neurological control tissue (grey). (F) The mean paranodal length per block correlated with the proportion of overlapping regions at an intensity threshold of 50 (r = 0.49, **p < 0.01, Spearman rank correlation test). (G) The proportion of paranodes longer than 4 μm per block correlated with the proportion of overlapping regions at a threshold of 50 (r = 0.57, ***p < 0.001, Spearman rank correlation test). MS, multiple sclerosis; NAWM, normal-appearing white matter. Data and code to reproduce this figure can be found at: https://github.com/PatGal2020/PLOS_submission.
Fig 3
Fig 3. LTα/IFNγ-affected rat tissue contained a higher proportion of elongated Caspr1-paranodes compared to the GFP and naive.
(A–C) Immunofluorescent images of MOG-stained corpus callosum, cingulate, and external capsule of the LTα/IFNγ, GFP, and naive rats. (D) Confocal image of Caspr1-Kv1.2-stained paranodes and juxtaparanodes from a LTα/IFNγ rat. (E–G) Confocal images of single Caspr1-Kv1.2-stained paranodes and juxtaparanodes from a LTα/IFNγ rat. (H) Caspr1-measured paranodal length distributions of LTα/IFNγ (blue), GFP (orange), and naive (grey) rat groups (**** p < 0.0001, Mann–Whitney test). (I) Paranodal length data were divided into different length ranges and represented in a bar plot. LTα/IFNγ vector-injected brains contained a larger proportion of paranodes longer than 3 and 4 μm. (J) Confocal images in which Caspr1-stained paranodes colocalised with Kv1.2-stained juxtaparanodes. In order to quantify the displacement of the channels, the RGB intensity profiles of each paranode and juxtaparanode were acquired. The purple circles denote regions where both signals were colocalising. (K) Graph showing that the proportion of overlapping regions between Caspr1 and Kv1.2 RGB signals was larger at every intensity threshold in the LTα/IFNγ group compared to the GFP and naive groups. (L) Mean paranodal length correlated significantly with the proportion of overlapping regions when the intensity threshold was set to 50 (r = 0.827, **p < 0.01, Spearman rank correlation test). GFP, green fluorescent protein; IFNγ, interferon-γ; LTα, lymphotoxin-α; MOG, myelin oligodendrocyte glycoprotein. Data and code to reproduce this figure can be found at: https://github.com/PatGal2020/PLOS_submission.
Fig 4
Fig 4. Paranodal lengthening and Kv1.2 dislocation occurs simultaneously, and they are linked to glial activation.
(A–C) Immunofluorescent images of IBA1+ microglia (red) from the corpus callosum of LTα-IFNγ, GFP, and naive rats. Insets show that microglia (shown in green) display a highly activated morphology in the cytokine vector-injected animals compared to the GFP control and naive animals. (D–F) Immunofluorescent images of GFAP+ astroglia from the corpus callosum of the LTα/IFNγ, GFP, and naive rats. (G) The number of microglia correlated with the mean paranodal length per rat (r = 0.62, *p < 0.05, Spearman rank correlation test). (H) The number of microglia correlated with the proportion of overlapping regions between Caspr1 and Kv1.2 when the intensity threshold was set to 50 (r = 0.778, **p < 0.01, Spearman rank correlation test). (I) The number of astroglia correlated with the mean paranodal length per rat (r = 0.69, *p < 0.05, Spearman rank correlation test). (J) The number of astroglia correlated with the proportion of overlapping regions between Caspr1 and Kv1.2 when the intensity threshold was set to 50 (r = 0.75, *p < 0.05, Spearman rank correlation test). GFP, green fluorescent protein; IFNγ, interferon-γ; LTα, lymphotoxin-α. Data and code to reproduce this figure can be found at: https://github.com/PatGal2020/PLOS_submission.
Fig 5
Fig 5. TNF/IFNγ-activated microglia release high amounts of glutamate.
(A) Live image of nontreated primary microglial cultures, (B) cultures treated with IFNγ after 48 h, (C) cultures treated with TNF after 48 h, and (D) cultures treated with TNF/IFNγ after 48 h. (E, F) Mean ± SEM for glutamate levels from replicates showing the statistical difference between controls and the cytokine treatments: (E) 100 ng/ml (n = 3 Control, n = 3 TNF, n = 3 IFNγ, n = 3 TNF/IFNγ), (F) 2 acute treatments of 100 ng/ml (n = 3 Control, n = 3 TNF, n = 3 IFNγ, n = 4 TNF/IFNγ). Nonparametric Friedman test was performed across cytokine groups and timings and post hoc paired-wised Wilcoxon tests to compare groups (* p < 0.05, ** p < 0.01). IFNγ, interferon-γ; TNF, tumour necrosis factor. Data and code to reproduce this figure can be found at: https://github.com/PatGal2020/PLOS_submission.
Fig 6
Fig 6. The proportion of elongated paranodes in cerebellar tissue slices treated with pro-inflammatory cytokines and glutamate.
(A) Confocal images of Caspr1-stained paranodes from nontreated cerebellar cultures, slices treated with 3 doses of 50 ng/ml TNF/IFNγ, slices treated with 2 doses of 100 ng/ml TNF/IFNγ, slices treated with 2 doses of 75 μM glutamate, and slices treated with 2 doses of microglial-conditioned medium (medium from primary microglia treated with 2 doses of 100 ng/ml TNF/IFNγ); asterisks point to long and disrupted paranodes. (B) Box-plots showing the different paranodal length distributions between the treated and nontreated cultures (nonparametric Kruskal–Wallis test and post hoc Wilcoxon rank sum test, ****p < 0.0001). (C) Bar plots of the same paranodal length distributions showing the proportion of paranodes in each data set of different lengths. (D) Box-plot of the paranodal length distributions of the nontreated cultures (orange), 2 doses of 100 ng/ml TNF + IFNγ with MK-801 (dark grey), and 2 doses of 100 ng/ml TNF + IFNγ alone (light grey) (**** p < 0.0001, Mann–Whitney test). (E) Bar plot showing the same paranodal length distributions divided into different length ranges. IFNγ, interferon-γ; TNF, tumour necrosis factor. Data and code to reproduce this figure can be found at: https://github.com/PatGal2020/PLOS_submission.
Fig 7
Fig 7. Structural and biophysical parameters used to simulate a 21 node myelinated axon.
(A) A double cable circuit of the model to represent the axolemma (Ga), the peri-axonal space (Gp), and the myelin sheath (Gm) was generated with the simulator NEURON. Specifically, 21 nodal, 39 paranodal, 39 juxtaparanodal, and 20 internodal compartments were created. (B) Anatomical parameters used in the model. Seven diameters were chosen from CNS measurements from macaque EM studies [42], the number of myelin lamella (nl) was calculated from the myelin periodicity value of 0.0156 μm [71], the node-to-node length was taken from the linear relationship measured from rat nerve fibres [72], the juxtaparanodal length was extrapolated from the diameter-dependent scaling relationship from the ventral root of cats [73], and the paranodal length was determined from the average value of Caspr1 staining measured from our non-neurological control cases. (C) Biophysical parameters. Axon capacitance was based on data from rat ventral roots [86], myelin capacitance and leak conductance per lamella were based on the frog sciatic nerves [87]. The resistivity was set to 1,000 Ohm * cm2 for each myelin lamella [40,87,88,89,90,91]. (D) Plot showing the conduction velocity of the model across the 7 fibre diameters simulated (blue) and the velocity data measured in cat hind limb nerves [43].
Fig 8
Fig 8. The effects of paranodal disruption on AP conduction is inversely proportional to the axon diameter.
(A) Diagram representing the increment of the paranodal peri-axonal space and a normalised velocity plot at every core diameter as the paranodal peri-axonal space increases. (B) Diagram representing the increment of the paranodal and juxtaparanodal peri-axonal space and a normalised velocity plot at every core diameter as the paranodal peri-axonal space increases. (C) Diagram representing the increment of the paranodal and juxtaparanodal peri-axonal and Kv1 dislocation and a normalised velocity plot at every core diameter as the paranodal peri-axonal space increases. (D) Diagram representing the increment of the paranodal and juxtaparanodal peri-axonal and Kv1 dislocation and a normalised velocity plot at every core diameter as the paranodal peri-axonal space increases. (E) In an axon model with a core diameter of 0.4 μm, conduction failure occurred when 5 consecutive nodes were disrupted (orange), and the paranodal and juxtaparanodal peri-axonal space widths were increased up to 0.012 and 0.12 μm, respectively. Further, the velocity can decay and conduction can fail under different patterns of disruption (orange means disrupted node, purple, healthy node, and red denotes conduction failure).

References

    1. Friese MA, Schattling B, Fugger L. Mechanisms of neurodegeneration and axonal dysfunction in multiple sclerosis. Nat Rev Neurol. 2014;10:225–38. 10.1038/nrneurol.2014.37 - DOI - PubMed
    1. Ferguson B, Matyszak MK, Esiri MM, Perry VH. Axonal damage in acute multiple sclerosis lesions. Brain. 1997;120:393–9. 10.1093/brain/120.3.393 - DOI - PubMed
    1. Trapp BD, Peterson J, Ransohoff RM, Rudick R, Mork S, Bo L. Axonal transection in the lesions of multiple sclerosis. New Eng J Med. 1998;338:278–85. 10.1056/NEJM199801293380502 - DOI - PubMed
    1. Reynolds R, Roncaroli F, Nicholas R, Radotra B, Gveric D, Howell O. The neuropathological basis of clinical progression in multiple sclerosis. Acta Neuropathol. 2011;122:155–70. 10.1007/s00401-011-0840-0 - DOI - PubMed
    1. Nikic I, Merkler D, Sorbara C, Brinkoetter M, Kreutzfeldt M, Bareyre FM, et al. A reversible form of axon damage in experimental autoimmune encephalomyelitis and multiple sclerosis. Nat Med. 2011;17:495–9. 10.1038/nm.2324 - DOI - PubMed

Publication types

MeSH terms