. 2020 Dec 14;16(12):e1009246.
doi: 10.1371/journal.pgen.1009246. eCollection 2020 Dec.

A dynamic, ring-forming MucB / RseB-like protein influences spore shape in Bacillus subtilis

Affiliations

A dynamic, ring-forming MucB / RseB-like protein influences spore shape in Bacillus subtilis

Johana Luhur et al. PLoS Genet. .

Abstract

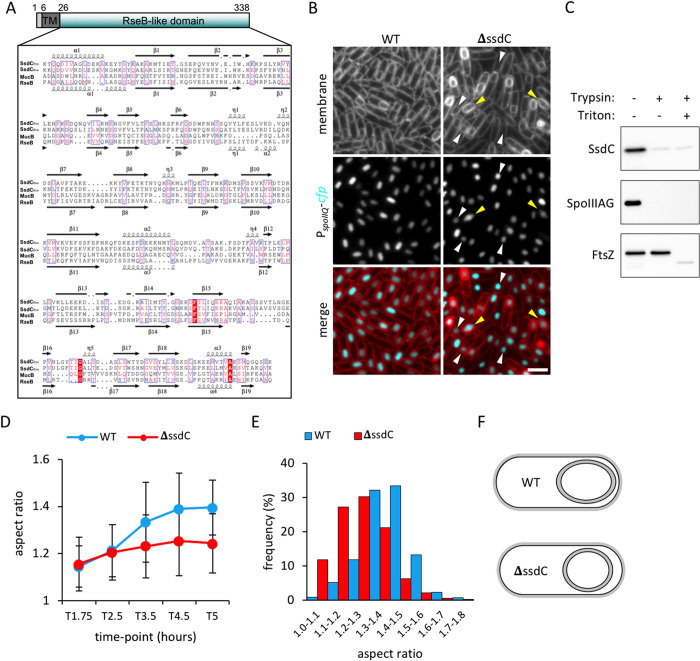
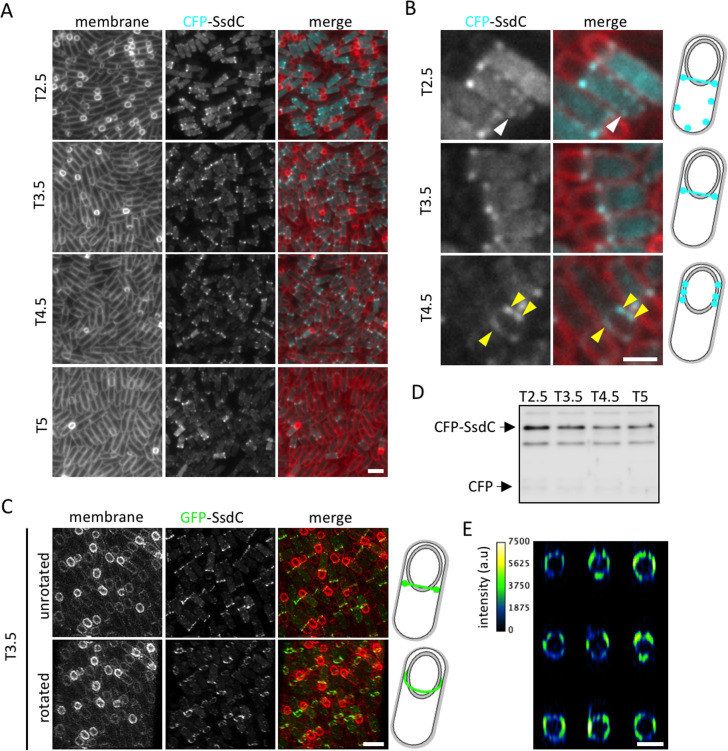
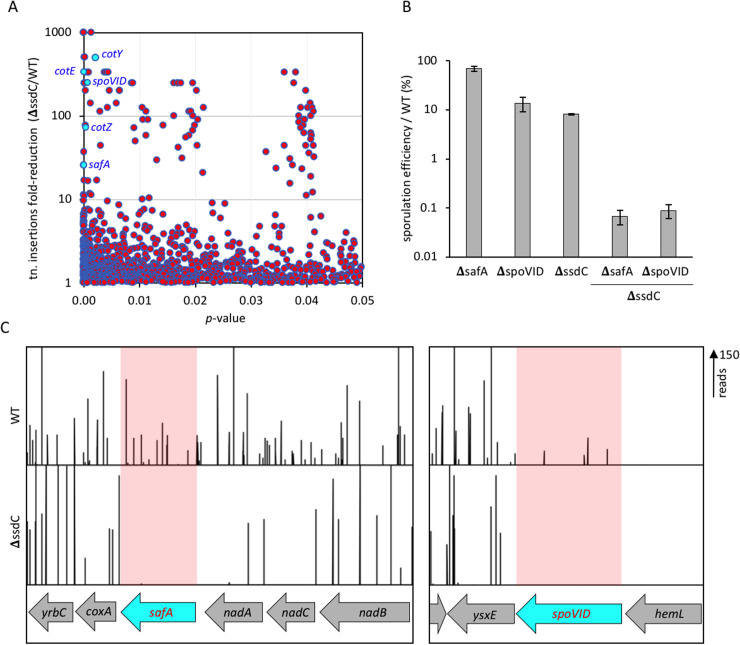
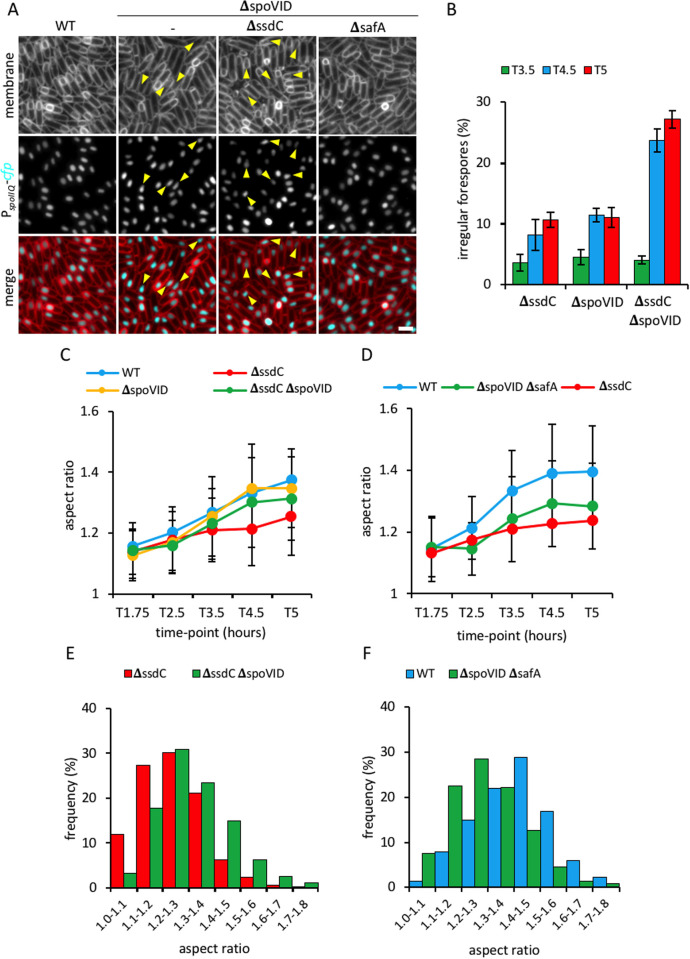
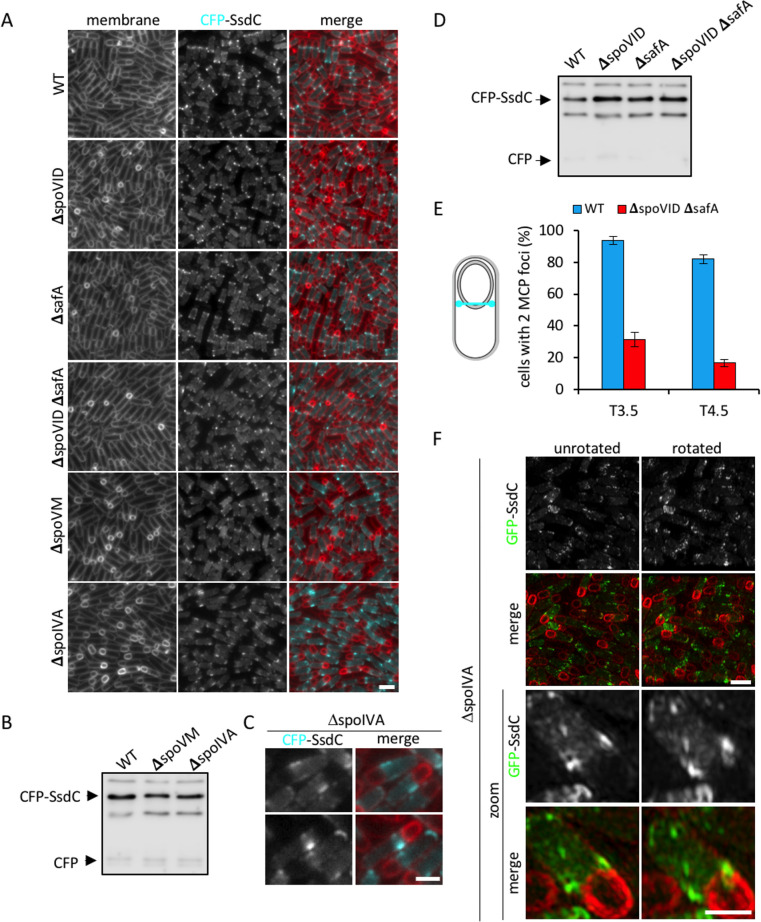
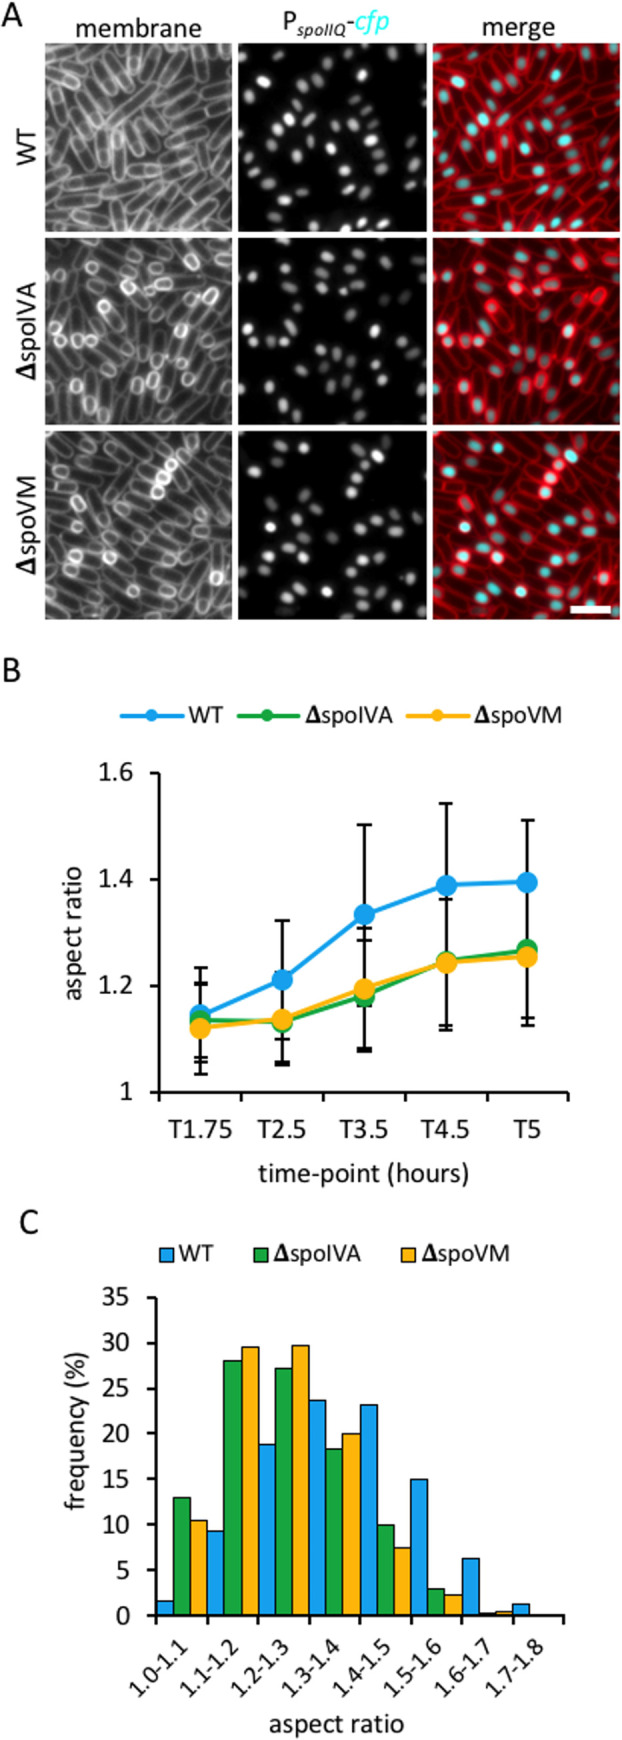
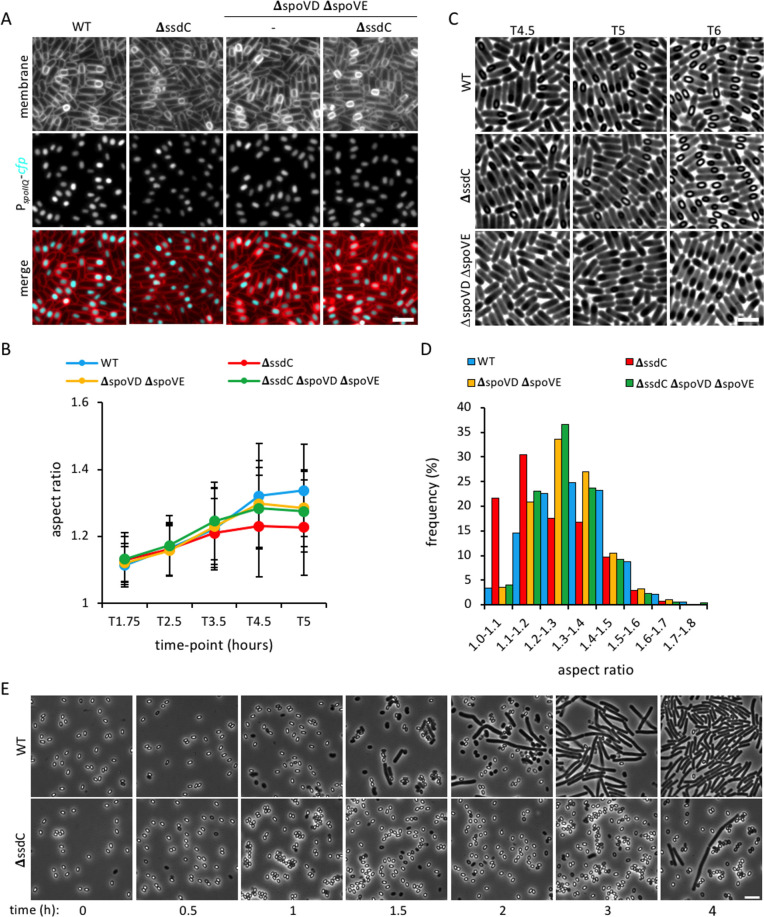
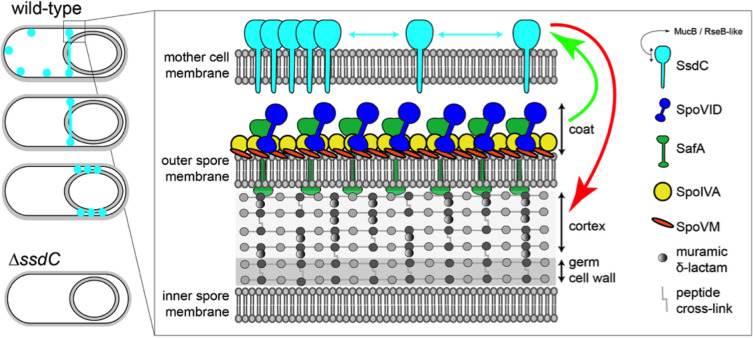
How organisms develop into specific shapes is a central question in biology. The maintenance of bacterial shape is connected to the assembly and remodelling of the cell envelope. In endospore-forming bacteria, the pre-spore compartment (the forespore) undergoes morphological changes that result in a spore of defined shape, with a complex, multi-layered cell envelope. However, the mechanisms that govern spore shape remain poorly understood. Here, using a combination of fluorescence microscopy, quantitative image analysis, molecular genetics and transmission electron microscopy, we show that SsdC (formerly YdcC), a poorly-characterized new member of the MucB / RseB family of proteins that bind lipopolysaccharide in diderm bacteria, influences spore shape in the monoderm Bacillus subtilis. Sporulating cells lacking SsdC fail to adopt the typical oblong shape of wild-type forespores and are instead rounder. 2D and 3D-fluorescence microscopy suggest that SsdC forms a discontinuous, dynamic ring-like structure in the peripheral membrane of the mother cell, near the mother cell proximal pole of the forespore. A synthetic sporulation screen identified genetic relationships between ssdC and genes involved in the assembly of the spore coat. Phenotypic characterization of these mutants revealed that spore shape, and SsdC localization, depend on the coat basement layer proteins SpoVM and SpoIVA, the encasement protein SpoVID and the inner coat protein SafA. Importantly, we found that the ΔssdC mutant produces spores with an abnormal-looking cortex, and abolishing cortex synthesis in the mutant largely suppresses its shape defects. Thus, SsdC appears to play a role in the proper assembly of the spore cortex, through connections to the spore coat. Collectively, our data suggest functional diversification of the MucB / RseB protein domain between diderm and monoderm bacteria and identify SsdC as an important factor in spore shape development.


Conflict of interest statement

The authors have declared that no competing interests exist.

Figures

Fig 1
Fig 1. SsdC has structural similarity to RseB and its mutant produces rounder forespores.
(A) Multiple sequence alignment of the RseB-like domain of B. subtilis SsdC (SsdCBsu) (aa 26–338), B. cereus SsdC (SsdCBce), Pseudomonas aeruginosa MucB (MucB) and Escherichia coli RseB (RseB). Predicted secondary structures are annotated above and below the alignment; coils indicate α-helices, arrows indicate β-sheets. Conserved residues are shown in red and boxed. Highly-conserved residues are shaded in red. The predicted N-terminal tail (aa 1–6) and transmembrane segment (aa 7–25, TM) of B. subtilis SsdC were not included in the alignment. (B) Forespore morphology of wild-type (WT, bBK17) and ΔssdC (bBK18) strains at 3.5 h after onset of sporulation (T3.5). Forespore cytoplasm was visualised using a forespore reporter (PspoIIQ-cfp, false-coloured cyan in merged images). Cell membranes were visualised with TMA-DPH fluorescent membrane dye and are false-coloured red in merged images. White arrowheads point to round forespores and yellow arrowheads to irregularly-shaped forespores. Scale bar = 2 μm. (C) SsdC is surface exposed and thus accessible to trypsin digestion. Immunoblot analysis using anti-His antibodies of protoplasted sporulating cells (bHC70) treated with Trypsin in the presence and absence of TritonX-100. Consistent with the idea that SsdC is membrane-anchored, it remained cell-associated after the generation of protoplasts. As controls, the immunoblot was probed for a membrane protein with an extracellular domain (SpoIIIAG) and a cytoplasmic protein (FtsZ). (D) Average forespore aspect ratio (± STDEVP) of wild-type (WT, bBK17, blue) and ΔssdC (bBK18, red) strains during a sporulation time-course. n > 500 per time-point, per strain. (E) Frequency distribution of forespore aspect ratios of wild-type (WT, bBK17, blue) and ΔssdC (bBK18, red) strains at 5 h (T5) after onset of sporulation (T5). n > 1000 per strain. (F) Schematic representation of forespore shape in wild-type and the ΔssdC mutant.
Fig 2
Fig 2. CFP-SsdC localization and ring-like structure in sporulating cells.
(A) Fluorescence localization of CFP-SsdC (bBK20) during a sporulation time-course. CFP signal is false-coloured cyan in merged images. Cell membranes were visualised with TMA-DPH fluorescent membrane dye and are false-coloured red in merged images. Scale bar = 2 μm. (B) Close-up of CFP-SsdC localization at various timepoints during sporulation. Fluorescence signals are false-coloured as in (A). White arrowheads indicate CFP-SsdC foci along the mother cell membrane. Yellow arrowheads indicate CFP-SsdC foci that are dispersed around the forespore. Scale bar = 1 μm. (C) 3D-Structured Illumination Microscopy (3D-SIM) of GFP-SsdC (bBK21) localization at 3.5 h of sporulation (T3.5). Top panels: unrotated view; bottom panels: rotated 10–20° along z-axis. GFP signal is false-coloured green in merged images. Cell membranes were visualised with FM4-64 fluorescent membrane dye and are false-coloured red in merged images. Scale bar = 2 μm. (D) Immunoblot analysis of cell lysates containing CFP-SsdC (bBK20), collected during a sporulation time-course. CFP-SsdC was immunodetected using anti-GFP antibodies. The positions of CFP-SsdC and CFP are indicated (see also S1E Fig). (E) Fluorescence intensity plots of individual GFP-SsdC rings captured using 3D-SIM. Scale bar = 1 μm.
Fig 3
Fig 3. Tn-seq reveals coat genes that are important for sporulation in the absence of ssdC.
(A) Scatterplot showing fold-reduction of transposon insertions in ΔssdC (bCR1565) relative to wild-type (WT) cells (BDR2413), with corresponding p-values. Spore coat genes with high fold-reduction in ΔssdC compared to WT cells and low p-value are labelled and coloured cyan. (B) Sporulation efficiency of mutant strains ΔsafA (bBK33), ΔspoVID (bBK3), ΔssdC (bBK28), ΔssdC ΔsafA (bBK48) and ΔssdC ΔspoVID (bBK43) as a percentage of wild-type (BDR2413, WT). Error bars represent standard deviation of three biological replicates. (C) Tn-seq profiles at the safA and spoVID genomic loci of wild-type (BDR2413, WT) and ΔssdC (bCR1565) cells, following 24 h of growth and sporulation in exhaustion medium. Height of vertical lines represents number of transposon-sequencing reads at each position. Shaded regions highlight the significant reduction in sequencing reads at safA and spoVID loci.
Fig 4
Fig 4. Forespore shape in ssdC, spoVID and safA mutants.
(A) Forespore morphology of wild-type (WT, bBK17), ΔspoVID (bBK64), ΔssdC ΔspoVID (bBK60), and ΔspoVID ΔsafA (bJL196) strains at 4.5 h after onset of sporulation (T4.5). Forespore cytoplasm was visualised using a forespore reporter (PspoIIQ-cfp, false-coloured cyan in merged images). Cell membranes were visualised with TMA-DPH fluorescent membrane dye and are false-coloured red in merged images. Scale bar = 2 μm. (B) Frequency of irregularly-shaped forespores in ΔssdC (bBK18), ΔspoVID (bBK64) and ΔssdC ΔspoVID (bBK60) strains at T3.5 (green), T4.5 (blue) and T5 (red) of sporulation. Irregular forespores were defined as elongated and distorted in shape, as pointed out by yellow arrowheads. Error bars represent standard deviation of three biological replicates. n > 250 per replicate, per time-point, per strain. (C) Average forespore aspect ratio (± STDEVP) of wild-type (WT, bBK17, blue), ΔssdC (bBK18, red), ΔspoVID (bBK64, yellow) and ΔssdC ΔspoVID (bBK60, green) strains during a sporulation time-course. n > 500 per time-point, per strain. (D) Average forespore aspect ratio (± STDEVP) of wild-type (WT, bBK17, blue), ΔssdC (bBK18, red) and ΔspoVID ΔsafA (bJL196, green) strains during a sporulation time-course. n > 500 per time-point, per strain. (E) Frequency distribution of forespore aspect ratios of ΔssdC (bBK18, red) and ΔssdC ΔspoVID (bBK60, green) strains at 5 h after onset of sporulation (T5). n > 1000 per strain. (F) Frequency distribution of forespore aspect ratios of wild-type (WT, bBK17, blue) and ΔspoVID ΔsafA (bJL196, green) strains at 5 h after onset of sporulation (T5). n > 1400 per strain.
Fig 5
Fig 5. CFP-SsdC localization in coat mutants.
(A) Fluorescence localization of CFP-SsdC in wild-type (bBK20, WT), ΔspoVID (bBK54), ΔsafA (bBK56), ΔspoVID ΔsafA (bJL190), ΔspoVM (bJL33) and ΔspoIVA (bJL34) mutant strains at 3.5 h after onset of sporulation (T3.5). CFP signal is false-coloured cyan in merged images. Cell membranes were visualised with TMA-DPH fluorescent membrane dye and are false-coloured red in merged images. Scale bar = 2 μm. (B) Immunoblot analysis of CFP-SsdC in cell lysates from wild-type (bBK20, WT), ΔspoVM (bJL33) and ΔspoIVA (bJL34) mutant strains collected 3.5 h after onset of sporulation (T3.5). CFP-SsdC was immunodetected using anti-GFP antibodies. The positions of CFP-SsdC and CFP are indicated. (C) Close-up of representative cells in (A), showing mislocalization of CFP-SsdC in ΔspoIVA mutant (bJL34). Fluorescence signals are false-coloured as in (A). Scale bars = 1 μm. (D) Immunoblot analysis of CFP-SsdC in cell lysates from wild-type (bBK20, WT), ΔspoVID (bBK54), ΔsafA (bBK56) and ΔspoVID ΔsafA (bJL190) mutant strains collected 3.5 h after onset of sporulation (T3.5). CFP-SsdC was immunodetected using anti-GFP antibodies (see also S1E Fig). The position of CFP-SsdC and CFP are indicated. (E) Histogram showing proportion of cells (% ± STDEV, 3 biological replicates) with two MCP CFP-SsdC foci in wild-type (bBK20, WT, blue) and ΔspoVID ΔsafA (bJL190, red) cells at T3.5 and T4.5 of sporulation. n > 400 per replicate, per time-point, per strain. (F) 3D-Structured Illumination Microscopy (3D-SIM) of GFP-SsdC localization in ΔspoIVA (bJL40) mutant strains at 3.5 h after onset of sporulation (T3.5). An unrotated view (left panels) and rotated view 10–20° along z-axis (right panels) is shown, as well as zoom (bottom panel). Cell membranes were visualised with FM4-64 fluorescent membrane dye and are false-coloured red in merged images. Scale bars = 1 μm.
Fig 6
Fig 6. Forespore shape in spoVM and spoIVA mutants.
(A) Forespore morphology of wild-type (WT, bBK15), ΔspoIVA (bJL43) and ΔspoVM (bJL39) strains at 4.5 h after onset of sporulation (T4.5). Forespore cytoplasm was visualised using a forespore reporter (PspoIIQ-cfp, false-coloured cyan in merged images). Cell membranes were visualised with TMA-DPH fluorescent membrane dye and are false-coloured red in merged images. Scale bar = 2 μm. (B) Average forespore aspect ratio (±STDEVP) of wild-type (WT, bBK15, blue), ΔspoIVA (bJL43, green) and ΔspoVM (bJL39, yellow) strains during a sporulation time-course. n > 200 per time-point, per strain. (C) Frequency distribution histogram of forespore aspect ratio of wild-type (WT, bBK15, blue), ΔspoIVA (bJL43, green) and ΔspoVM (bJL39, yellow) strains at T5, n>700.
Fig 7
Fig 7. Forespore shape and germination in cortex mutants.
(A) Forespore morphology of wild-type (WT, bBK15), ΔssdC (bBK18), ΔspoVD ΔspoVE (bJL3) and ΔssdC ΔspoVD ΔspoVE (bJL82) strains at 4.5 h after onset of sporulation (T4.5). Forespore cytoplasm was visualised using a forespore reporter (PspoIIQ-cfp, false-coloured cyan in merged images). Cell membranes were visualised with TMA-DPH fluorescent membrane dye and are false-coloured red in merged images. Scale bar = 2 μm. (B) Average forespore aspect ratio (± STDEVP) of wild-type (WT, bBK15, blue), ΔssdC (bBK18, red), ΔspoVD ΔspoVE (bJL3, yellow) and ΔssdC ΔspoVD ΔspoVE (bJL82, green) strains during a sporulation time-course. n > 200 per time-point, per strain. (C) Phase-contrast micrographs of wild-type (WT, bBK15), ΔssdC (bBK18) and ΔspoVD ΔspoVE (bJL3) strains at T4.5, T5 and T6 of sporulation. Forespore cortex is visualised as phase-bright areas within the spore. Phase-dark spores in the ΔspoVD ΔspoVE (bJL3) mutant indicate absence of cortex. Scale bar = 2 μm. (D) Frequency distribution histogram of forespore aspect ratio of wild-type (WT, bBK15), ΔssdC (bBK18), ΔspoVD ΔspoVE (bJL3) and ΔssdC ΔspoVD ΔspoVE (bJL82) strains at 5 h after the onset of sporulation (T5), n >1000. (E) Phase-contrast micrographs of wild-type (bAT87, WT) and ΔssdC (bJL56) spores during a germination and outgrowth time-course in nutrient-rich media (LB). Scale bar = 5 μm.
Fig 8
Fig 8. Model illustrating the relationship of SsdC with the spore coat and cortex.
Schematic representation of SsdC localization and its relationship to the spore cortex and coat. The green arrow represents the localization relationship between SsdC and the coat, and the red arrow represents the shape relationship between SsdC and the cortex. We hypothesize that SsdC influences the assembly of the cortex through the spore coat and may act to coordinate the assembly of these two spore envelope layers. In this model, SafA crosses the spore outer membrane. Although recent data suggests that SafA can interact with cortex peptidoglycan in mature spores and efficient localization of SafA depends on cortex synthesis [56], it remains unclear if SafA actually transverses the membrane to do so, or if the forespore outer membrane becomes permeable, or disappears, as the spores mature.

References

    1. Caccamo PD, Brun YV. The Molecular Basis of Noncanonical Bacterial Morphology. Trends Microbiol. 2018;26(3):191–208. Epub 2017/10/24. 10.1016/j.tim.2017.09.012 - DOI - PMC - PubMed
    1. Young KD. The selective value of bacterial shape. Microbiol Mol Biol Rev. 2006;70(3):660–703. Epub 2006/09/09. 10.1128/MMBR.00001-06 - DOI - PMC - PubMed
    1. Huang KC, Mukhopadhyay R, Wen B, Gitai Z, Wingreen NS. Cell shape and cell-wall organization in Gram-negative bacteria. Proceedings of the National Academy of Sciences. 2008;105(49):19282–7. 10.1073/pnas.0805309105 - DOI - PMC - PubMed
    1. Egan AJ, Cleverley RM, Peters K, Lewis RJ, Vollmer W. Regulation of bacterial cell wall growth. FEBS J. 2017;284(6):851–67. Epub 2016/11/20. 10.1111/febs.13959 . - DOI - PubMed
    1. Egan AJF, Errington J, Vollmer W. Regulation of peptidoglycan synthesis and remodelling. Nat Rev Microbiol. 2020;18(8):446–60. Epub 2020/05/20. 10.1038/s41579-020-0366-3 . - DOI - PubMed

Publication types

LinkOut - more resources