. 2021 Apr;99(4):870-884.
doi: 10.1016/j.kint.2020.10.038. Epub 2020 Dec 13.

Tubular mitochondrial AKT1 is activated during ischemia reperfusion injury and has a critical role in predisposition to chronic kidney disease

Affiliations

Tubular mitochondrial AKT1 is activated during ischemia reperfusion injury and has a critical role in predisposition to chronic kidney disease

Hugo Y-H Lin et al. Kidney Int. 2021 Apr.

Abstract

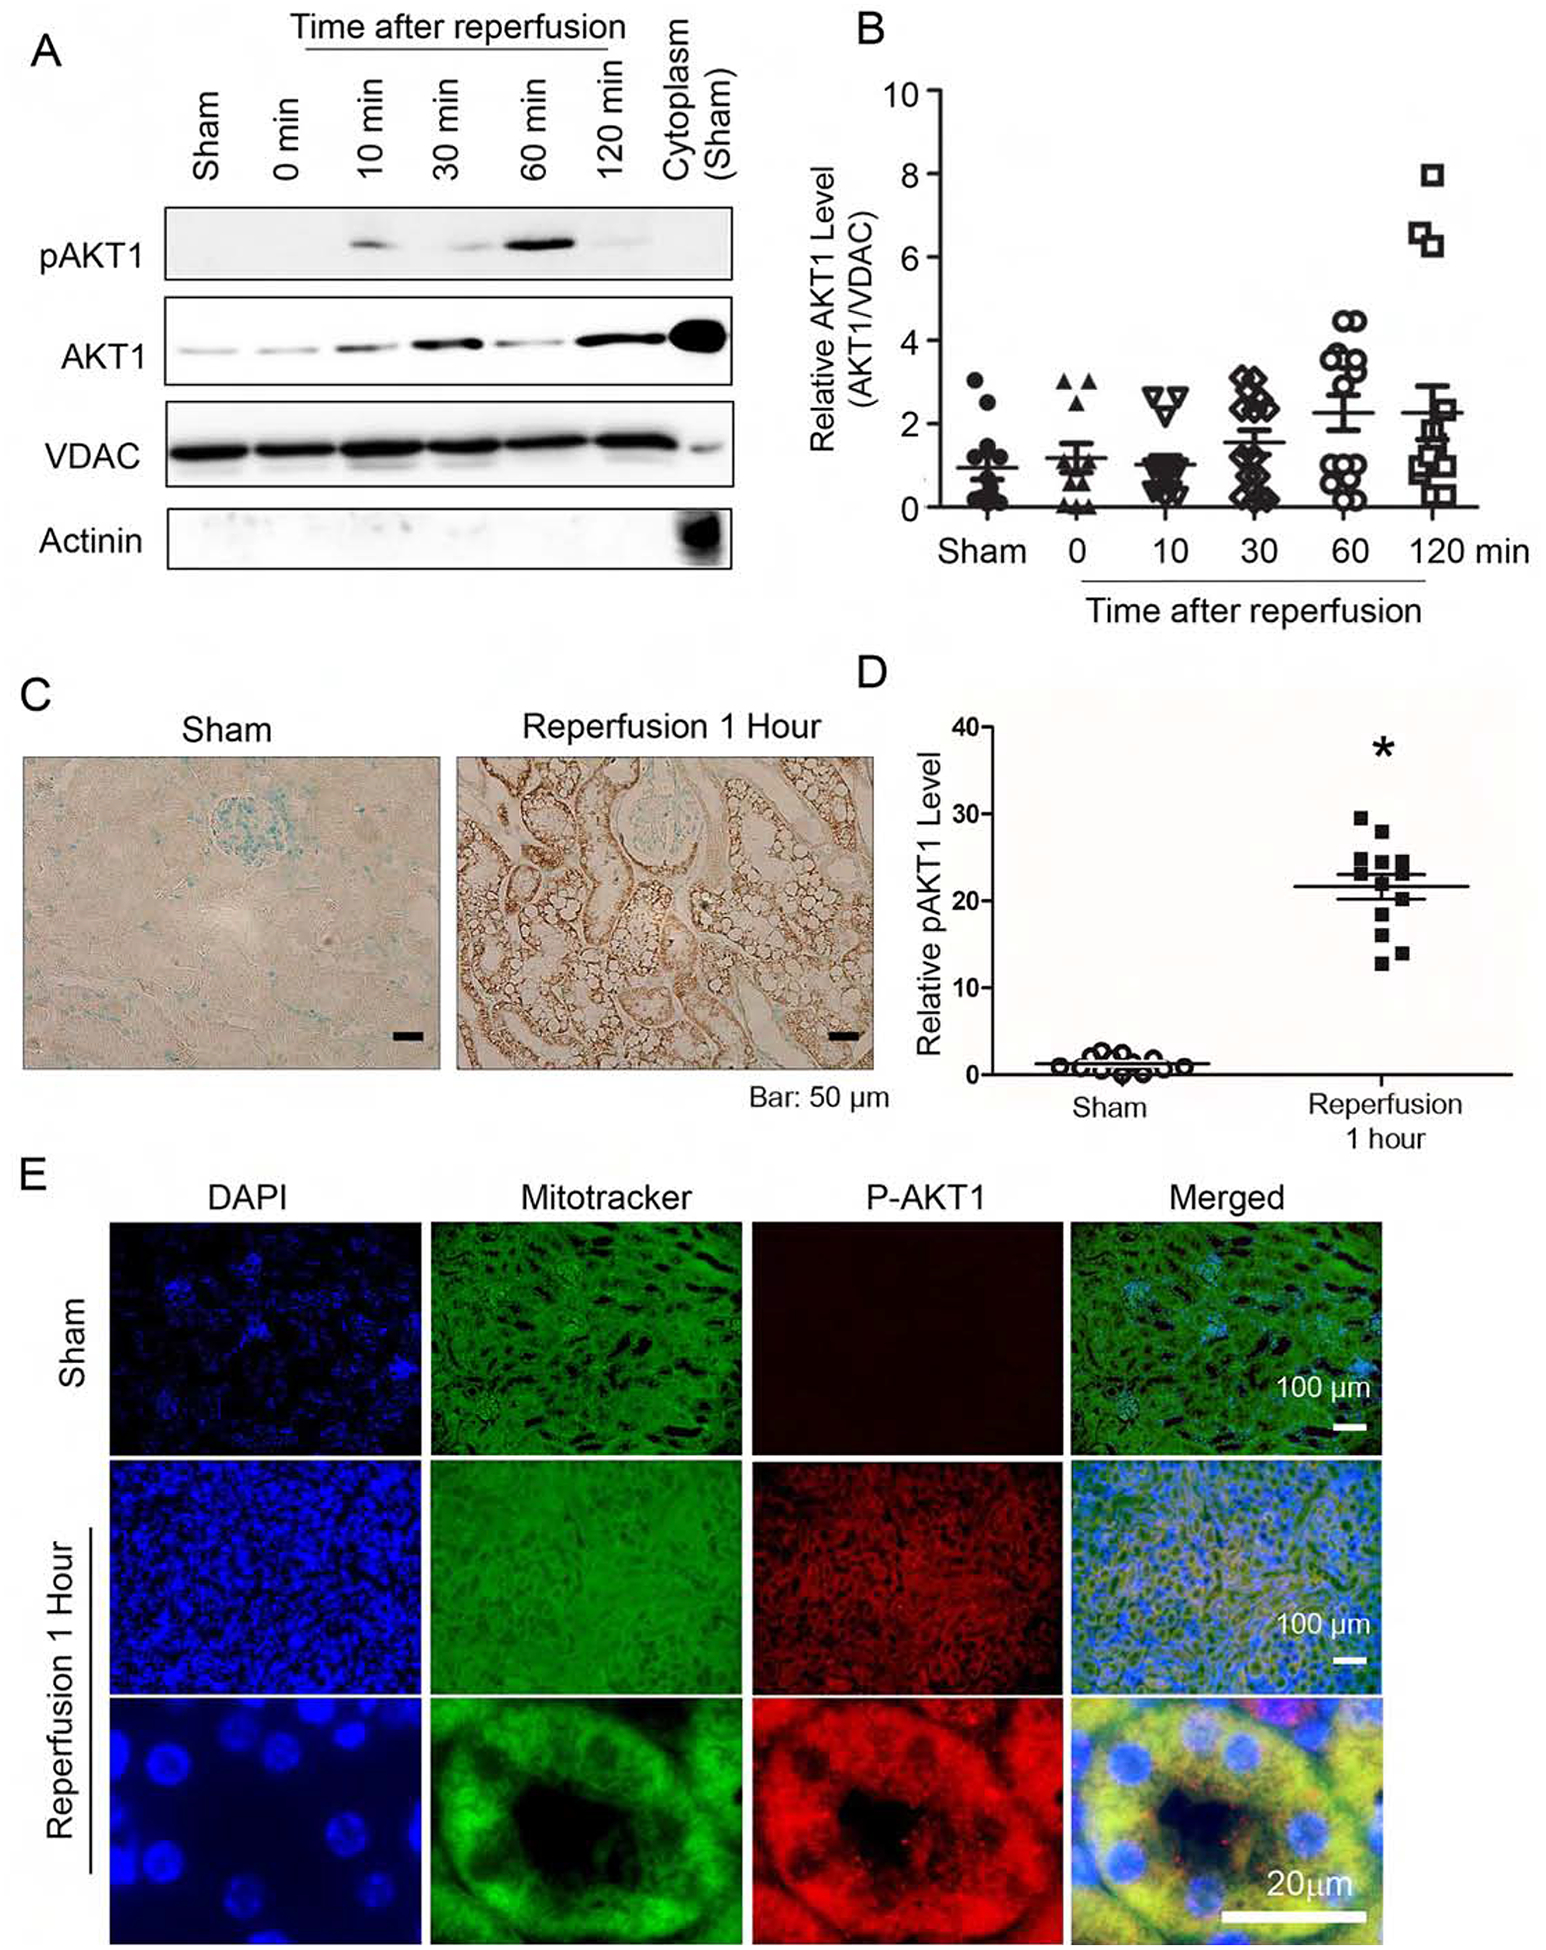
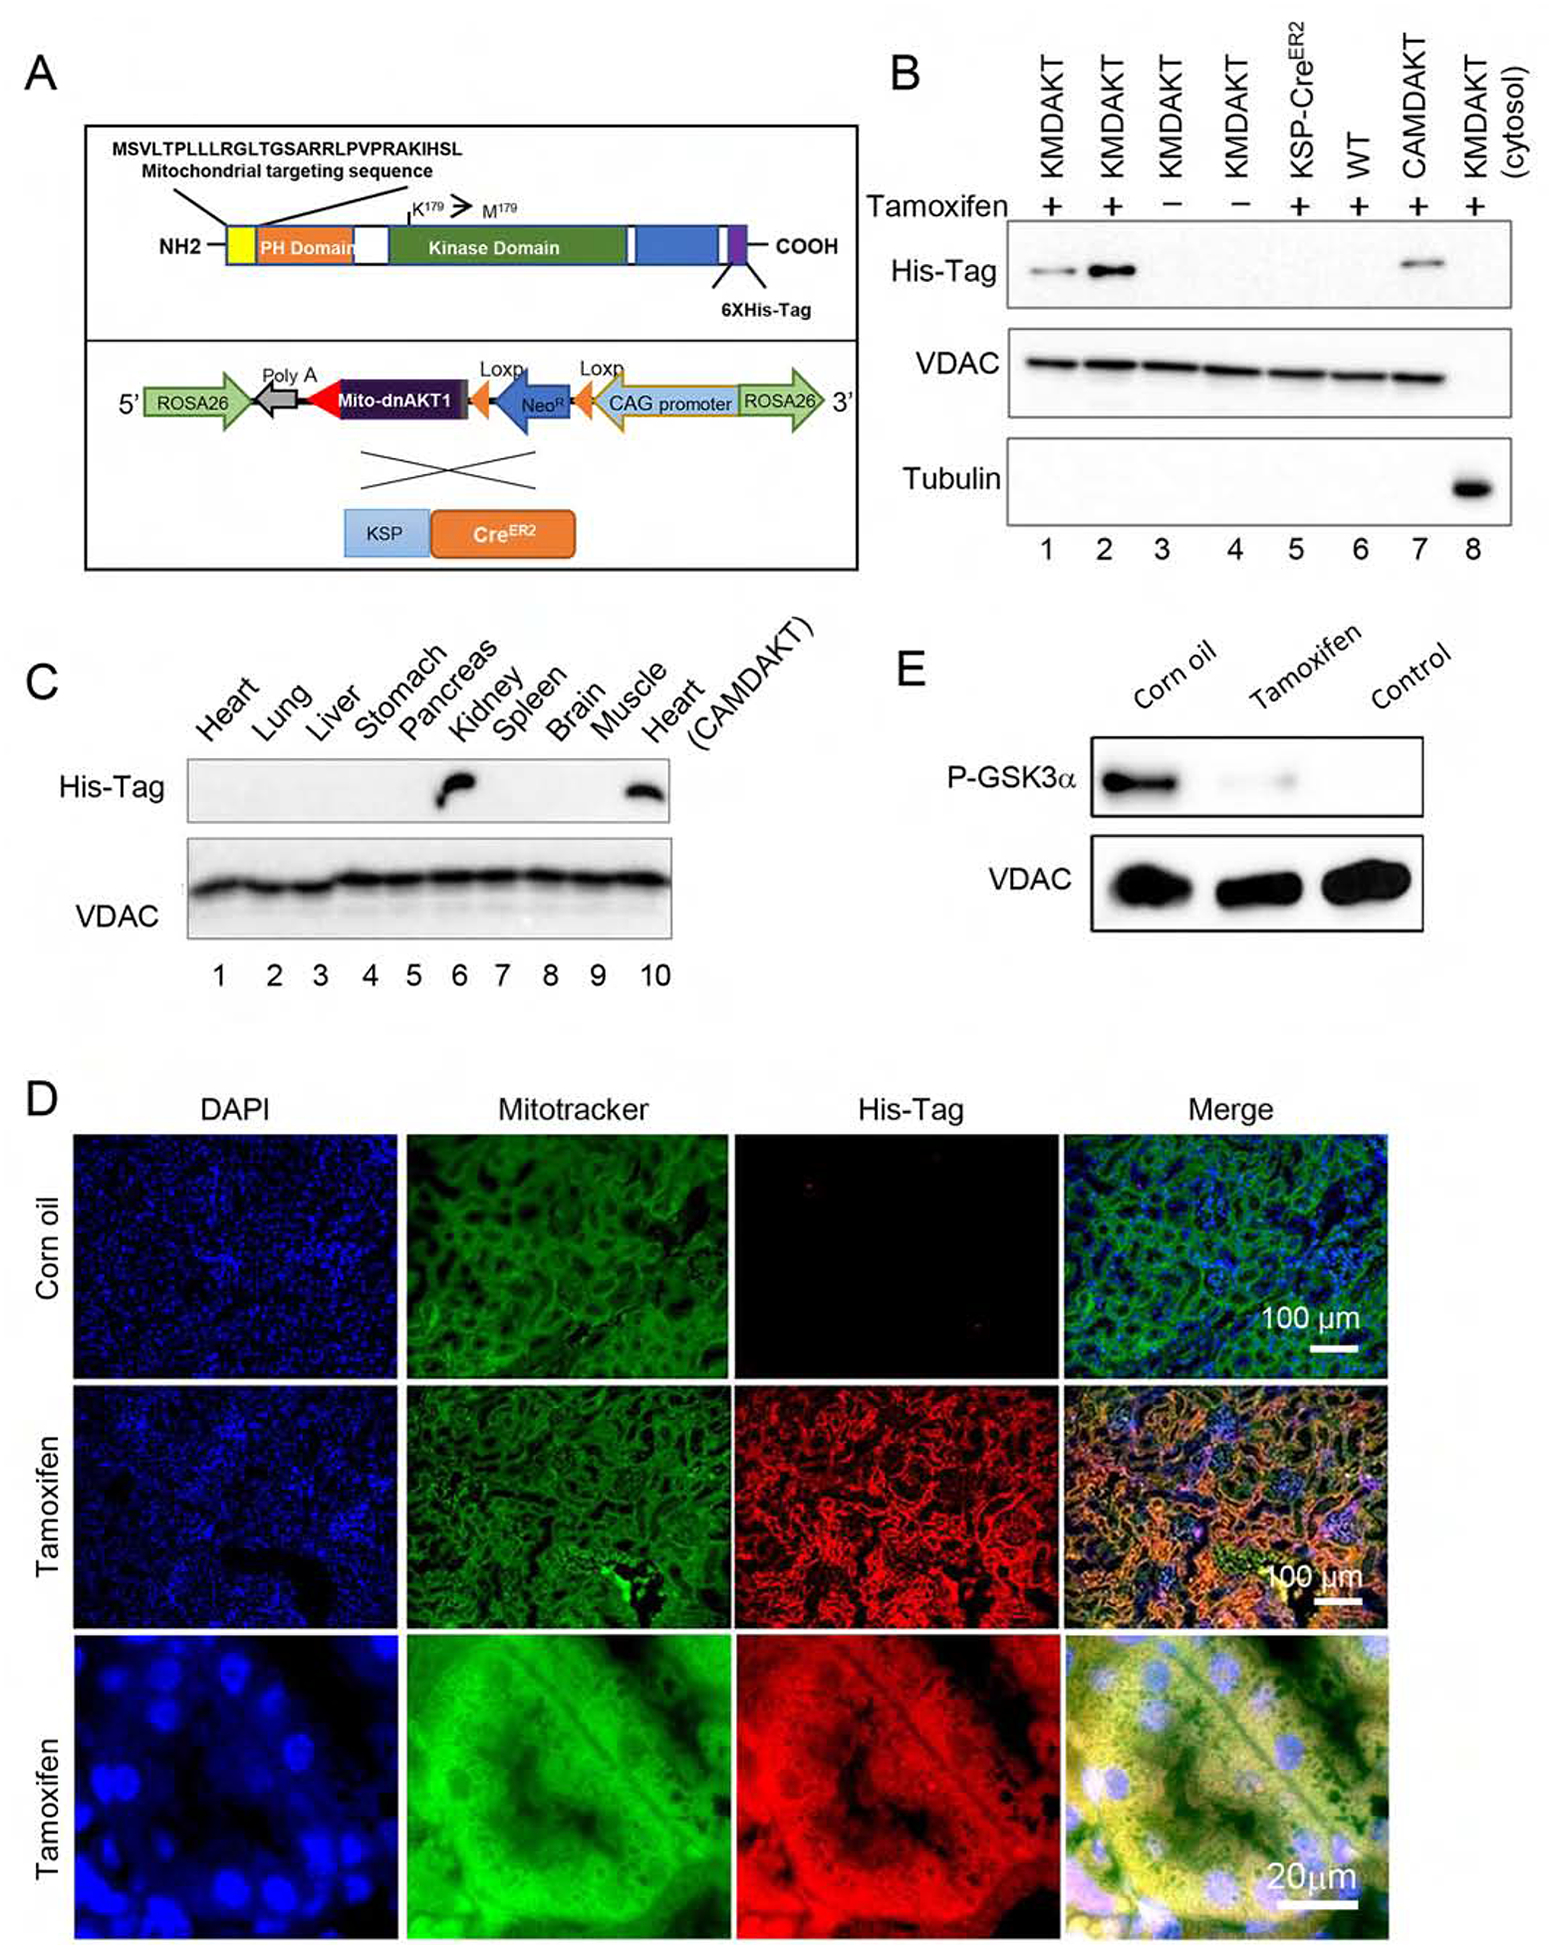
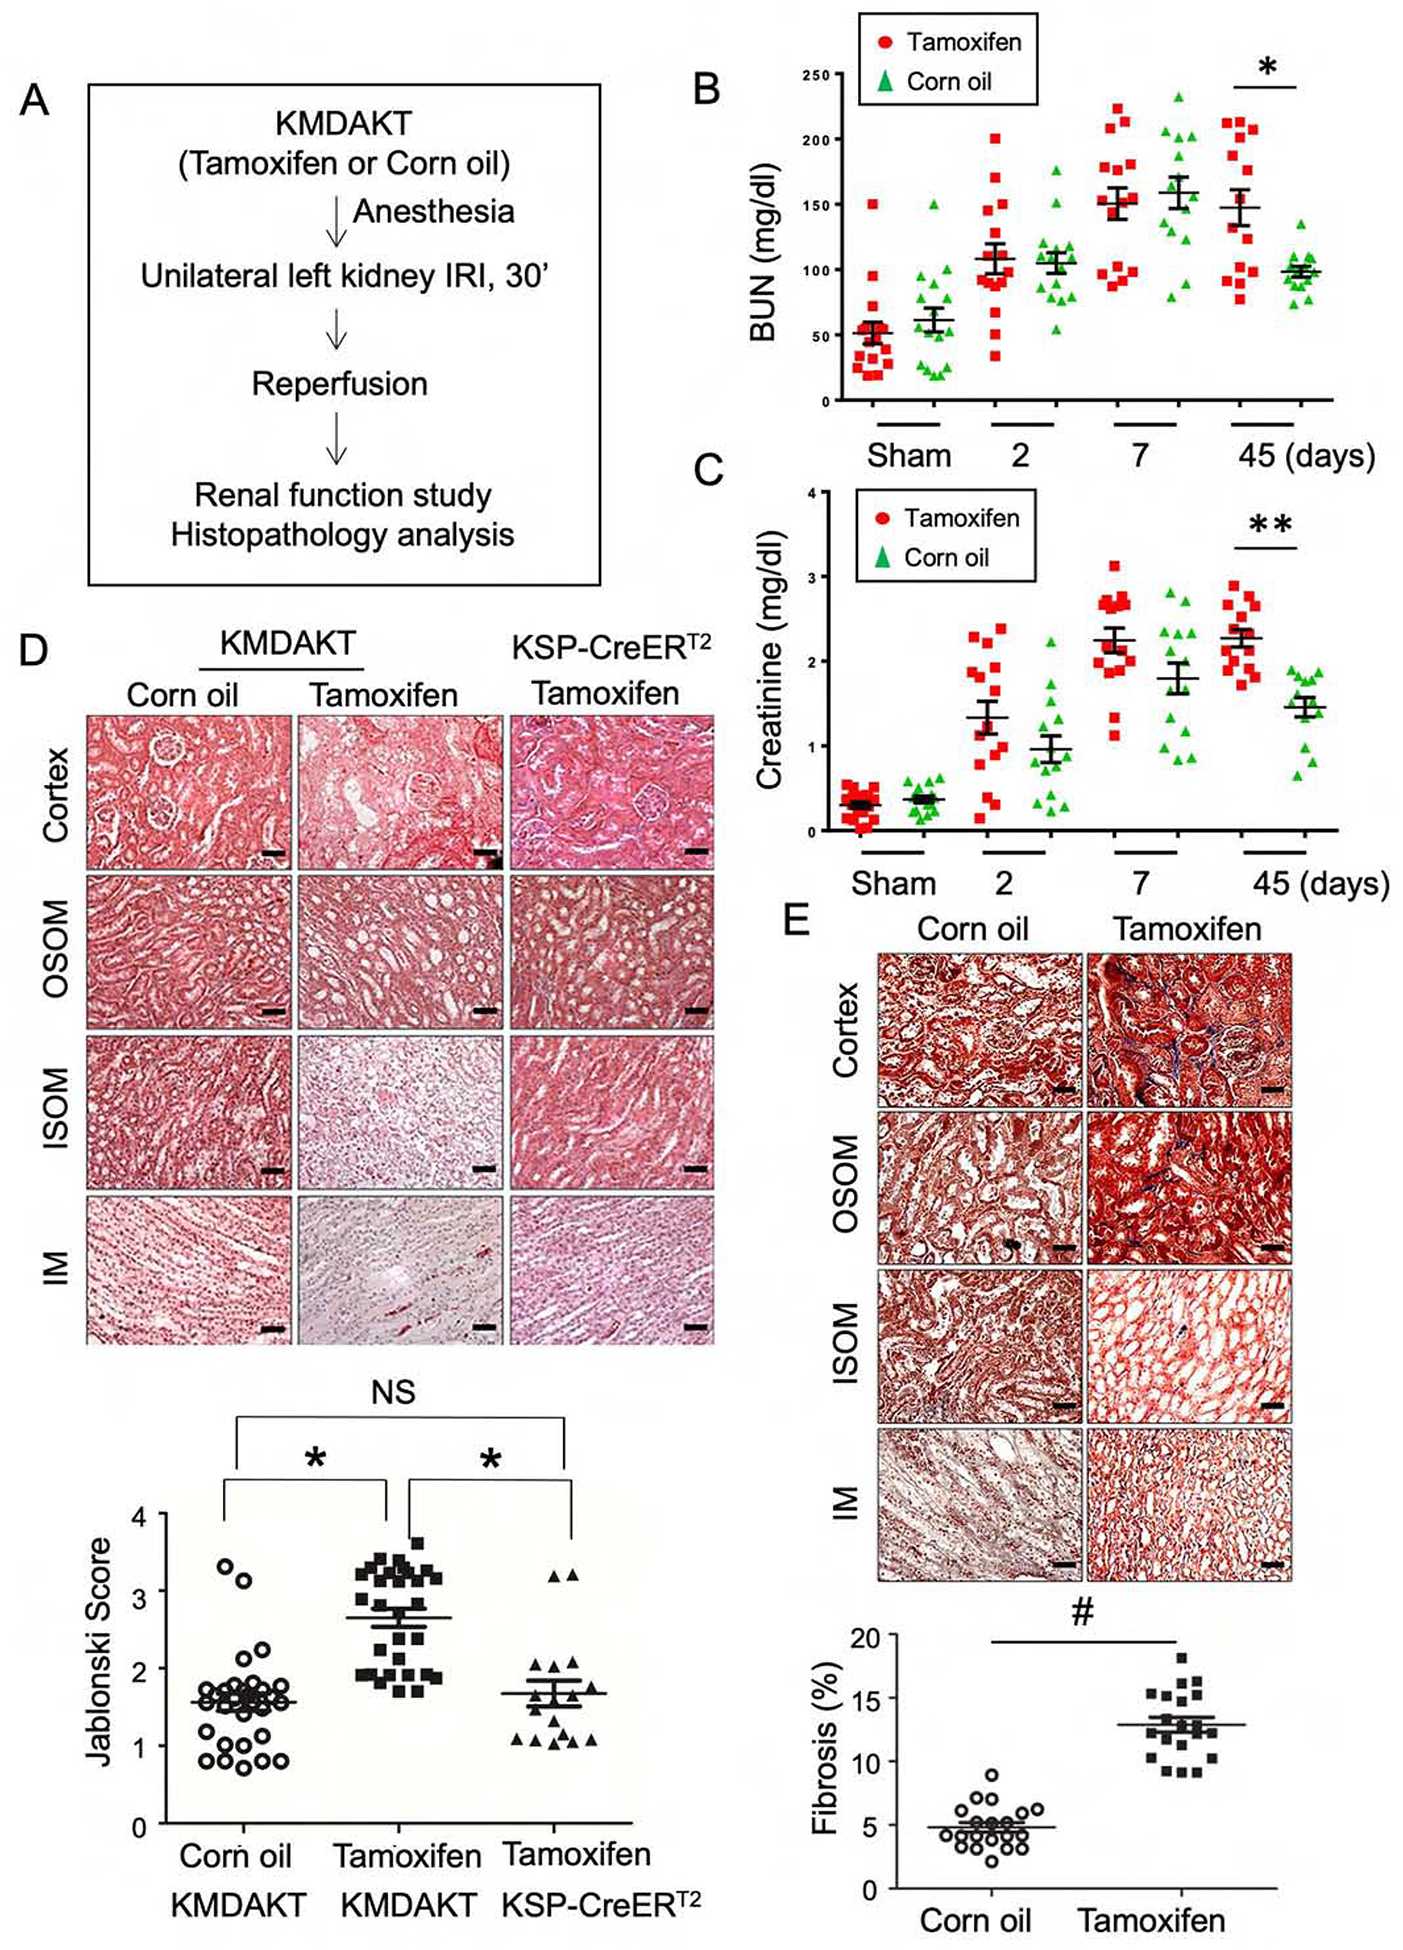
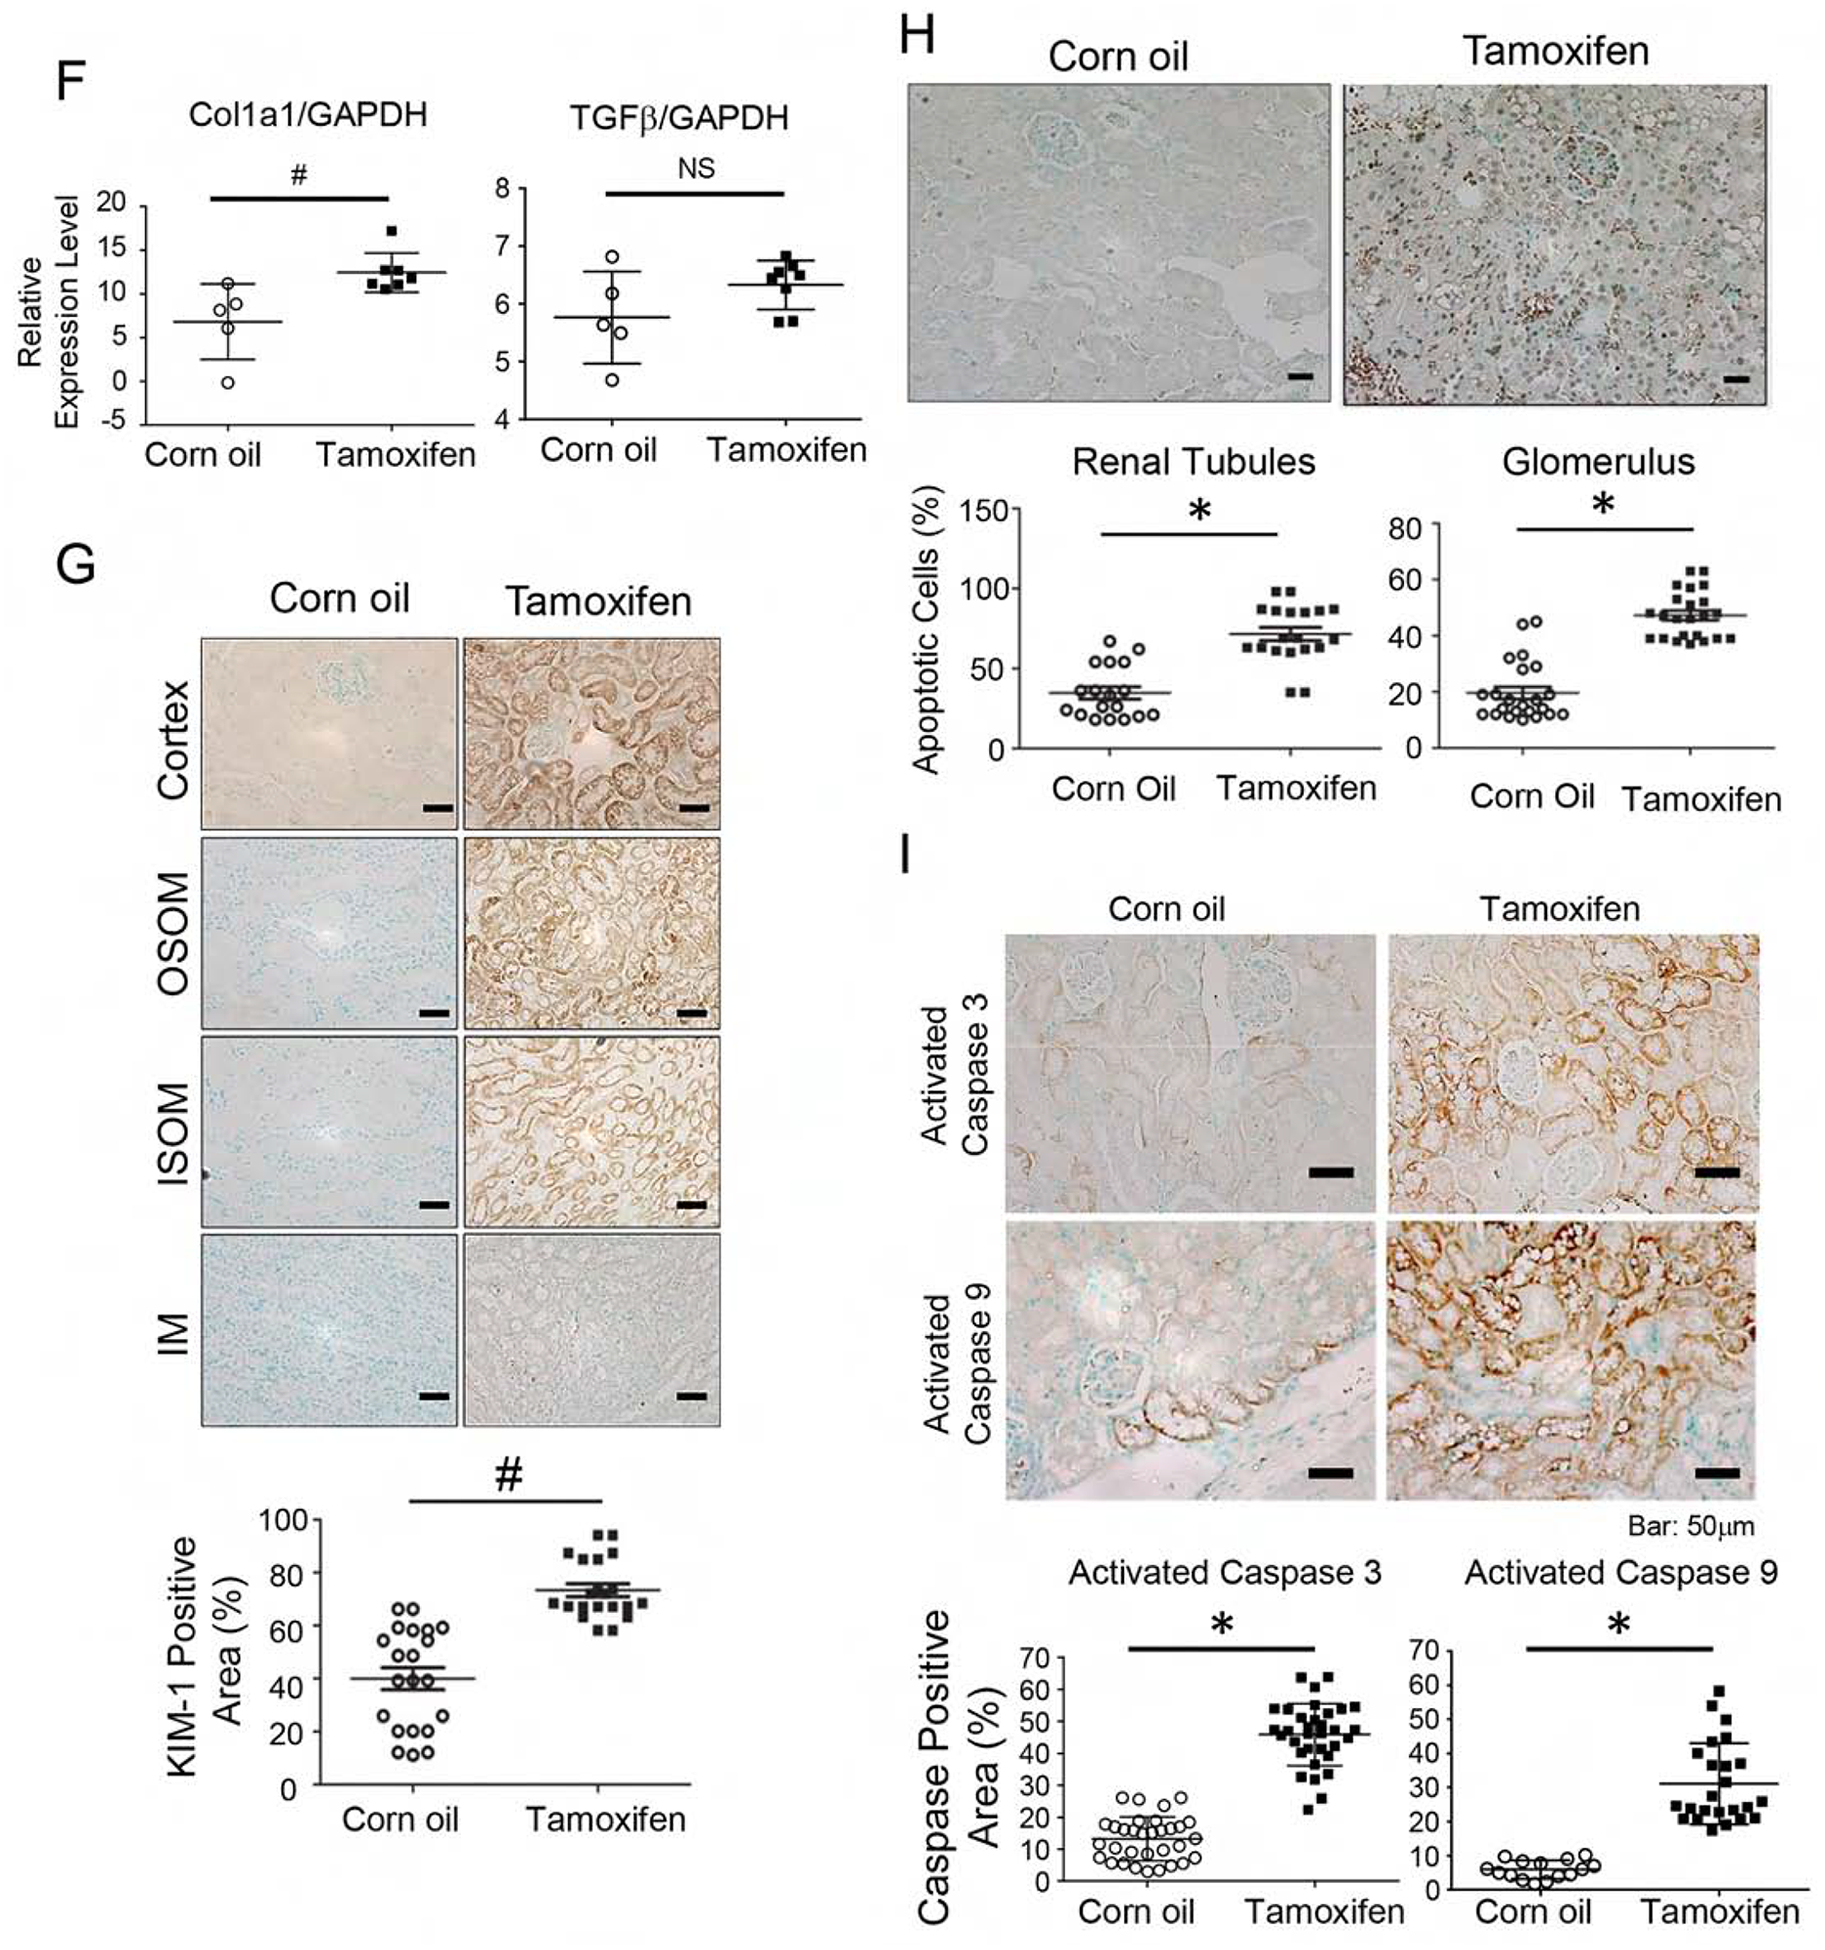
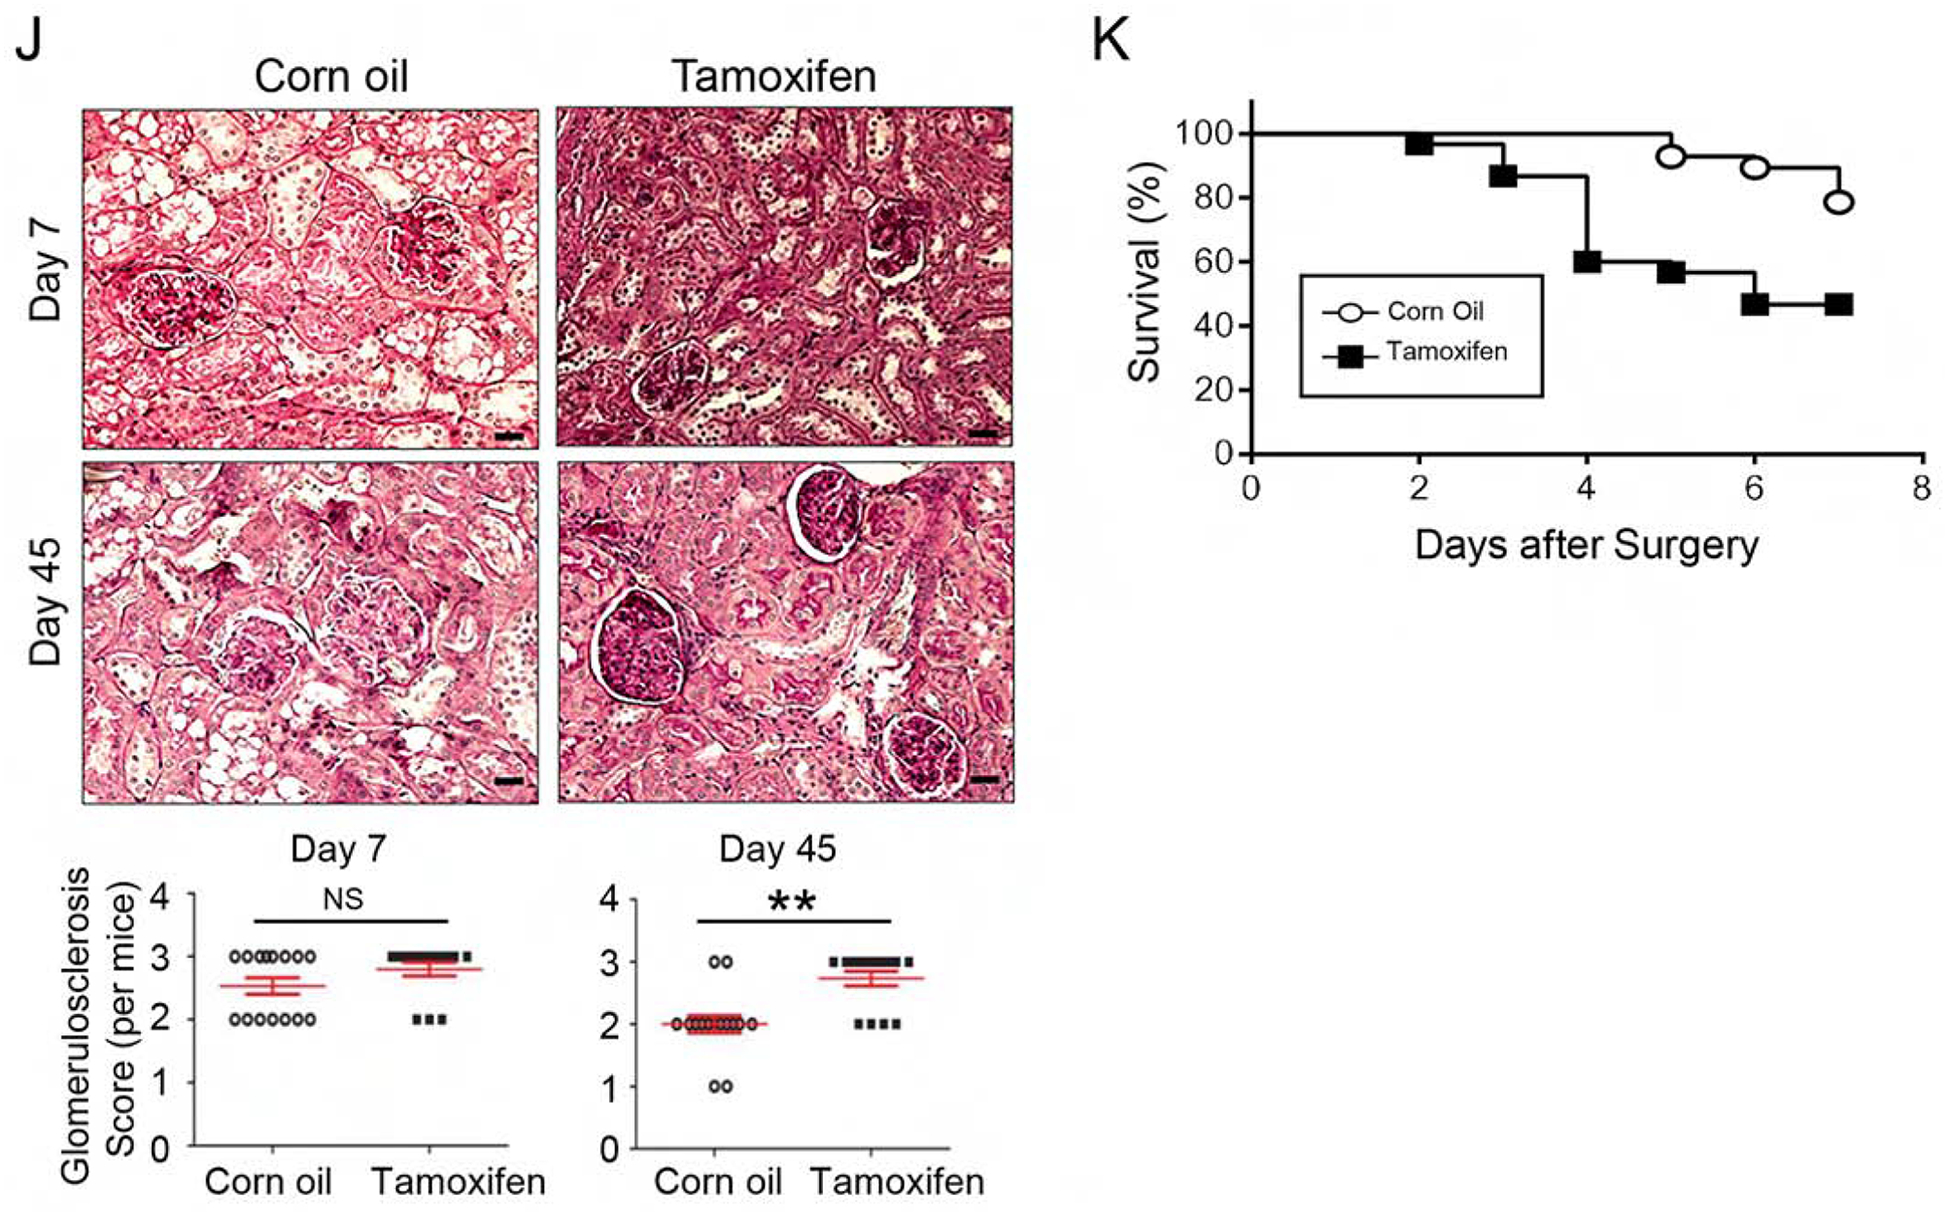
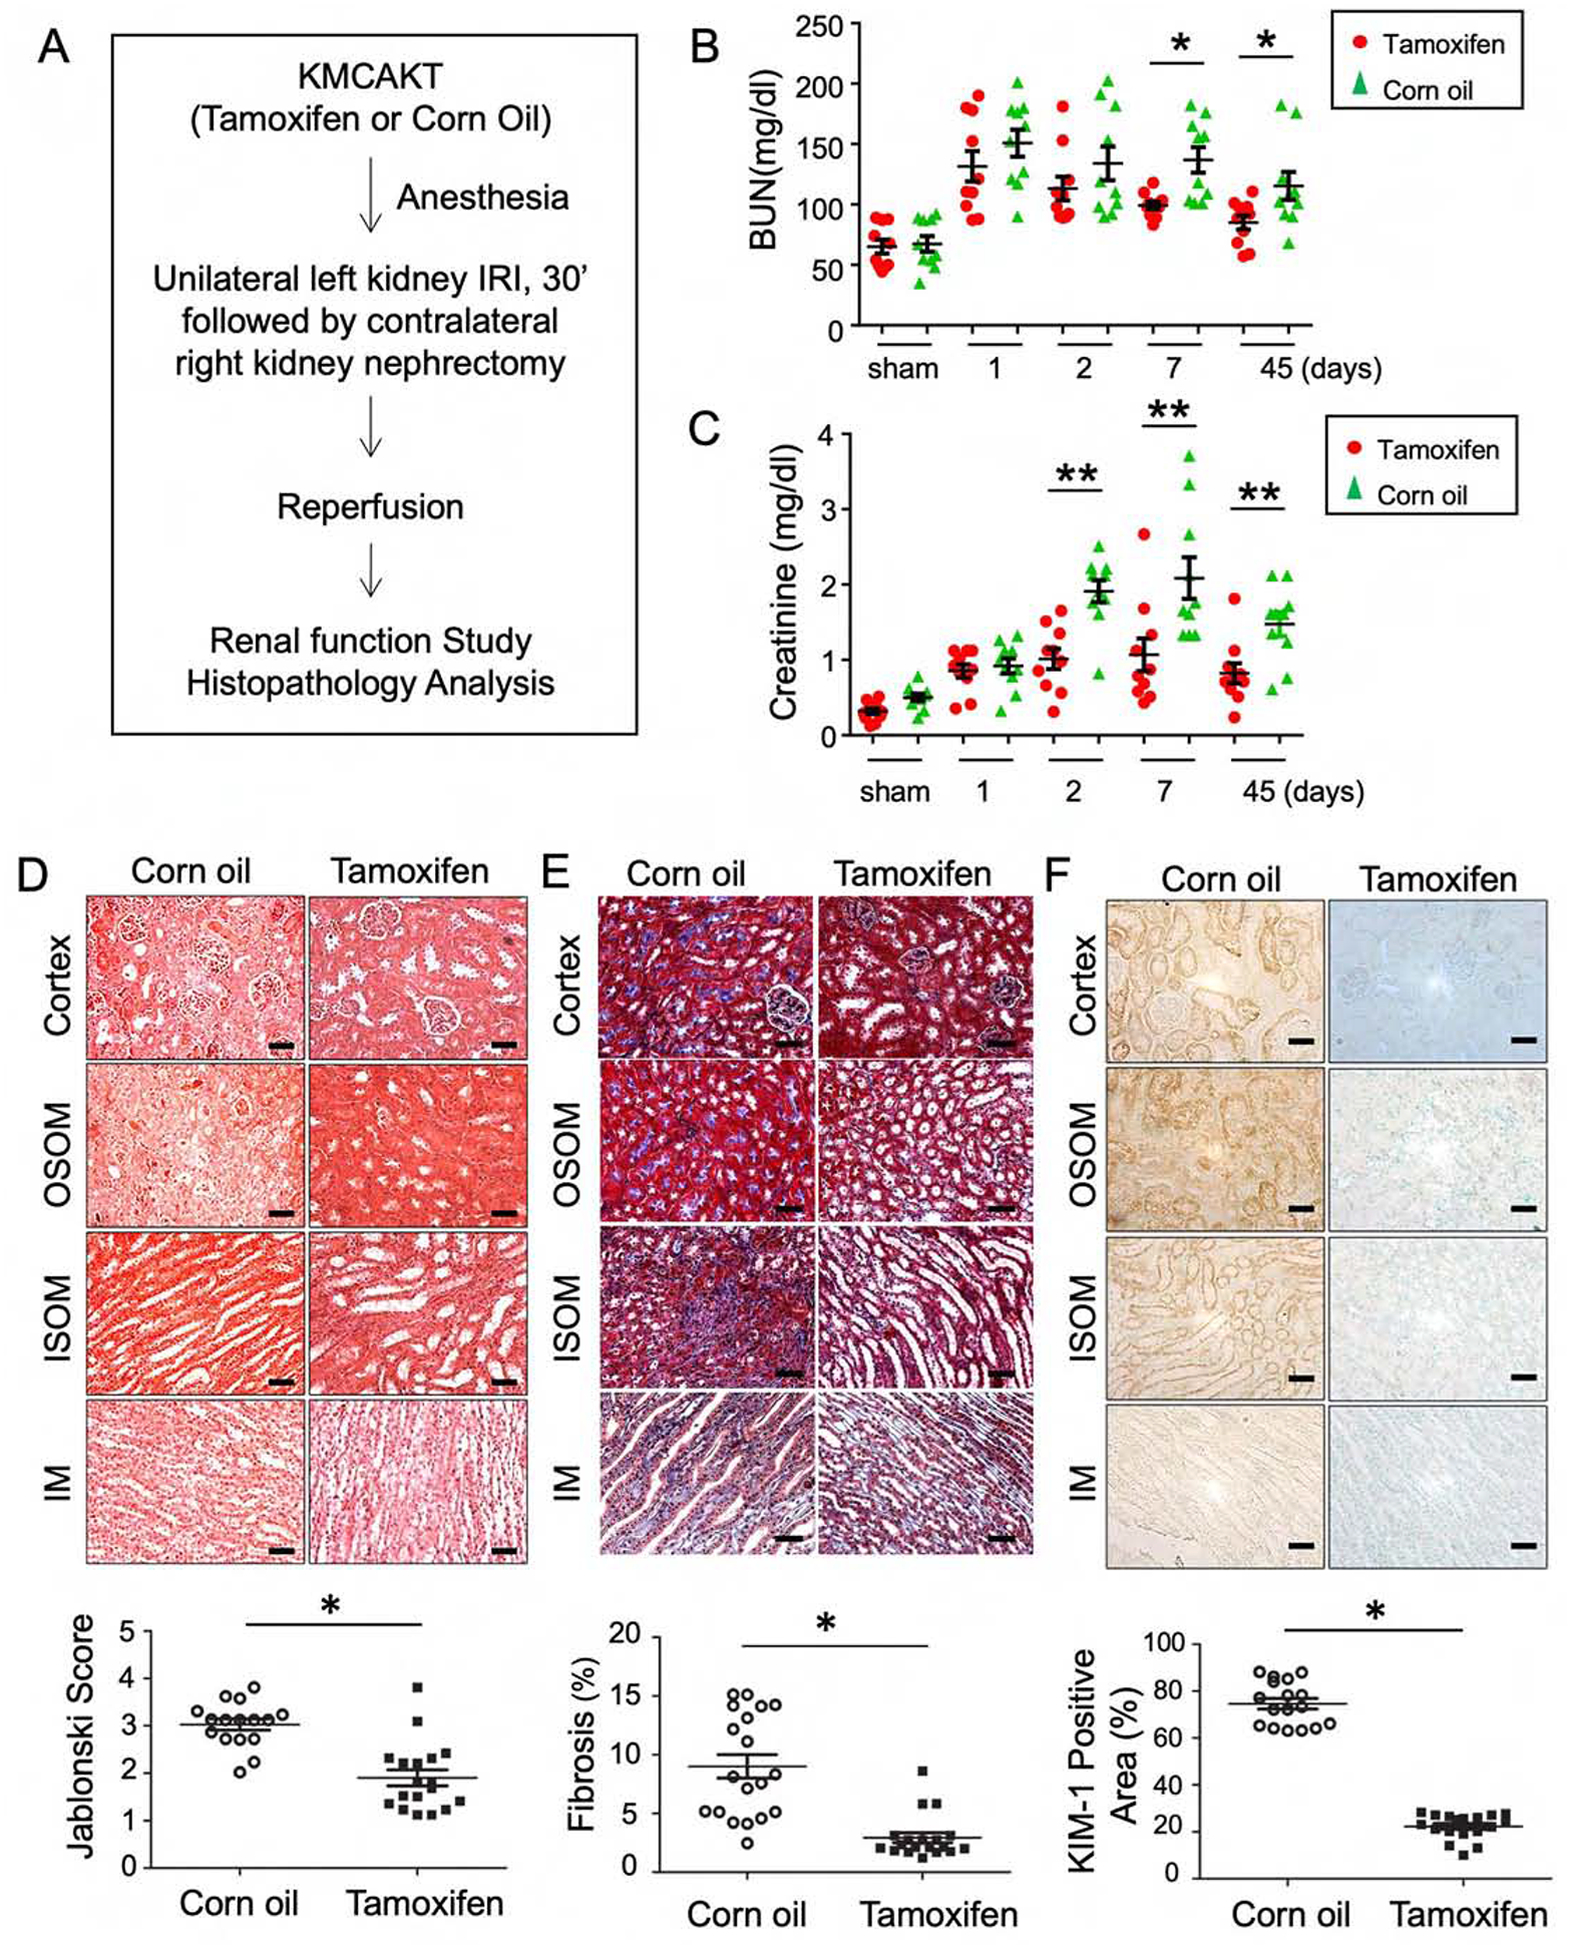
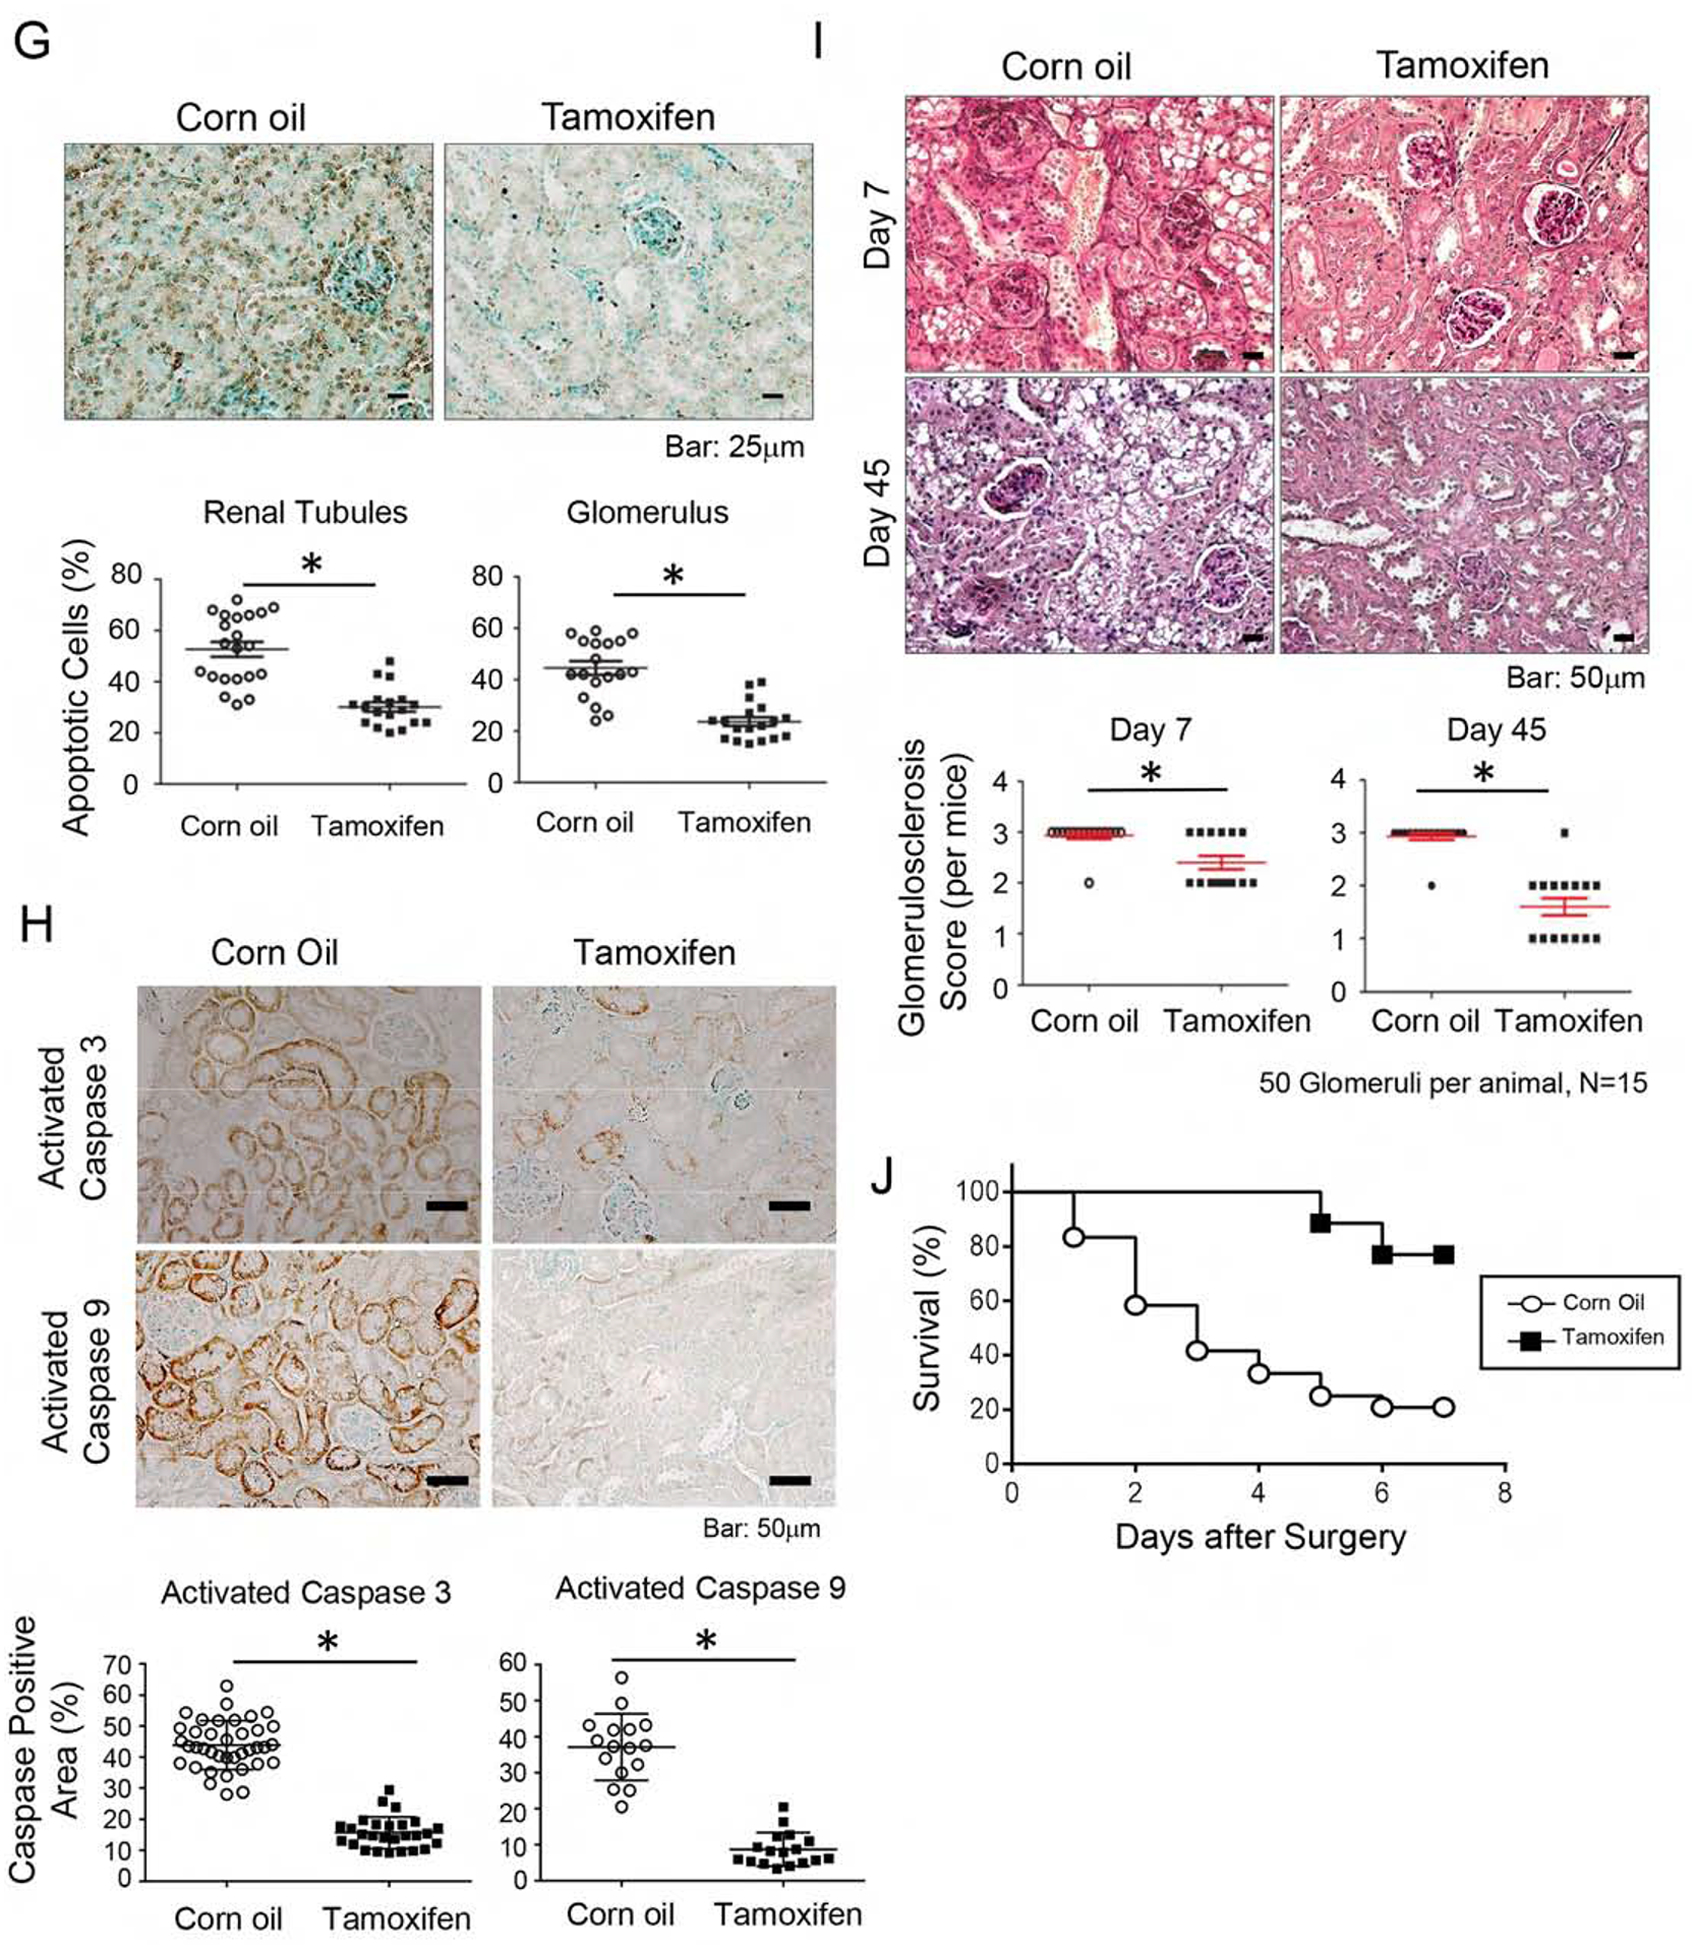
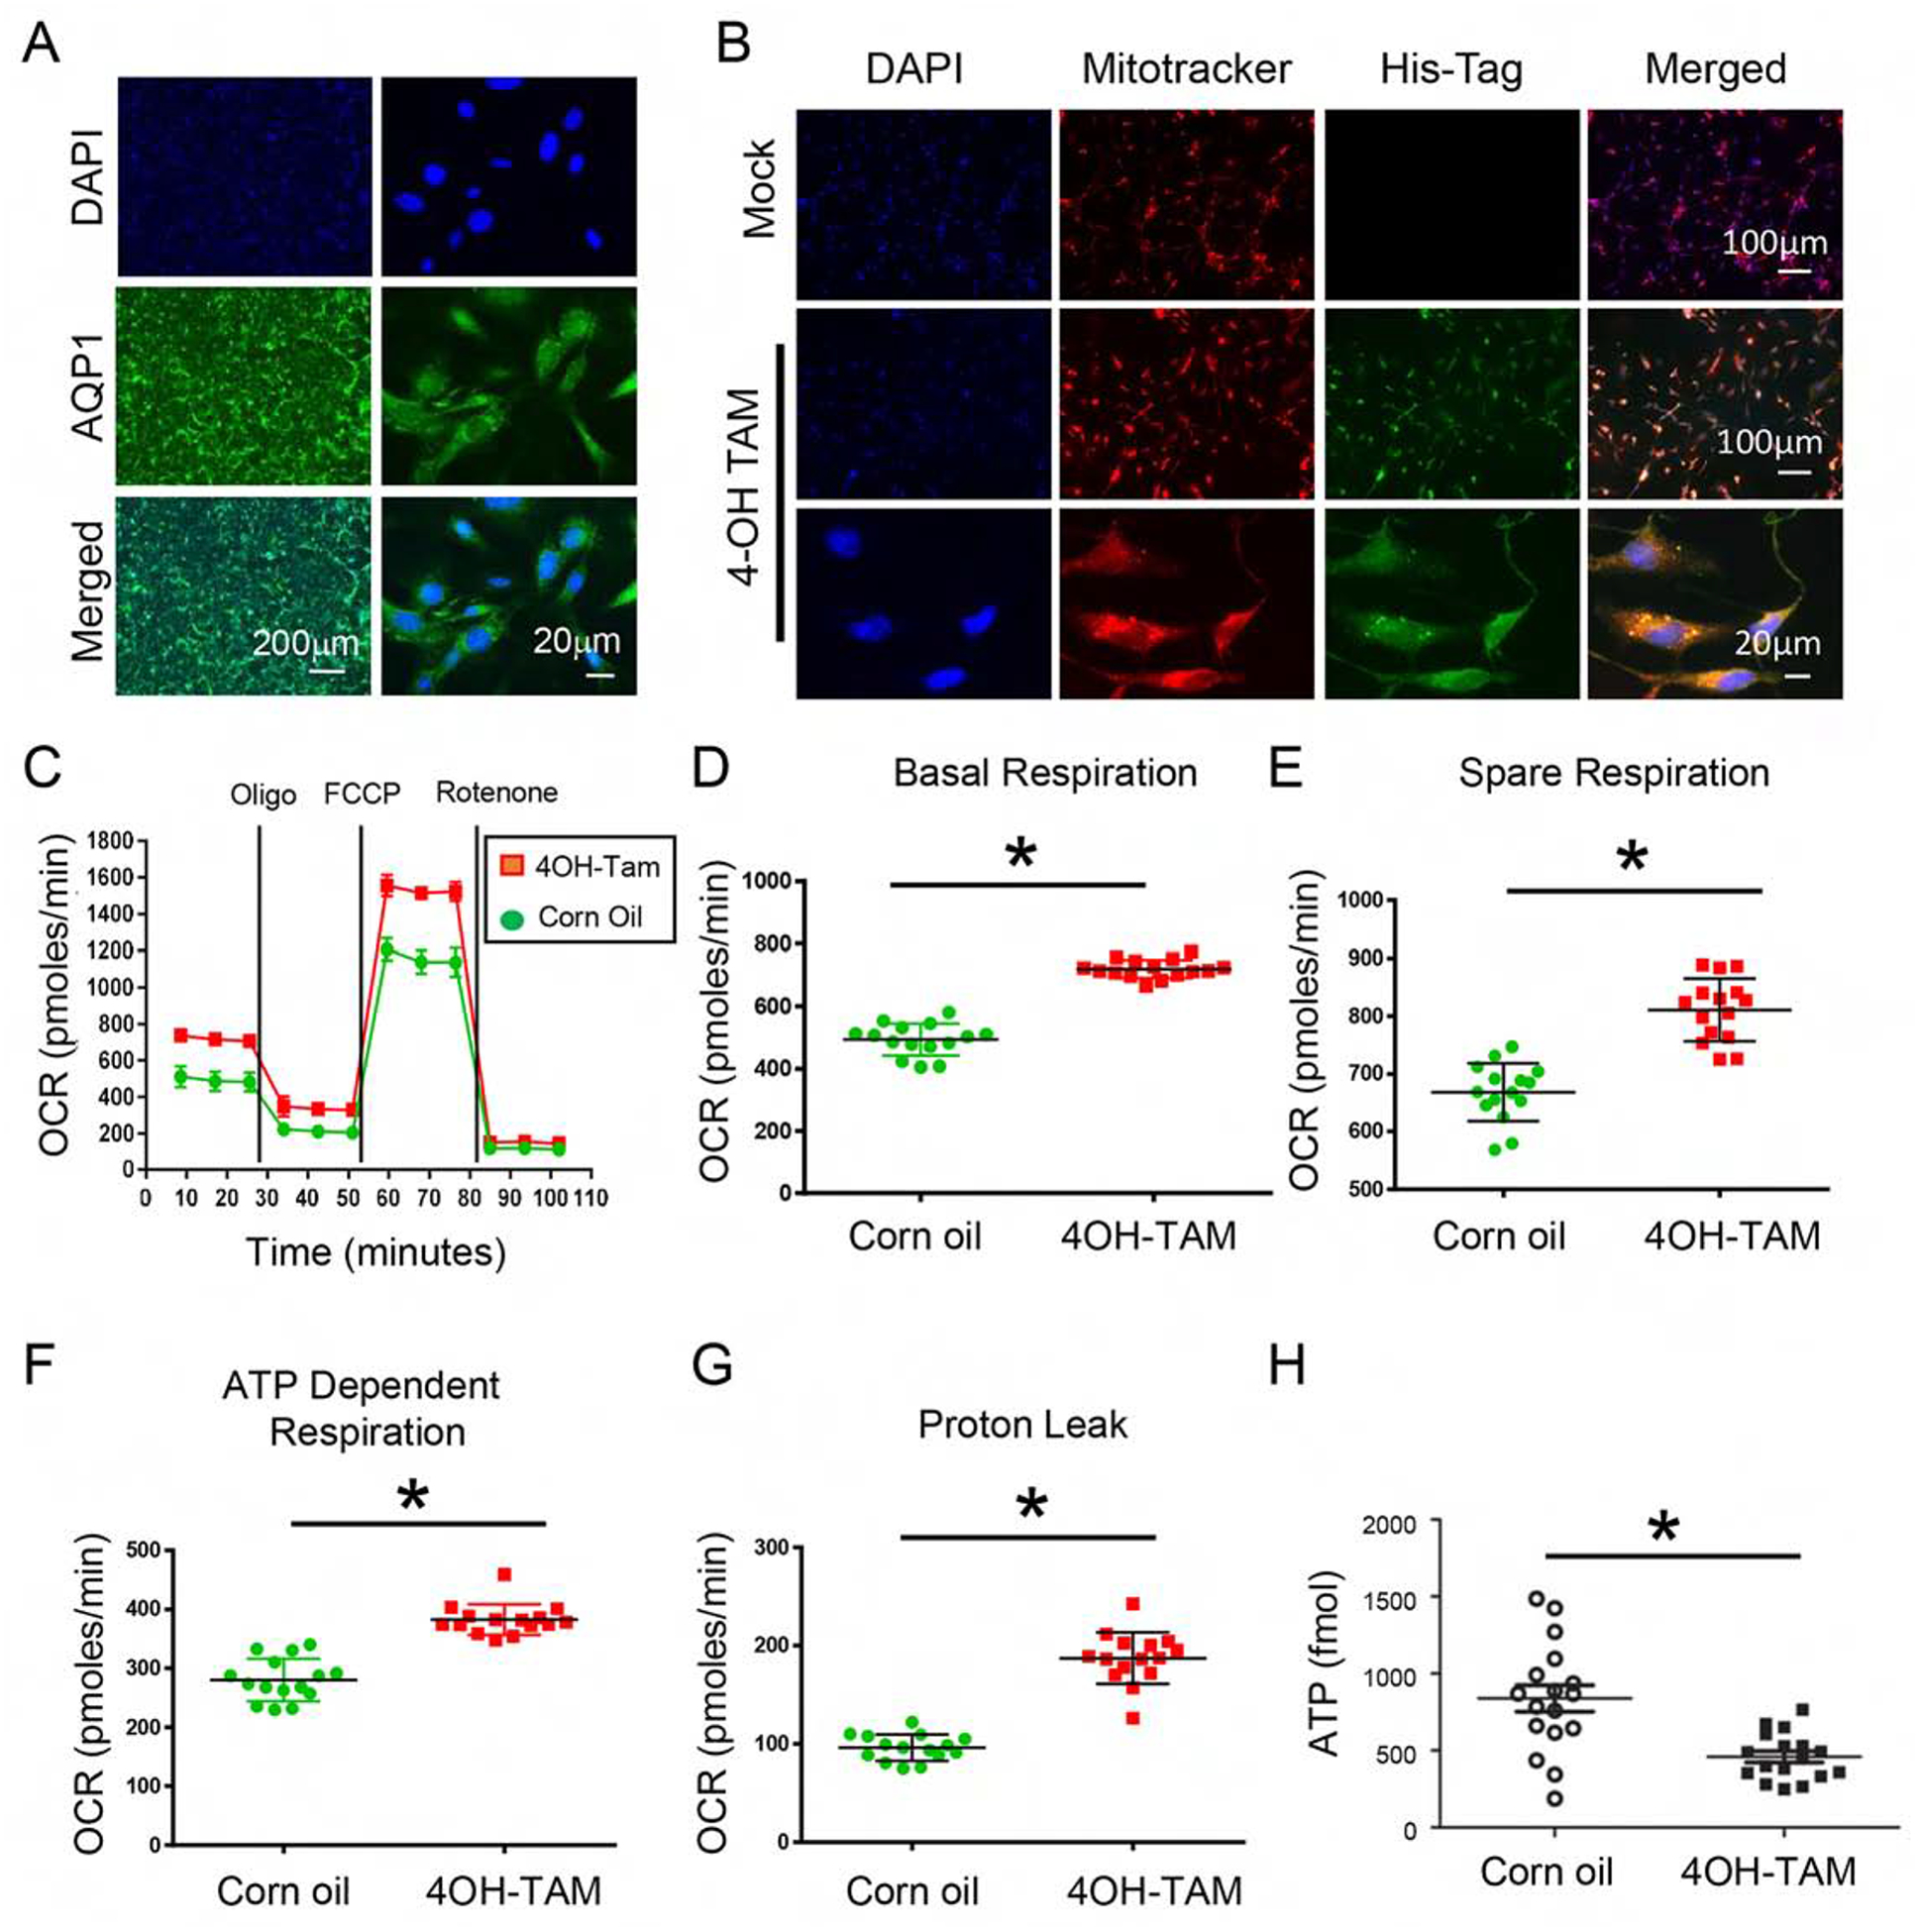
Kidney tubular dysfunction contributes to acute kidney injury and to the transition to chronic kidney disease. Although tubular mitochondria have been implicated in the pathophysiology of kidney failure, the mechanisms are not yet clear. Here, we demonstrated that ischemia-reperfusion injury induced acute translocation and activation of mitochondrial protein kinase B (also known as AKT1) in the kidney tubules. We hypothesized that mitochondrial AKT1 signaling protects against the development of acute kidney injury and subsequent chronic kidney disease. To test this prediction, we generated two novel kidney tubule-specific transgenic mouse strains with inducible expression of mitochondria-targeted dominant negative AKT1 or constitutively active AKT1, using a Cre-Lox strategy. Inhibition of mitochondrial AKT1 in mitochondria-targeted dominant negative AKT1 mice aggravated azotemia, tubular injuries, kidney fibrosis, glomerulosclerosis, and negatively impacted survival after ischemia-reperfusion injury. Conversely, enhancing tubular mitochondrial AKT1 signaling in mitochondria-targeted constitutively active AKT1 mice attenuated kidney injuries, protected kidney function, and significantly improved survival after ischemia-reperfusion injury (76.9% vs. 20.8%, respectively). Uncoupled mitochondrial respiration and increased oxidative stress was found in the kidney tubules when mitochondria AKT1 was inhibited, supporting the role of mitochondrial dysfunction in the pathophysiology of kidney failure. Thus, our studies suggest tubular mitochondrial AKT1 signaling could be a novel target to develop new strategies for better prevention and treatment of kidney injury.

Keywords: acute kidney injury; chronic kidney disease; ischemia refusion injury; mitochondrial AKT1.


Figures

Figure 1.
Figure 1.. Ischemia reperfusion induced acute translocation and activation of AKT1 in renal mitochondria.
After ischemia, kidneys were harvested at various time points during reperfusion. (A) Increase in AKT1 and pAKT1 in mitochondria following reperfusion. Mitochondrial fractions were isolated and protein lysates were analyzed by western blotting with antibodies for total pAKT1, AKT1, mitochondria marker VDAC and cytosol marker actinin. (B) Mitochondrial AKT1 is increased following reperfusion graph (Kruskall-Wallis test, p<0.05). (C) Renal sections from the sham control or 1 hour after IRI was used to visualize AKT1 phosphorylation in tubules with immunohistochemistry staining. (D) Increased pAKT positive areas (%) 1 hour after IRI (p<0.001, n=13 in each group). (E) Co-localization of pAKT1 with renal tubule mitochondria 60 min post-ischemia. Renal sections were stained with pAKT1 (S473) antibodies and Mitotracker Green.
Figure 2.
Figure 2.. Bigenic mice (KMDAKT) for renal tubule-specific mitochondria-targeting of a dominant negative AKT1.
(A) Mitochondrial-targeting dominant negative AKT1 (mdnAKT) was engineered as described in Materials and Methods. A 6X His tag was added to the C terminus of AKT1 cDNA. mdnAKT transgenic mice were crossed with KSP-CreERT2 mice (Cre recombinase in renal tubular epithelial cells) to generate bi-genic mice (KMDAKT) for this series of experiments. (B) Expression of mdnAKT. Eight-week-old KMDAKT mice were injected with tamoxifen (TAM) or corn oil. The mitochondrial fraction was isolated and expression of mdnAKT proteins was analyzed by western blotting. The mdnAKT protein was expressed in the renal mitochondria isolated from Tam-treated KMDAKT mice but not in corn oil-treated KMDAKT mice, TAM-treated KSP-CreERT2 mice or TAM-treated wildtype (WT) mice. No mdnAKT was present in the renal cytosol fraction (last lane). VDAC was used as loading control and mitochondria marker, while tubulin is a cytosolic marker. (C) After TAM injection, the mitochondrial fraction was isolated from different organs and mutant AKT was only expressed in the kidney. The mdnAKT in the cardiac mitochondria of TAM-injected heart-specific mdnAKT mice (CAMDAKT) served as a positive control. (D) Mutant AKT1 co-localized to mitochondria in the renal tubules, immunofluorescence with anti-His-Tag antibody and MitoTracker® Green FM. (E) AKT activity in the mitochondrial protein preps were analyzed by an in vitro kinase assay using recombinant GSK3α as substrate. Tubular mitochondrial AKT was activated by IRI (corn oil injected), but AKT activity was inhibited in the Tam-treated KMDAKT mitochondria after IRI. The supernatant of KMDAKT mitochondria proteins after clearing immunoprecipitation with AKT antibodies served as negative control (lane 3).
Figure 3.
Figure 3.. Inhibition of tubule mitochondria AKT aggravated kidney failure induced by ischemia reperfusion.
(A) The experimental protocol of ischemia reperfusion injury for this series of study. (B, C) Serial measurements showed rise of BUN and Creatinine (Cr) after IRI. Significantly higher BUN and Cr was observed in the male Tam-treated KMDAKT mice on day 45 (*p<0.002, **p<0.001). (D) Renal tissue histology (7 days after IRI) stained with HE to estimate Jablonski scores. OSOM - outer stripe outer medulla. ISOM - inner stripe outer medulla. IM - inner medulla. Tamoxifen injected KSP-CreERT2 mice served as another control for Tamoxifen-KMDAKT mice. The Jablonski scores were summarized in the bar graph. *p < 0.01. (E) Renal fibrosis was analyzed by Masson’s trichrome staining (7 days after IRI). The bar graph compared the extent of renal fibrosis in the two groups. #p < 0.02. (F) Expression of TGFβ and Col1A in kidney (7 days after IRI). The levels of TGFβ and Col1A mRNA were analyzed and expressed as ratios to GAPDH mRNA. # p < 0.01. (G) KIM-1 expression was examined by immunohistochemistry (7 days after IRI). The bar graph summarized the results of KIM-1 staining in these mice. #p < 0.02. (H) Renal apoptosis was analyzed by TUNEL staining (7 days after IRI). Upper panels show representative microscopic images, while lower panels summarized results of quantification of apoptotic cells from the two groups of mice. (I) Activation of caspase 3 and 9 in kidneys (7 days after IRI). Activated caspase 3 and 9 were analyzed by immunohistochemistry. The bar graph summarized the results of staining in these mice. #p < 0.01. (J) Glomerulosclerosis was analyzed by Periodic acid–Schiff (PAS) staining. The PAS results were graded as follows: 0 (no lesions), 1 (lesions in up to 25% of glomeruli), 2 (lesions in 25 to 50% of glomeruli) or 3 (lesions in > 50% of glomeruli). The representative images were shown in the upper panel. At least 50 glomeruli were scored for each mouse, the results were summarized in the graph (lower panel). **p<0.001. NS - not significant. (K) Survival analysis after IRI was compared in the two groups (TAM n=30, Corn oil n=28, all male). 46.7% TAM-treated KMDAKT mice survived by day 45, as compared to 85.7% control mice. Log rank test, p=0.0013.
Figure 4.
Figure 4.. Augmentation of mitochondria AKT in tubules reversed kidney failure induced by ischemia reperfusion.
(A) The experimental protocol of ischemia reperfusion injury for this series of study. (B, C) Acute kidney injury was induced by IR in male KMCAKT mice. BUN and Cr were measured after IRI in the TAM-treated KMCAKT and corn oil-treated KMCAKT mice. Tam-KMCAKT mice showed lower BUN and Cr after day 2 (*p<0.032, **p<0.001). (D) Renal histology (7 days after IRI) was HE stained to estimate Jablonski scores. OSOM - outer stripe outer medulla. ISOM - inner stripe outer medulla. IM - inner medulla. Jablonski scores are summarized in the bar graph (*p ≤ 0.001). (E) Renal fibrosis was analyzed by Masson’s trichrome staining (7 days after IRI). The bar graph compared the extent of renal fibrosis in the two groups (p=0.002). (F) KIM-1 expression immunohistochemistry (7 days after IRI). The bar graph summarized the results of KIM-1 staining in these mice (*p<0.002). (G) Renal apoptosis was analyzed by TUNEL staining (7 days after IRI). The upper panel showed representative microscopic images, the lower panel summarized quantification of apoptotic nuclei from the two groups of mice (*p<0.003). (H) Activation of caspase 3 and 9 in kidneys (7 days after IRI). Activated caspase 3 and 9 were analyzed by immunohistochemistry. The bar graph summarized the results of staining in these mice. *p < 0.001. (I) Glomerulosclerosis was analyzed by Periodic acid-Schiff (PAS) staining. The PAS results were graded as follows: 0 (no lesions), 1 (lesions in up to 25% of glomeruli), 2 (lesions in 25 to 50% of glomeruli) or 3 (lesions in > 50% of glomeruli). The representative images were shown in the upper panel. 50 glomeruli were scored for each mouse (15 mice in each group), the results were summarized in the graphs (lower panel, *p<0.003). (J) Survival analysis after IRI was compared in the two groups (TAM n=26, Corn oil n=24) (H). 76.9% of TAM-treated KMCAKT mice survived by day 7, as compared to 20.83% in control mice. Log rank test, p<0.0001.
Figure 5.
Figure 5.. Inhibition of mitochondria AKT uncoupled mitochondria respiration and decreased cellular ATP in renal tubular epithelial cells.
(A) Primary renal tubule epithelial cells (RTE) were isolated from 3-week-old KMDAKT mice and enrichment was quantified using the renal epithelial cell marker AQP1. (B) Primary RTE cells were treated with DMSO or 10ng/ml of tamoxifen (4-OH TAM) for transgene induction. (C) RTE cells were plated for Seahorse XF Analyzer. After basal extracellular respiration rates (OCR) analysis, different inhibitors were injected sequentially to measure different stages of respiration (complex V inhibitor: oligomycin, uncoupler: carbonyl cyanide 4-(trifluoromethoxy) phenylhydrazone, and complex I inhibitor: Rotenone) as shown in D–G. The basal respiration, (p<0.001), spare respiration (p=0.00076), ATP dependent respiration (p<0.001) and proton leak (p<0.001) were all significantly higher in the 4-OH TAM treated cells than DMSO treated cells. (H) Sixty hours after 4-OH TAM or DMSO treatment, ATP levels were reduced in KMDAKT cells expressing dnAKT1 (*p<0.04). (I) Lipid peroxidation in KMDAKT kidneys. Lipid peroxidation was measured and the results showed higher lipid peroxidation in the Tam-KMDAKT kidneys. *p < 0.01. (J) Abundance of mitochondria in KMDAKT kidneys. The content of mitochondria DNA was analyzed by real-time PCR and presented as a ratio of mitochondria DNA to nuclear DNA. NS: p value not significant. (K) DRP1 staining in KMDAKT kidneys. Mitochondria fission marker DRP1 was analyzed with immunofluorescence. The bar graph summarized the results from each mice. *p< 0.001.

References

    1. Yang JY, Deng W, Chen Y, et al. Impaired translocation and activation of mitochondrial Akt1 mitigated mitochondrial oxidative phosphorylation Complex V activity in diabetic myocardium. J Mol Cell Cardiol. 2013;59:167–175. - PMC - PubMed
    1. Wang Z, Ying Z, Bosy-Westphal A, et al. Specific metabolic rates of major organs and tissues across adulthood: evaluation by mechanistic model of resting energy expenditure. Am J Clin Nutr. 2010;92(6):1369–77. - PMC - PubMed
    1. Li SY, Susztak K. The Role of Peroxisome Proliferator-Activated Receptor gamma Coactivator 1alpha (PGC-1alpha) in Kidney Disease. Semin Nephrol. 2018;38(2):121–6. - PMC - PubMed
    1. Portilla D, Dai G, McClure T, et al. Alterations of PPARalpha and its coactivator PGC-1 in cisplatin-induced acute renal failure. Kidney Int. 2002;62(4):1208–18. - PubMed
    1. Forbes JM. Mitochondria-Power Players in Kidney Function?. Trends Endocrinol Metab. 2016;27(7):441–4425. - PubMed

Publication types