. 2020 Dec 9;20(24):7035.
doi: 10.3390/s20247035.

Setup, Test and Validation of a UHF RFID System for Monitoring Feeding Behaviour of Dairy Cows

Affiliations

Setup, Test and Validation of a UHF RFID System for Monitoring Feeding Behaviour of Dairy Cows

Felix Adrion et al. Sensors (Basel). .

Abstract

Feeding behaviour can be used as an important indicator to support animal management. However, using feeding behaviour as a tool for dairy cow management an automatic sensor system is needed. Hence, the objective of this study was to setup, test and validate a ultra-high frequency (UHF) radio-frequency identification (RFID) system for measuring time dairy cows spent at the feed fence using two types of passive UHF ear tags. In a first experiment, the reading area of the system was evaluated in two antenna positions. Subsequently, the UHF RFID system was validated with video observations and compared to the measurements of chewing time of a noseband pressure sensor and of the time spent at the feed fence registered by a sensor system with real-time localisation. Differences in the reading area were detected between the two antenna positions and types of ear tag. The antenna position leading to less false positive registrations was chosen for the experiment with cows. The validation with video data showed a high average sensitivity (93.7 ± 5.6%, mean ± standard deviation), specificity (97.8 ± 1.1%), precision (93.8 ± 2.3%) and accuracy (96.9 ± 0.9%) of the UHF RFID system for measuring the time spent at the feed fence. The comparison with the noseband pressure sensor and the real-time localisation resulted in high correlations with a correlation coefficient of r = 0.95 and r = 0.93, respectively. However, substantial absolute differences between the three systems pointed out differences between direct and indirect measures of feeding behaviour in general and between the different sensors in particular. Thus, detailed considerations are necessary before interpreting automatically measured feeding data generally.

Keywords: antenna; bout criterion; eating time; transponder.


Conflict of interest statement

The authors declare no conflict of interest.

Figures

Figure 1
Figure 1
(left): ultra-high frequency (UHF) ear tag Type A, (right): UHF ear tag Type B.
Figure 2
Figure 2
Setup of the antenna at the feed fence. (a) Antenna Position 1; (b) Antenna Position 2.
Figure 3
Figure 3
Coordinate grid for reading range measurements in front and behind the feed fence. Measurements were conducted at heights of 30, 55, 80 and 105 cm above the floor. Each x-coordinate represents the centre of a feeding place along the feed fence.
Figure 4
Figure 4
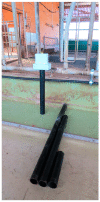
Polystyrene holder with ear tag and polyvinyl chloride (PVC) pipes of different lengths to maintain the targeted height during the measurements.
Figure 5
Figure 5
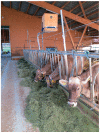
Installation of the three cable antennas along the feed fence.
Figure 6
Figure 6
Interpolated contour plot showing the percentage of successful detections per coordinate of UHF ear tag Type A overall heights and for both antenna positions. Major ticks on the x- and y-axes indicate the measurement coordinates. Each x-coordinate represents the centre of a feeding place along the feed fence.
Figure 7
Figure 7
Interpolated contour plot showing the percentage of successful detections per coordinate of UHF ear tag Type B over all heights and for both antenna positions. Major ticks on the x- and y-axes indicate the measurement coordinates. Each x-coordinate represents the centre of a feeding place along the feed fence.
Figure 8
Figure 8
Interpolated contour plot showing the number of successful detections per coordinate for both types of UHF ear tag at a height of 55 cm and for Antenna Position 2. Major ticks on the x- and y-axes indicate the measurement coordinates. Each x-coordinate represents the centre of a feeding place along the feed fence.
Figure 9
Figure 9
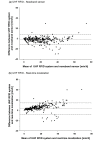
Agreement of the 1-hour summaries of time spent at the feed fence measured with the UHF RFID system versus (a) eating time of the RumiWatch noseband sensor and versus (b) the time spent at the feed fence extracted from the real-time localisation data of the Smartbow® system shown in Bland–Altman plots. The solid line indicates the mean of the differences, the dashed lines indicate the upper and lower 95% limits of agreement.

References

    1. Weary D.M., Huzzey J.M., Von Keyserlingk M.A. Board-invited review: Using behavior to predict and identify ill health in animals1. J. Anim. Sci. 2009;87:770–777. doi: 10.2527/jas.2008-1297. - DOI - PubMed
    1. Beauchemin K.A. Invited review: Current perspectives on eating and rumination activity in dairy cows. J. Dairy Sci. 2018;101:4762–4784. doi: 10.3168/jds.2017-13706. - DOI - PubMed
    1. Chapinal N., Veira D., Weary D., Von Keyserlingk M.A.G. Technical note: Validation of a system for monitoring individual feeding and drinking behavior and intake in group-housed cattle. J. Dairy Sci. 2007;90:5732–5736. doi: 10.3168/jds.2007-0331. - DOI - PubMed
    1. Mendes E.D.M., E Carstens G., Tedeschi L.O., Pinchak W.E., Friend T. Validation of a system for monitoring feeding behavior in beef cattle1. J. Anim. Sci. 2011;89:2904–2910. doi: 10.2527/jas.2010-3489. - DOI - PubMed
    1. Zehner N., Umstatter C., Niederhauser J.J., Schick M. System specification and validation of a noseband pressure sensor for measurement of ruminating and eating behavior in stable-fed cows. Comput. Electron. Agric. 2017;136:31–41. doi: 10.1016/j.compag.2017.02.021. - DOI

LinkOut - more resources