Alcohol associated liver cirrhotics have higher mortality after index hospitalization: Long-term data of 5,138 patients
- PMID: 33317256
- PMCID: PMC7820216
- DOI: 10.3350/cmh.2020.0068
Alcohol associated liver cirrhotics have higher mortality after index hospitalization: Long-term data of 5,138 patients
Abstract
Background/aims: Liver cirrhosis is an important cause of morbidity and mortality globally. Every episode of decompensation and hospitalization reduces survival. We studied the clinical profile and long-term outcomes comparing alcohol-related cirrhosis (ALC) and non-ALC.
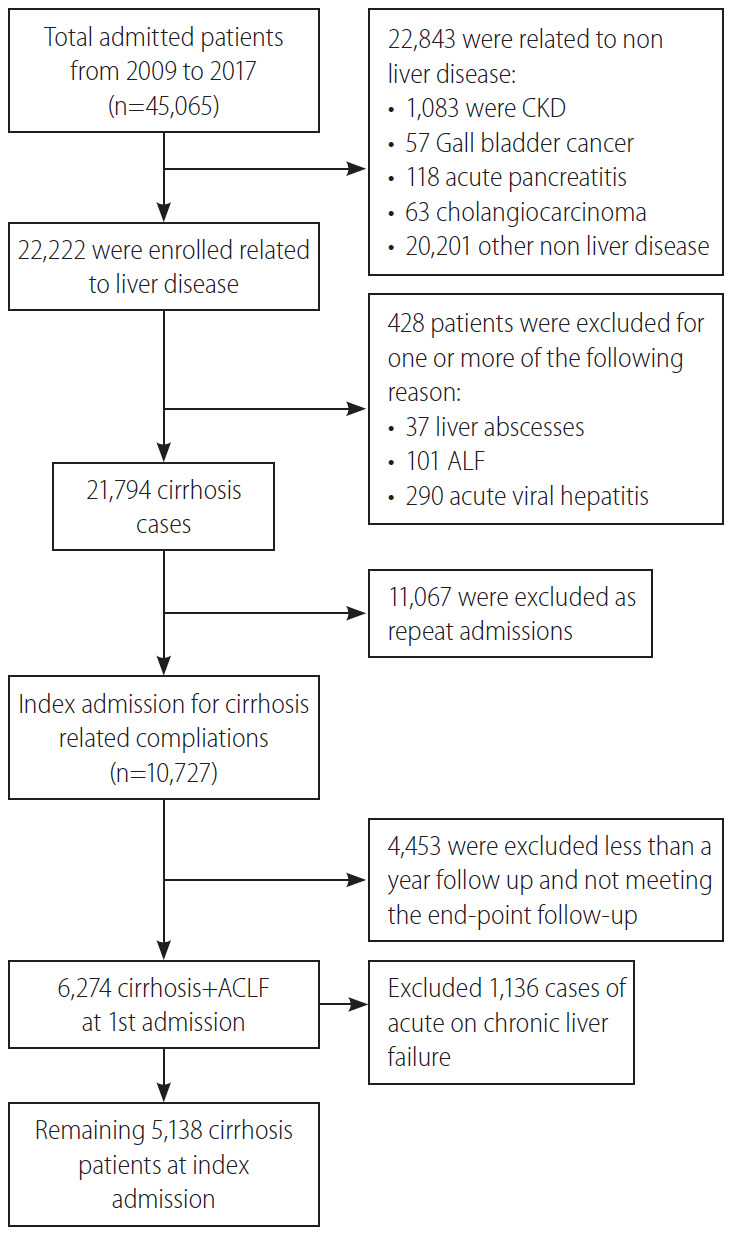
Methods: Cirrhosis patients at index hospitalisation (from January 2010 to June 2017), with ≥1 year follow-up were included.
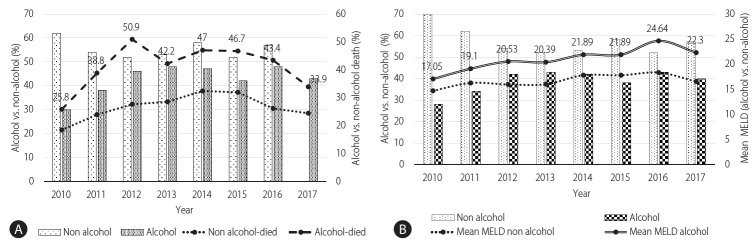
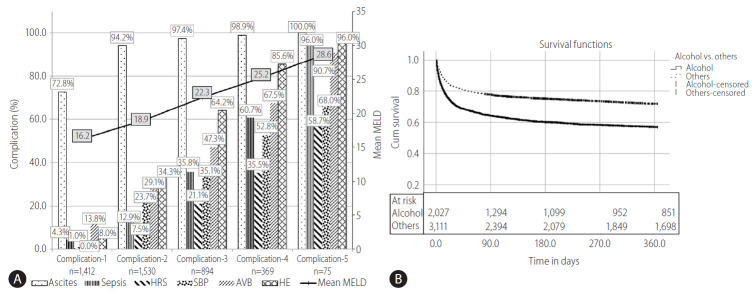
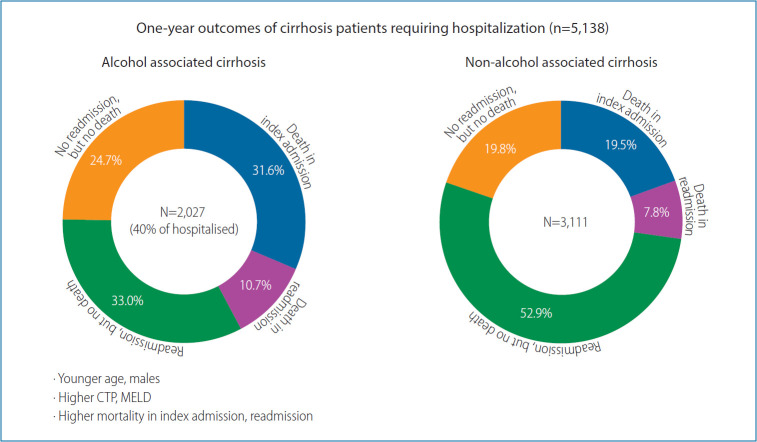
Results: Five thousand and one hundred thirty-eight cirrhosis patients (age, 49.8±14.6 years; male, 79.5%; alcohol, 39.5%; Child-A:B:C, 11.7%:41.6%:46.8%) from their index hospitalization were analysed. The median time from diagnosis of cirrhosis to index hospitalization was 2 years (0.2-10). One thousand and seven hundred seven patients (33.2%) died within a year; 1,248 (24.3%) during index hospitalization. 59.5% (2,316/3,890) of the survivors, required at least one readmission, with additional mortality of 19.8% (459/2,316). ALC compared to non-ALC were more often (P<0.001) male (97.7% vs. 67.7%), younger (40-50 group, 36.2% vs. 20.2%; P<0.001) with higher liver related complications at baseline, (P<0.001 for each), sepsis: 20.3% vs. 14.9%; ascites: 82.2% vs. 65.9%; spontaneous bacterial peritonitis: 21.8% vs. 15.7%; hepatic encephalopathy: 41.0% vs. 25.0%; acute variceal bleeding: 32.0% vs. 23.7%; and acute kidney injury 30.5% vs. 19.6%. ALC patients had higher Child-Pugh (10.6±2.0 vs. 9.0±2.3), model for end-stage liver-disease scores (21.49±8.47 vs. 16.85±7.79), and higher mortality (42.3% vs. 27.3%, P<0.001) compared to non-ALC.
Conclusion: One-third of cirrhosis patients die in index hospitalization. 60% of the survivors require at least one rehospitalization within a year. ALC patients present with higher morbidity and mortality and at a younger age.
Keywords: Ascites; Bleeding; Cirrhosis; Morbidity; Mortality.
Conflict of interest statement
Figures
Comment in
-
Alcohol-related cirrhosis: The most challenging etiology of cirrhosis is more burdensome than ever.Clin Mol Hepatol. 2021 Jan;27(1):94-96. doi: 10.3350/cmh.2020.0305. Epub 2020 Dec 3. Clin Mol Hepatol. 2021. PMID: 33317236 Free PMC article. No abstract available.
References
-
- Sarin SK, Maiwall R. Global burden of liver disease: a true burden on health sciences and economies. World Gastroenterology Organisation web site, < https://www.worldgastroenterology.org/publications/e-wgn/e-wgn-expert-po...>. Accessed 15 Aug 2020.
-
- Lim YS, Kim WR. The global impact of hepatic fibrosis and end-stage liver disease. Clin Liver Dis. 2008;12:733–746. vii. - PubMed
-
- Scaglione S, Kliethermes S, Cao G, Shoham D, Durazo R, Luke A, et al. The epidemiology of cirrhosis in the United States: a population-based study. J Clin Gastroenterol. 2015;49:690–696. - PubMed
MeSH terms
LinkOut - more resources
Full Text Sources
Other Literature Sources