. 2020 Dec 14;18(1):481.
doi: 10.1186/s12967-020-02641-0.

Human breast milk as source of sphingolipids for newborns: comparison with infant formulas and commercial cow's milk

Affiliations

Human breast milk as source of sphingolipids for newborns: comparison with infant formulas and commercial cow's milk

Michele Dei Cas et al. J Transl Med. .

Abstract

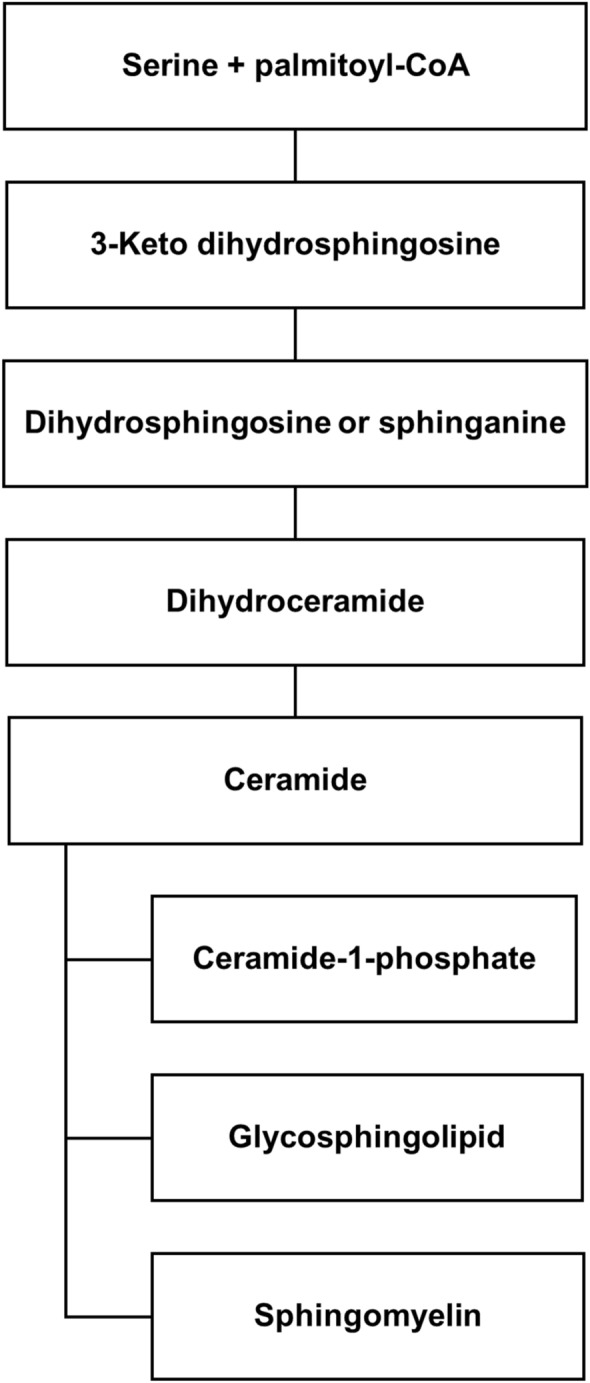
Background: In the past two decades, sphingolipids have become increasingly appreciated as bioactive molecules playing important roles in a wide array of pathophysiology mechanisms. Despite advances in the field, sphingolipids as nutrients remain little explored. Today the research is starting to move towards the study of the sphingomyelin content in human breast milk, recommended for feeding infants.

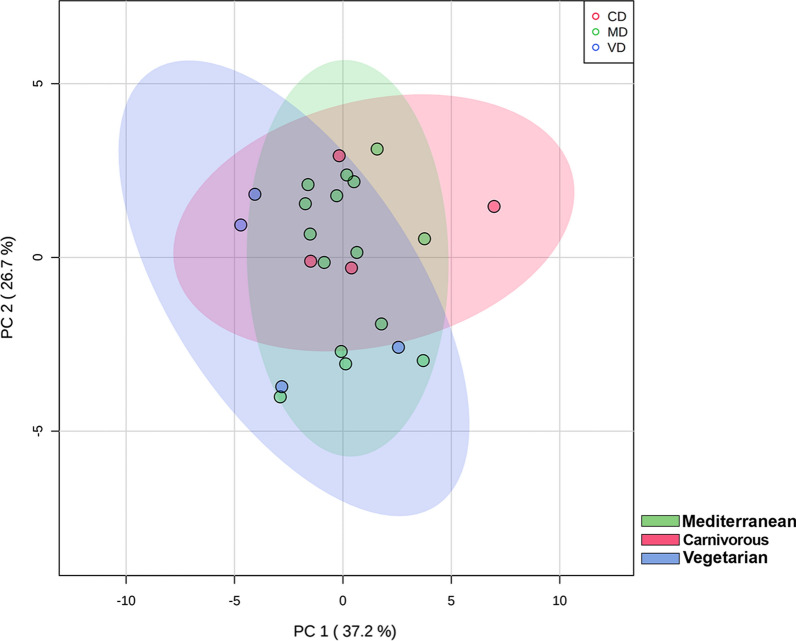
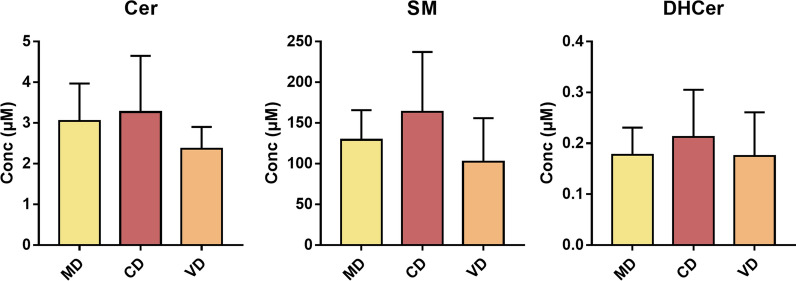
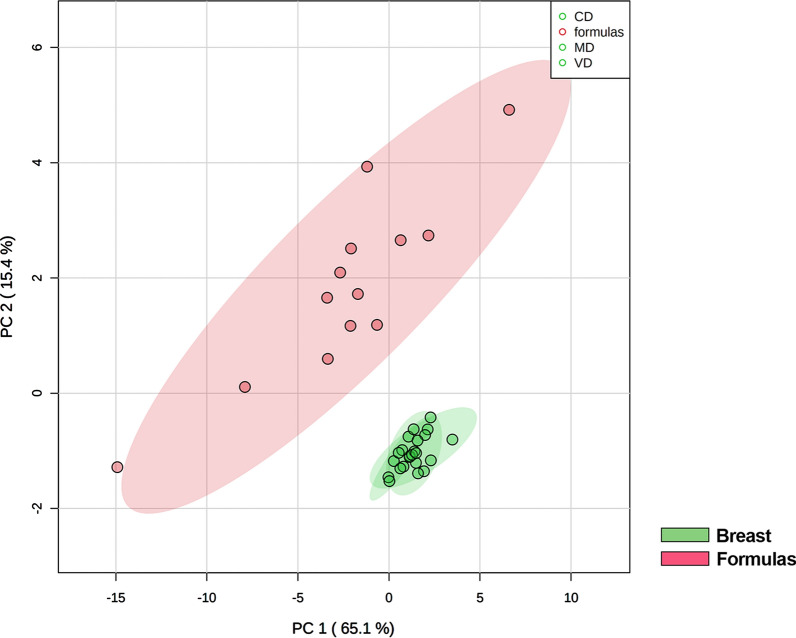
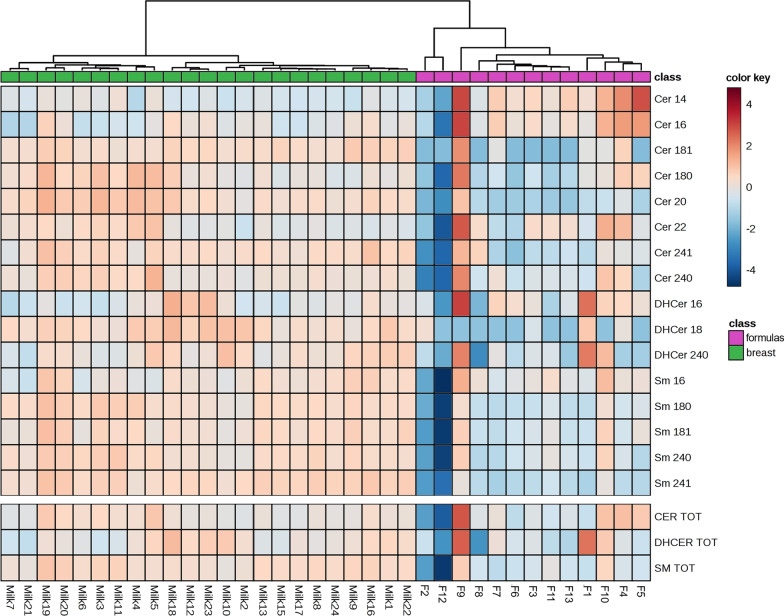
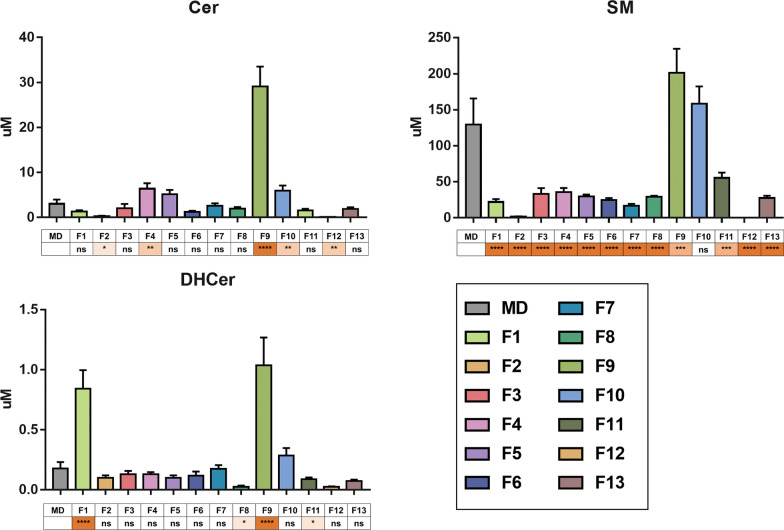
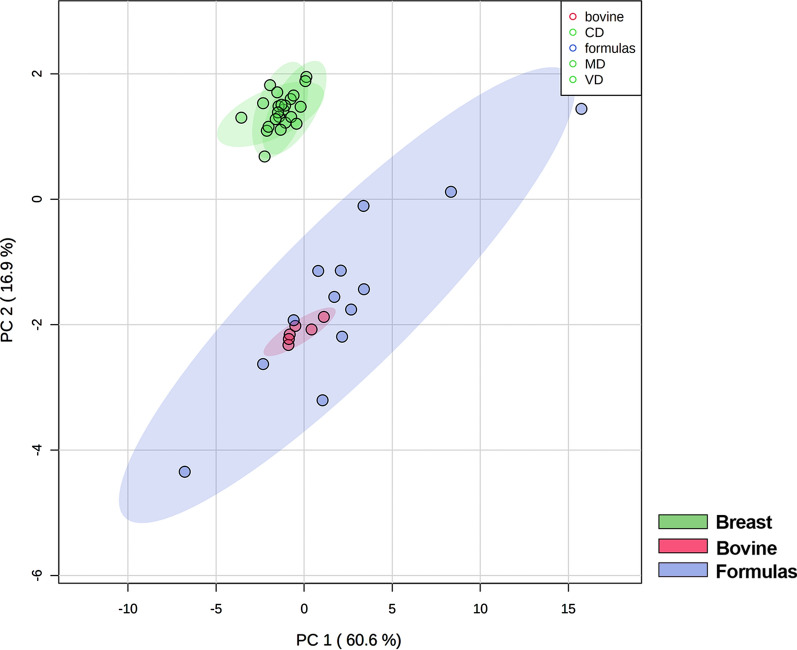
Methods: In the present study, we performed a lipidomic analysis in human breast milk in relation with maternal diet during pregnancy, in infant formulas, and in commercial whole and semi-skimmed milks for adults. Mediterranean, carnivorous and vegetarian diets were considered.

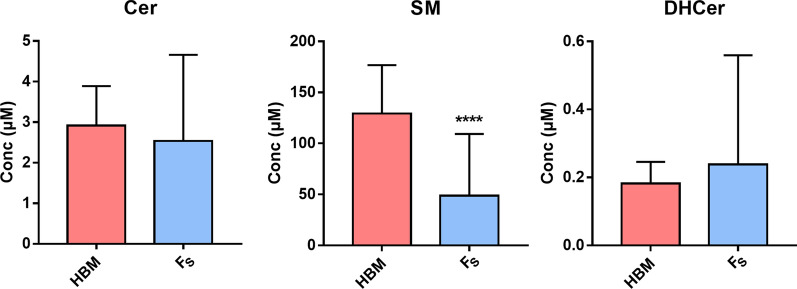
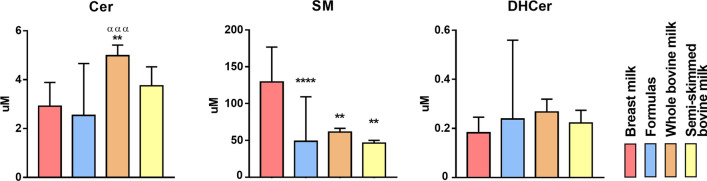
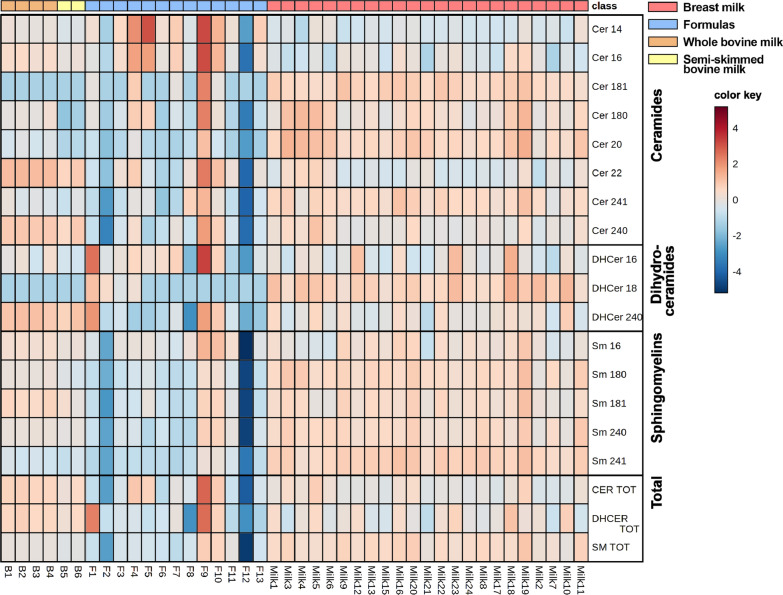
Results: The results showed that total sphingomyelin, ceramide and dihydroceramide species are independent on the diet. Interestingly, the milk sphingolipid composition is species-specific. In fact, infant formulas and commercial milks for adults have a lower level of total sphingomyelin and ceramide content than human breast milk with very different composition of each sphingolipid species.

Conclusions: We conclude that human breast milk is a better source of sphingolipids than infant formulas for baby nutrition with potential implications for the brain development and cognitive functions.

Keywords: Ceramide; Cow’s milk; Human breast milk; Infant formulas; Lipidomic; Sphingomyelin.


Conflict of interest statement

The authors declare no conflicts of interest.

Figures

Fig. 1
Fig. 1
Diagram of sphingolipid biosynthetic pathways
Fig. 2
Fig. 2
Comparison of breast milk samples according to the women’s diet by multivariate discriminant analysis (PLSDA). The axes are ranked according to their importance in the group discrimination. In the abscissa axis, component 1 (PC1, 37%) represents the maximum of the separation that can be reached within these cluster and variables, that is the direction in the original data that contains the most variance between the groups. In the ordinate axis, component 2 (PC2, 8.8%) represents the direction that contains the most remaining variance. Coloured area indicates the 95% confidence interval of each cluster
Fig. 3
Fig. 3
Brest milk Sphs composition depending on types of diets. Data are expressed as μM concentration and represent the mean ± SD of milk samples of mothers who followed a Mediterranean (MD, yellow, n = 15), carnivorous (CD, red, n = 4), and vegetarian (VD, orange, n = 4) diet. Cer, ceramide; SM, sphingomyelin; DHCer, dihydroceramide. No Statistical difference among groups was found by one-way ANOVA coupled with Bonferroni post hoc test
Fig. 4
Fig. 4
Brest milk Sphs composition depending on gestational age. Data are expressed as μM concentration and represent the mean ± SD of milk samples of mothers who had full term birth (FTB, light blue, n = 18) and of mothers who had preterm birth (PTB, pink, n = 5). Cer, ceramide; SM, sphingomyelin; DHCer, dihydroceramide. No statistical difference between groups was found by unpaired t-test
Fig. 5
Fig. 5
Comparison of commercial infant formulas (red) and breast milks (green) by PLSDA. The groups are separated on component 1 of 65%
Fig. 6
Fig. 6
Sphs composition in infant formulas and human breast milk. Data are expressed as μM concentration and represent the mean ± SD of infant formulas (Fs, light blue, n = 12 excluding the outlier F9) and of the total human breast milks (HBM, red, n = 23) included in the study. Cer, ceramide; SM, sphingomyelin; DHCer, dihydroceramide. Statistical difference (**** p < 0.0001) was established by unpaired t-test
Fig. 7
Fig. 7
Hierarchical clustering coupled with heatmap representation of the Sphs in milk samples as function of the sources indicated as class: infant formulas (fuchsia) vs human breast milk (green). The concentrations were autoscaled and log-transformed for visualization. The color-scale differentiates values as high (red), mean (grey) and low (blue)
Fig. 8
Fig. 8
Sphs composition among different infant formulas (F, coded by different bars colours) compared with breast milk of mothers who followed the Mediterranean diet (MD, bars grey, n = 15). Statistical difference between groups (*p < 0.05; **p < 0.01; *** p < 0.001; ns, no statistical differences) was established by one-way ANOVA coupled with Bonferroni post hoc test against breast milk
Fig. 9
Fig. 9
Comparison of commercial infant formulas, breast milks and cow’s milks by multivariate discriminant analysis (PLSDA). The groups are separated on component 1 of 61%
Fig. 10
Fig. 10
Sphs levels in different milk sources: human breast milk (coral, n = 23), infant formulas (pale blue, n = 12 excluding the outlier F9), whole bovine (orange, n = 4) and semi-skimmed bovine (pale yellow, n = 2) milks. Statistical difference was established by one-way ANOVA coupled with Bonferroni post hoc test * indicate statistical differences against the HBM, whereas α against infant formulas. (**p < 0.01; **** p < 0.0001; α α p < 0.01; α α α α p < 0.0001)
Fig. 11
Fig. 11
Heatmap representation of the Sphs concentration as function of the milk sources considered: HBM (coral), infant formulas (pale blue), whole (orange) and semi-skimmed (pale yellow) cow’s milks. The color-scale differentiates values as high (red), mean (grey) and low

References

    1. Albi E, Alessenko A, Grösch S. Sphs in Inflammation. Mediators Inflamm. 2018:7464702. - PMC - PubMed
    1. Mullen TD, Hannun YA, Obeid LM. Ceramide synthases at the centre of sphingolipid metabolism and biology. Biochem J. 2012;441:789–802. doi: 10.1042/BJ20111626. - DOI - PMC - PubMed
    1. Alessenko AV, Albi E. Exploring sphingolipid implications in neurodegeneration. Front Neurol. 2020;11:437. doi: 10.3389/fneur.2020.00437. - DOI - PMC - PubMed
    1. Tayebi N, Walker J, Stubblefield B, Orvisky E, LaMarca ME, Wong K, et al. Gaucher disease with parkinsonian manifestations: does glucocerebrosidase deficiency contribute to a vulnerability to parkinsonism? Mol Genet Metab. 2003;79:104–109. doi: 10.1016/S1096-7192(03)00071-4. - DOI - PubMed
    1. Kinoshita M, Suzuki KGN, Murata M, Matsumori N. Evidence of lipid rafts based on the partition and dynamic behavior of sphingomyelins. Chem Phys Lipids. 2018;215:84–95. doi: 10.1016/j.chemphyslip.2018.07.002. - DOI - PubMed

Publication types