. 2020 Dec 15:9:e57950.
doi: 10.7554/eLife.57950.

Autophagy in T cells from aged donors is maintained by spermidine and correlates with function and vaccine responses

Affiliations

Autophagy in T cells from aged donors is maintained by spermidine and correlates with function and vaccine responses

Ghada Alsaleh et al. Elife. .

Abstract

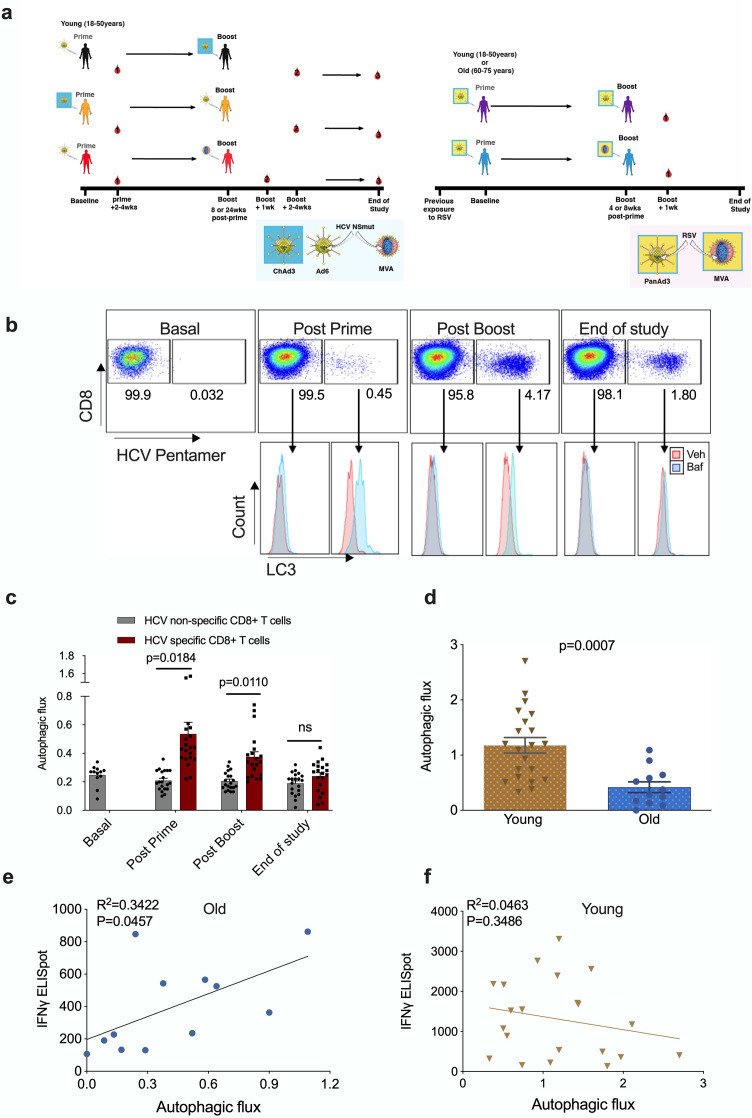
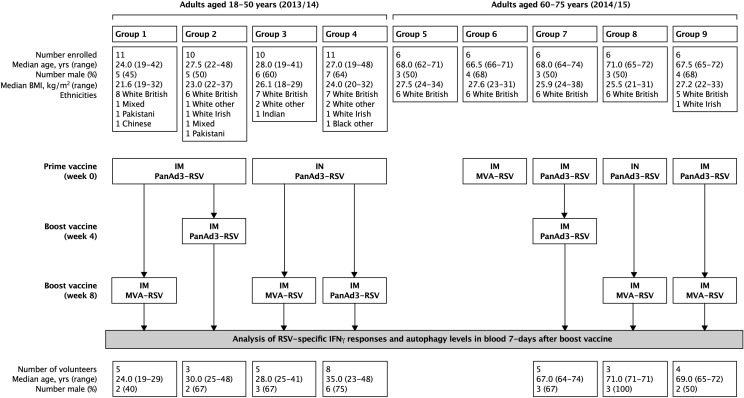
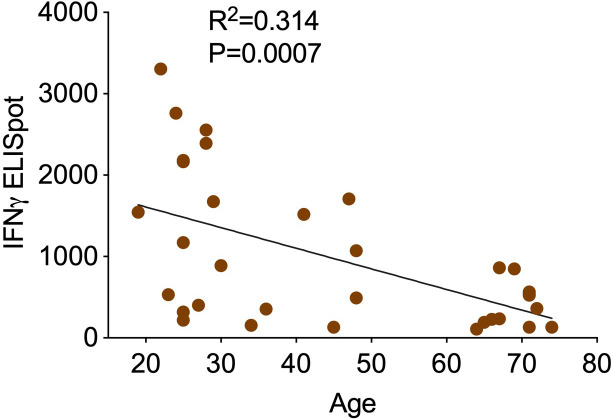
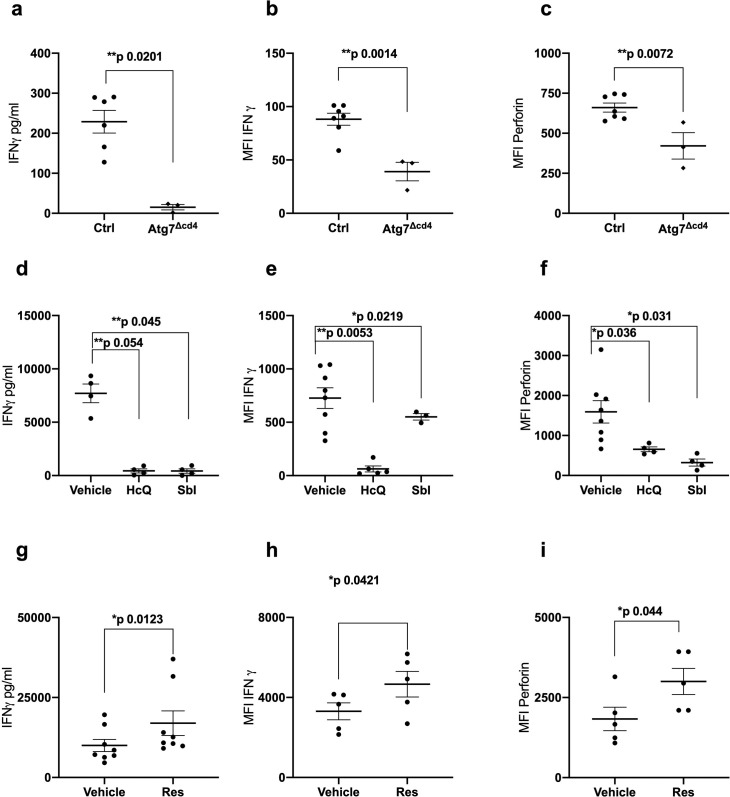
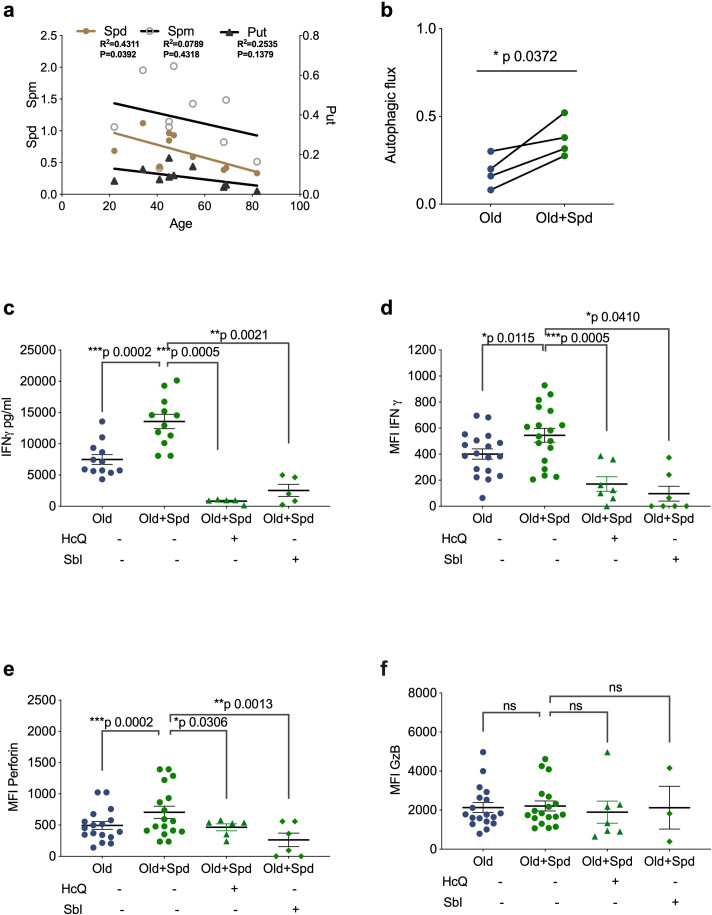
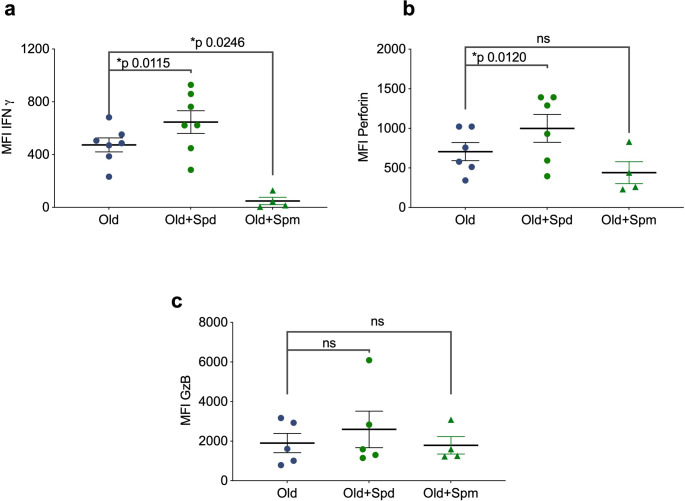
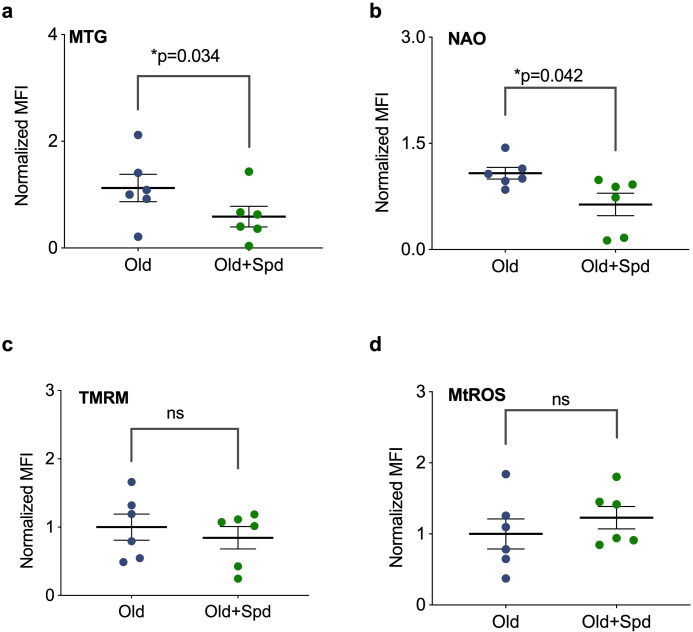
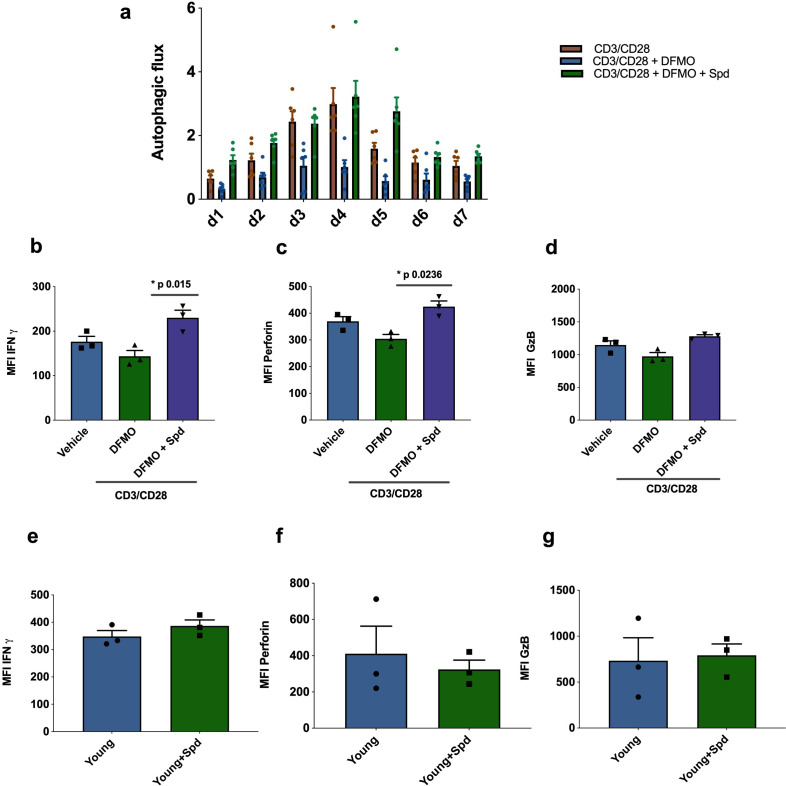
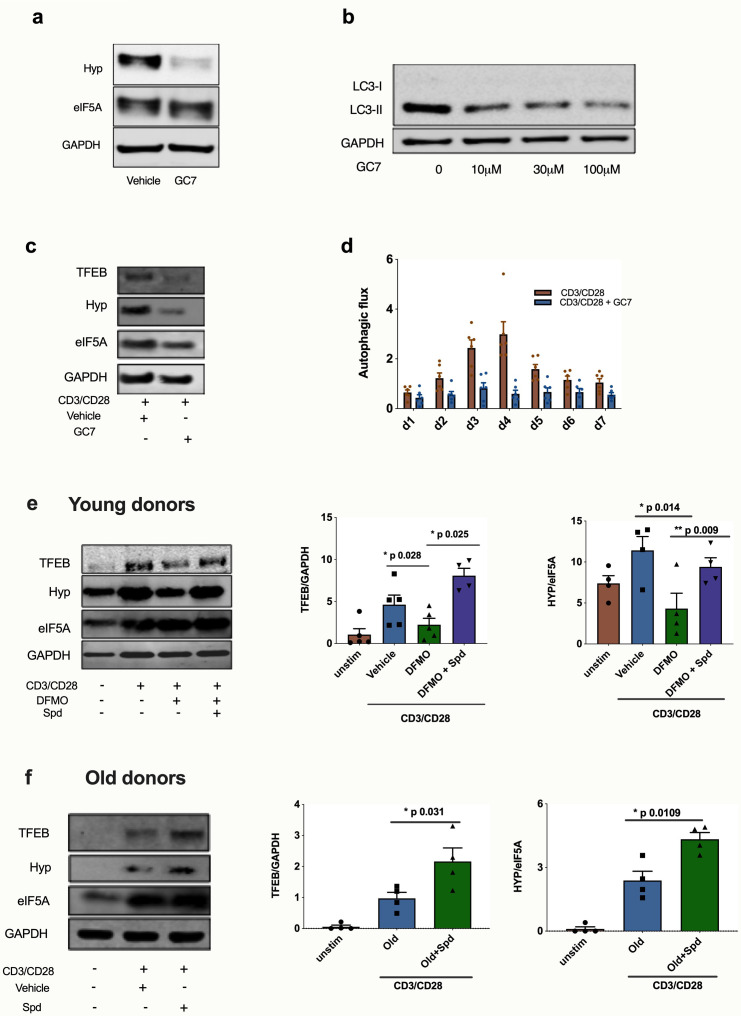
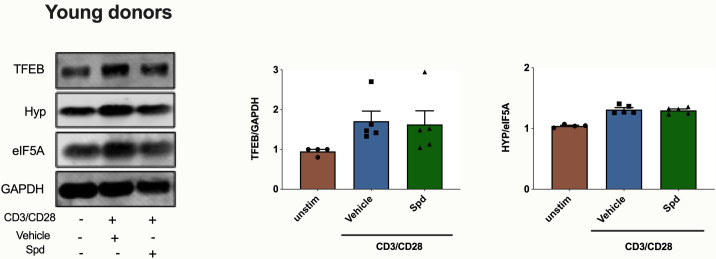
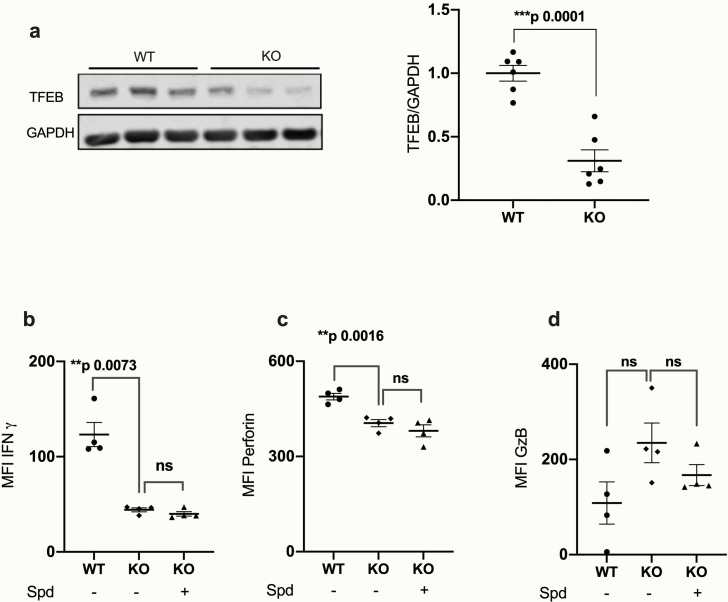
Vaccines are powerful tools to develop immune memory to infectious diseases and prevent excess mortality. In older adults, however vaccines are generally less efficacious and the molecular mechanisms that underpin this remain largely unknown. Autophagy, a process known to prevent aging, is critical for the maintenance of immune memory in mice. Here, we show that autophagy is specifically induced in vaccine-induced antigen-specific CD8+ T cells in healthy human volunteers. In addition, reduced IFNγ secretion by RSV-induced T cells in older vaccinees correlates with low autophagy levels. We demonstrate that levels of the endogenous autophagy-inducing metabolite spermidine fall in human T cells with age. Spermidine supplementation in T cells from old donors recovers their autophagy level and function, similar to young donors' cells, in which spermidine biosynthesis has been inhibited. Finally, our data show that endogenous spermidine maintains autophagy via the translation factor eIF5A and transcription factor TFEB. In summary, we have provided evidence for the importance of autophagy in vaccine immunogenicity in older humans and uncovered two novel drug targets that may increase vaccination efficiency in the aging context.

Trial registration: ClinicalTrials.gov NCT01070407 NCT01296451.

Keywords: TFEB; autophagy; human; human T cells; immunology; inflammation; spermidine; vaccine.


Conflict of interest statement

GA, IP, LS, HZ, FR, AM, JL, EB, PK, CG, AS No competing interests declared

Figures

Figure 1.
Figure 1.. Autophagy is induced by vaccination in antigen-specific T cells and correlates with donor age.
PBMCs were isolated from blood samples of vaccinated healthy donors. LC3-II was measured in CD8+ cells using flow cytometry after 2 hr treatment with 10 nM bafilomycin A1 (BafA1) or vehicle. Autophagic flux was calculated as LC3-II mean fluorescence intensity (BafA1-Vehicle)/Vehicle. (a) Vaccine regimen for HCV and RSV trials. (b) Representative plots showing BafA1 in light blue and vehicle pink. (c) Quantification in HCV non-specific CD8+ T cells and HCV-specific CD8+ T cells detected by HCV pentamers from 10 vaccinees (includling duplicates) using different HCV vaccine regimens, priming with ChimAd and boosting with MVA or AD6 vectors. Autophagy was measured at the peak of the T cell response post prime vaccination, peak of the T cell response post boost vaccination and at the end of the study. (d) Autophagic flux was measured in CD8+ cells from young donors (N = 12,<65 years) and old donors (N = 21,>65 years) vaccinated with respiratory syncytial virus (RSV) 7 days after last boost, quantification calculated as mentioned above. Data represented as mean ± SEM. (e, f) Correlation of autophagic flux with total response to peptide pools specific T cell IFNγ response to RSV exposure measured by ELISpot in CD8+ cells from old donors (e) and young donors (f), donors as in (d). Linear regression with 95% confidence intervals from old and young donors. The goodness of fit was assessed by R2. The p value of the slope is calculated by F test.
Figure 1—figure supplement 1.
Figure 1—figure supplement 1.. Autophagy levels by flow cytometry-based assay and conventional LC3 western blot in Jurkat cell line and PBMCs.
(a–b) Human Jurkat T cell line was cultured for 24 hr and treated with or without Bafilomycin A1 for the last 2 hr. Cells were split into two aliquots, representative flow cytometry-based assay (a), representative western blot for LC3-II and GAPDH for the same sample (b). (c–d) PBMCs from young human donors were cultured with anti-CD3/CD28 for 3 days in the absence/presence of Bafilomycin A1 for the last 2 hr. Cells were split into two aliquots, representative flow cytometry-based assay (c), representative western blot for LC3-II and GAPDH for the same sample (d).
Figure 1—figure supplement 2.
Figure 1—figure supplement 2.. LC3-II detection by flow cytometry is a reliable and reproducible technique in immune cells over several blood draws.
PBMCs were generated from blood taken at 3 weeks intervals (samples 1, 2, 3) from young human donors and were cultured for 24 hr, in the abence/presence of Bafilomycin A1 for the last 2 hr. Here basal autophagic flux was calculated as LC3-II mean fluorescence intensity (treatment-basal)/basal. Monocytes gated on CD14+ treated with IFNγ or LPS (a), B cells gated on CD19+ treated with anti-CD40L and anti-IgM (b), CD4+ T cells gated on CD3+CD4+ treated with anti-CD3/CD28 (c), CD8+ T cells gated on CD3+ CD8+ treated with anti-CD3/CD28 (d).
Figure 1—figure supplement 3.
Figure 1—figure supplement 3.. Regimen of immunizations and blood sampling for HCV trail.
HCV = Hepatitis C virus, ChAd = Chimpanzee Adenoviral Vector, MVA = Modified Ankara Virus vector.
Figure 1—figure supplement 4.
Figure 1—figure supplement 4.. Regimen of immunizations and blood sampling for RSV trail.
RSV = respiratory syncitial virus, ChAd = Chimpanzee Adenoviral Vector, MVA = Modified Ankara Virus vector, Unlike for HCV, the adults in the RSV study will have prior immune responses that have been boosted by natural exposure throughout life. In the context of RSV, we still use the term ‘prime’ to mean the first dose of vaccine. Similarly, the term ‘boost’ means the second dose of vaccine and not exposure.
Figure 1—figure supplement 5.
Figure 1—figure supplement 5.. Correlation of age with total and peptide-pool specific T cell IFNγ response to RSV exposure measured by ELISpot in CD8+ cells, donors as in Figure 1e.
Linear regression with 95% confidence intervals from old and young donors. The goodness of fit was assessed by R2. The p value of the slope is calculated by F test.
Figure 2.
Figure 2.. Autophagy is required for CD8+ T cell function.
(a–c) Splenocytes from control mice (Ctrl: CD4-cre;Atg7+/+) and Atg7 knockout mice (Atg7Δcd4: CD4-cre;Atg7-/-) were cultured with anti-CD3/CD28 for 4 days and IFNγ assessed by ELISA in tissue culture supernatant (a), intracellular IFNγ by flow cytometry (b), intracellular perforin by flow cytometry (c), all gated on CD8+ T cells. (d–i) PBMCs from human donors (>65 years) were cultured with anti-CD3/CD28 for 4 days and where indicated treated with 10 µM Hydroxychloroquine (HcQ), 10 µM BSI-0206965 (SbI), 10 µM Resveratrol (Res) and IFNγ assessed by ELISA in tissue culture supernatant (d, g), intracellular IFNγ by flow cytometry (e, h), intracellular perforin by flow cytometry (f, i), all gated on CD8+ cells. Data represented as mean ± SEM, MFI = mean fluorescence intensity. Statistics by paired t-test for (d–i).
Figure 3.
Figure 3.. Spermidine declines with age and supplementing spermidine improves autophagy and CD8+ T cell function in old donors.
(a) Spermidine (Spd), spermine (Spm), and putrescine (Put) content of PBMCs collected from healthy donors were measured by GC-MS. Linear regression with 95% confidence intervals. The goodness of fit was assessed by R (Lurie et al., 2020). The p value of the slope is calculated by F test. (b–f) PBMCs from old human donors (>65 years) were cultured with anti-CD3/CD28 for 4 days and where indicated treated with 10 µM spermidine alone or with 10 µM Hydroxychloroquine (HcQ), 10 µM SBI-0206965 (SbI), and autophagic flux measured by flow cytometry (b), IFNγ assessed by ELISA in tissue culture supernatant (c), intracellular IFNγ by flow cytometry (d), intracellular perforin by flow cytometry (e), intracellular granzyme B (f), all gated on CD8+ cells. Data represented as mean ± SEM, MFI = mean fluorescence intensity. Statistics by paired t-test for (b–f).
Figure 3—figure supplement 1.
Figure 3—figure supplement 1.. Spermine does not improve function of CD8+ T cell from old donors.
PBMCs from old human donors (>65 years) were cultured with anti-CD3/CD28 for 4 days and where indicated treated with 10 µM spermidine or 10 µM spermine and intracellular IFNγ assessed by flow cytometry (a), intracellular perforin by flow cytometry (b), intracellular granzyme B (d), all gated on CD8+ cells. Data represented as mean ± SEM, MFI = mean fluorescence intensity. Statistics by paired t-test for (a–c).
Figure 3—figure supplement 2.
Figure 3—figure supplement 2.. Spermidine reduces mitochondrial mass in CD8+ T cell from old donors.
PBMCs from old human donors (>65 years) were cultured with anti-CD3/CD28 for 4 days and where indicated treated with 10 µM spermidine and quantified for mitochondrial mass by flow cytometry using MitoTracker Green (MTG) (a) or nonylacridine orange (NAO) (b). Mitochondrial membrane potential was assessed by flow cytometry using TMRM dye (c) and mitochondrial ROS (mtROS) by mitoSOX staining (d). All gated on CD8+ cells. Data represented as mean ± SEM, MFI = mean fluorescence intensity. MFI normalized to Old untreated group. Statistics by paired t-test for (a–d).
Figure 4.
Figure 4.. Endogenous spermidine maintains levels of autophagy and T cell function.
(a–d) PBMCs cells from young human donors (<65 years) were activated with anti-CD3/CD28 for 7 days and treated with spermidine synthesis inhibitor 1 mM DFMO alone or together with 10 µM spermidine (Spd). Autophagic flux (a) was assessed each day and IFNγ (b), Perforin (c), Granzyme B (d) were measured by flow cytometry in CD8+ cells on day 4. (e–f) PBMCs cells from young human donors (<65 years) were cultured with anti-CD3/CD28 for 4 days and streated with 10 µM spermidine. (e) Intracellular IFNγ, (f) intracellular perforin, (g) and intracellular granzyme B were measured in CD8+ cells by flow cytometry. Data represented as mean ± SEM.
Figure 5.
Figure 5.. Spermidine’s mode of action is via eIF5A and TFEB in human CD8+ T cells.
(a–d) Human T cell line Jurkat was cultured for 24 hr with 100 µM GC7, then eIF5A and hypusinated eIF5A were measured by WB (a). Jurkat cell line was stimulated with increasing concentrations of GC7 and cell lysates blotted for LC3B (b). (c–d) PBMCs from young human donors were cultured with anti-CD3/CD28 for 7 days and treated with GC7. The protein levels of TFEB and eIF5A hypusination were measured in CD8+ cells by Western blot on day 4 (c) and autophagic flux was determined as in Figure 1 (d). PBMCs from young human donors were cultured with anti-CD3/CD28 for 4 days and treated with spermidine synthesis inhibitor DFMO alone or together with 10 µM spermidine and the protein levels of TFEB and eIF5A hypusination were measured in CD8+ cells by wWestern blot (e), representative images (left) and quantified (right). PBMCs from old human donors (>65 years) were cultured with anti-CD3/CD28 for 4 days and where indicated treated with 10 µM spermidine and the protein levels of TFEB and eIF5A hypusination were measured in CD8+ cells by wWestern blot (f), representative images (left) and quantified (right). Target band intensity was normalized to eIF5A (for Hyp) or GAPDH (for TFEB). Data represented as mean ± SEM.
Figure 5—figure supplement 1.
Figure 5—figure supplement 1.. Spermidine does not improve eIF5A and TFEB in young donors.
PBMCs from young human donors were cultured with anti-CD3/CD28 for 4 days and treated with 10 µM spermidine for 4 days. The protein levels of TFEB and eIF5A hypusination were measured in sorted CD8+ cells by wWestern blot, representative images (left) and quantified (right). Target band intensity was normalized to eIF5A (for Hyp) or GAPDH (for TFEB). Data represented as mean ± SEM.
Figure 5—figure supplement 2.
Figure 5—figure supplement 2.. TFEB is required for CD8+ T cell function.
Splenic T cells from wildtype C57BL/6 mice (WT) or tamoxifen-inducible Tfeb knockout mice (KO: CAG-Cre;Esr1+;Tfeb-/-) were cultured with anti-CD3/CD28 and 4-Hydroxytamoxifen (4-OHT) for 4 days. The protein levels of TFEB and GAPDH were measured in sorted CD8+ cells by wWestern blot (a) representative images (left) and quantified (right). Target band intensity was normalized to GAPDH. Intracellular IFNγ by flow cytometry (b), intracellular perforin by flow cytometry (c), intracellular granzyme B (d). All cells were gated on CD8+ T cells. Data represented as mean ± SEM, MFI = mean fluorescence intensity. Statistics by unpaired t-test.

References

    1. Araki K, Turner AP, Shaffer VO, Gangappa S, Keller SA, Bachmann MF, Larsen CP, Ahmed R. mTOR regulates memory CD8 T-cell differentiation. Nature. 2009;460:108–112. doi: 10.1038/nature08155. - DOI - PMC - PubMed
    1. Barnes E, Folgori A, Capone S, Swadling L, Aston S, Kurioka A, Meyer J, Huddart R, Smith K, Townsend R, Brown A, Antrobus R, Ammendola V, Naddeo M, O'Hara G, Willberg C, Harrison A, Grazioli F, Esposito ML, Siani L, Traboni C, Oo Y, Adams D, Hill A, Colloca S, Nicosia A, Cortese R, Klenerman P. Novel Adenovirus-Based vaccines induce broad and sustained T cell responses to HCV in man. Science Translational Medicine. 2012;4:115ra1. doi: 10.1126/scitranslmed.3003155. - DOI - PMC - PubMed
    1. Bektas A, Schurman SH, Gonzalez-Freire M, Dunn CA, Singh AK, Macian F, Cuervo AM, Sen R, Ferrucci L. Age-associated changes in human CD4+ T cells point to mitochondrial dysfunction consequent to impaired autophagy. Aging. 2019;11:9234–9263. doi: 10.18632/aging.102438. - DOI - PMC - PubMed
    1. Callender LA, Carroll EC, Bober EA, Akbar AN, Solito E, Henson SM. Mitochondrial mass governs the extent of human T cell senescence. Aging Cell. 2020;19:e13067. doi: 10.1111/acel.13067. - DOI - PMC - PubMed
    1. Chen WH, Kozlovsky BF, Effros RB, Grubeck-Loebenstein B, Edelman R, Sztein MB. Vaccination in the elderly: an immunological perspective. Trends in Immunology. 2009;30:351–359. doi: 10.1016/j.it.2009.05.002. - DOI - PMC - PubMed

Publication types

MeSH terms

Associated data