. 2021 May;11(5):1158-1175.
doi: 10.1158/2159-8290.CD-20-0735. Epub 2020 Dec 14.

SWI/SNF Complex Mutations Promote Thyroid Tumor Progression and Insensitivity to Redifferentiation Therapies

Affiliations

SWI/SNF Complex Mutations Promote Thyroid Tumor Progression and Insensitivity to Redifferentiation Therapies

Mahesh Saqcena et al. Cancer Discov. 2021 May.

Abstract

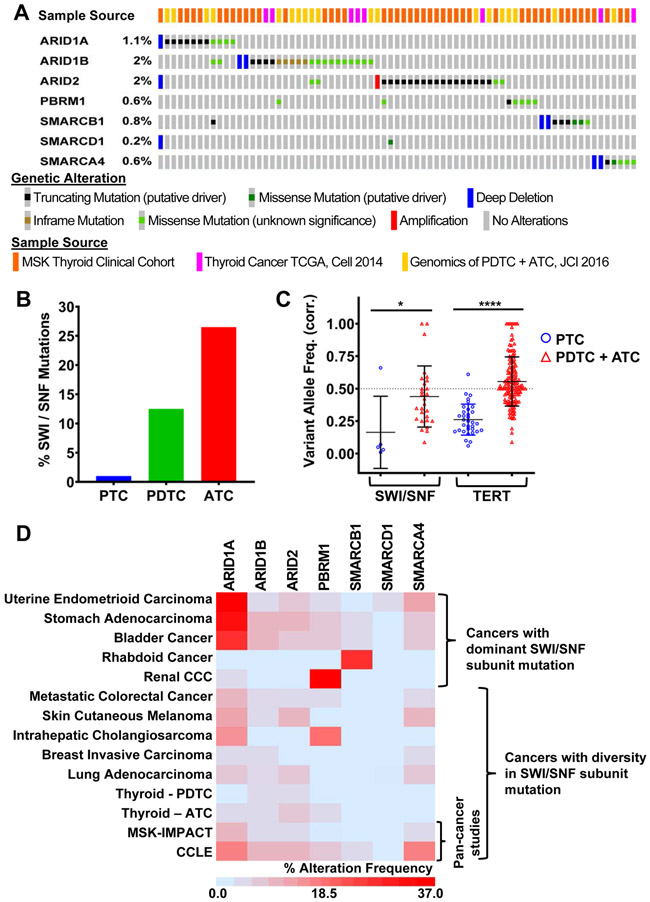
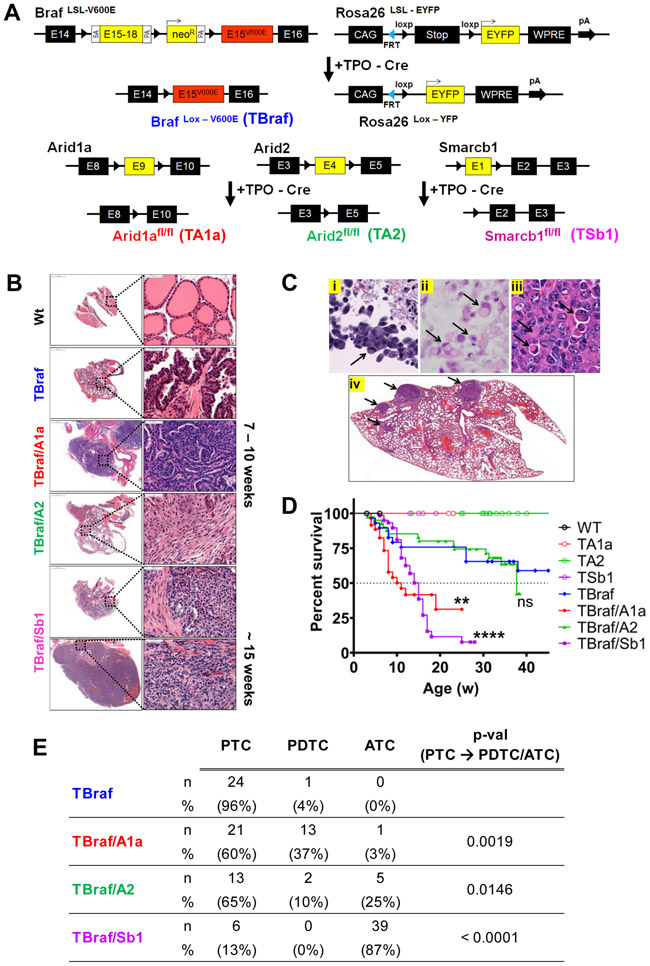
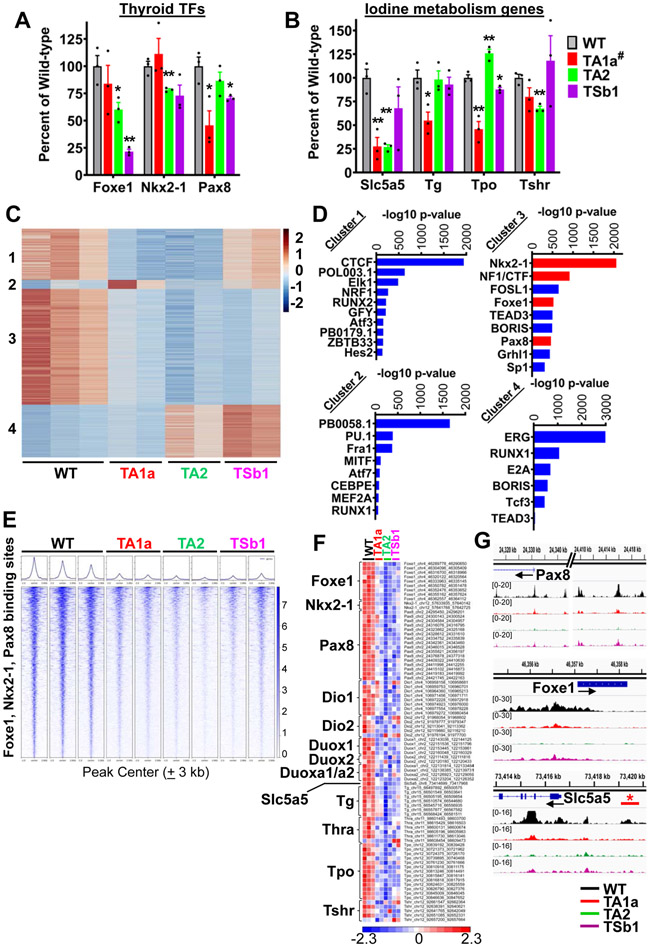
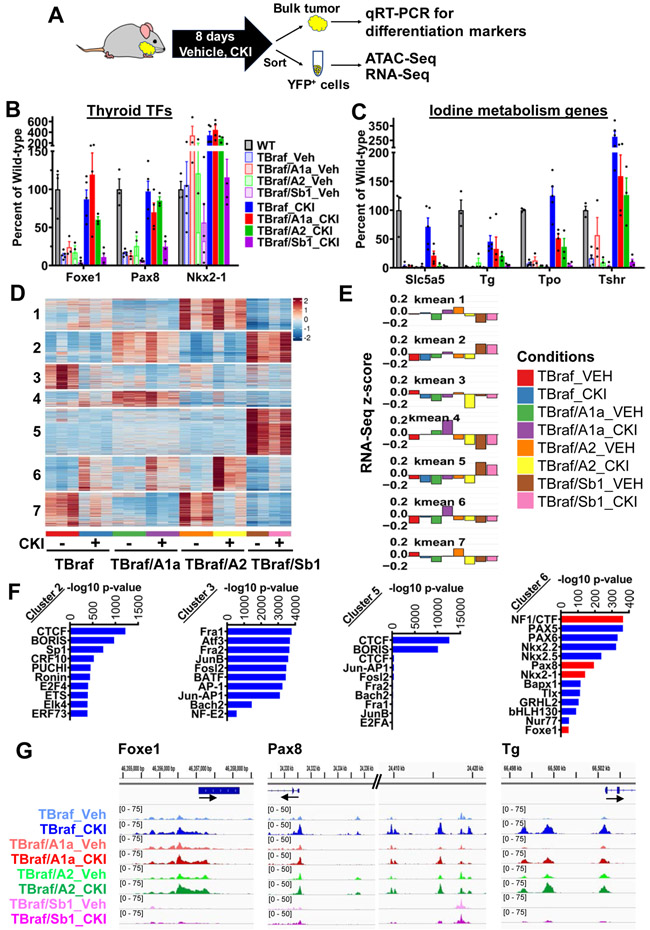
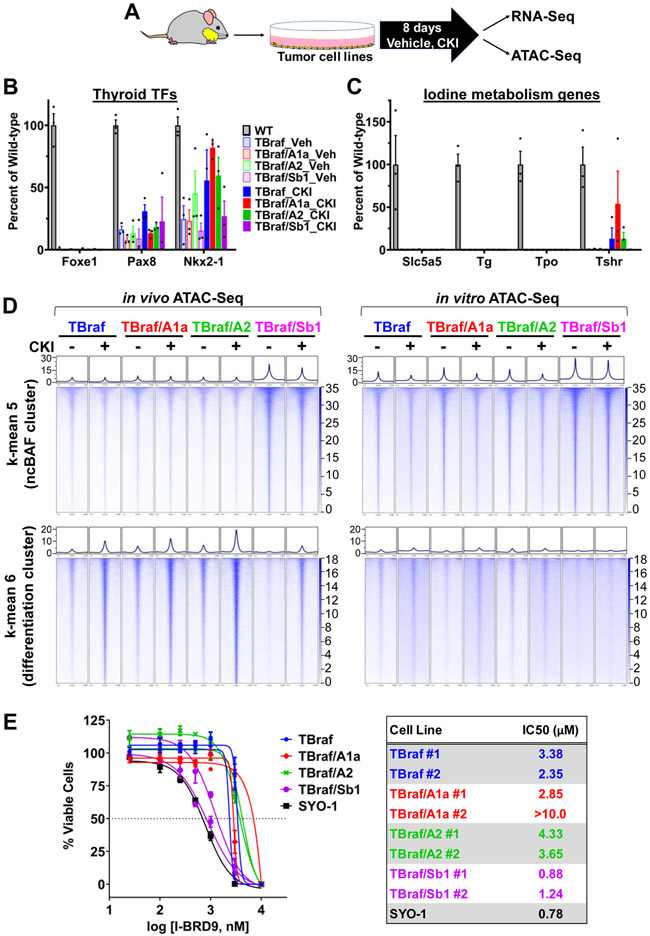
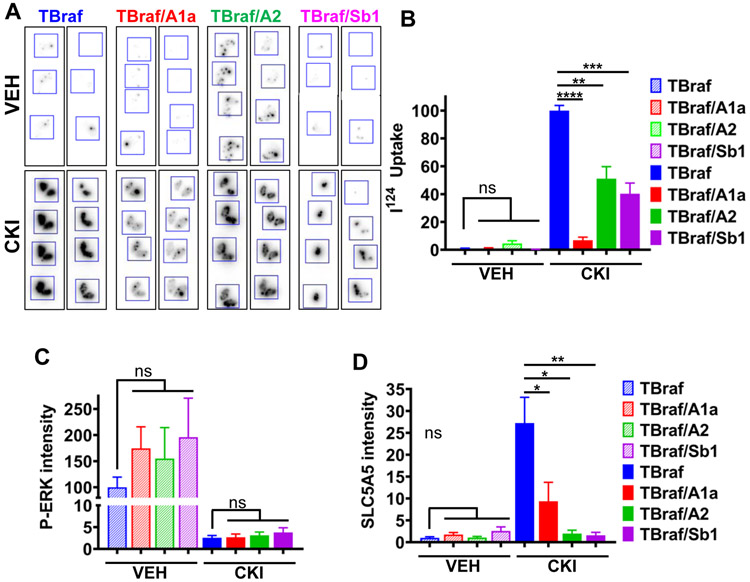
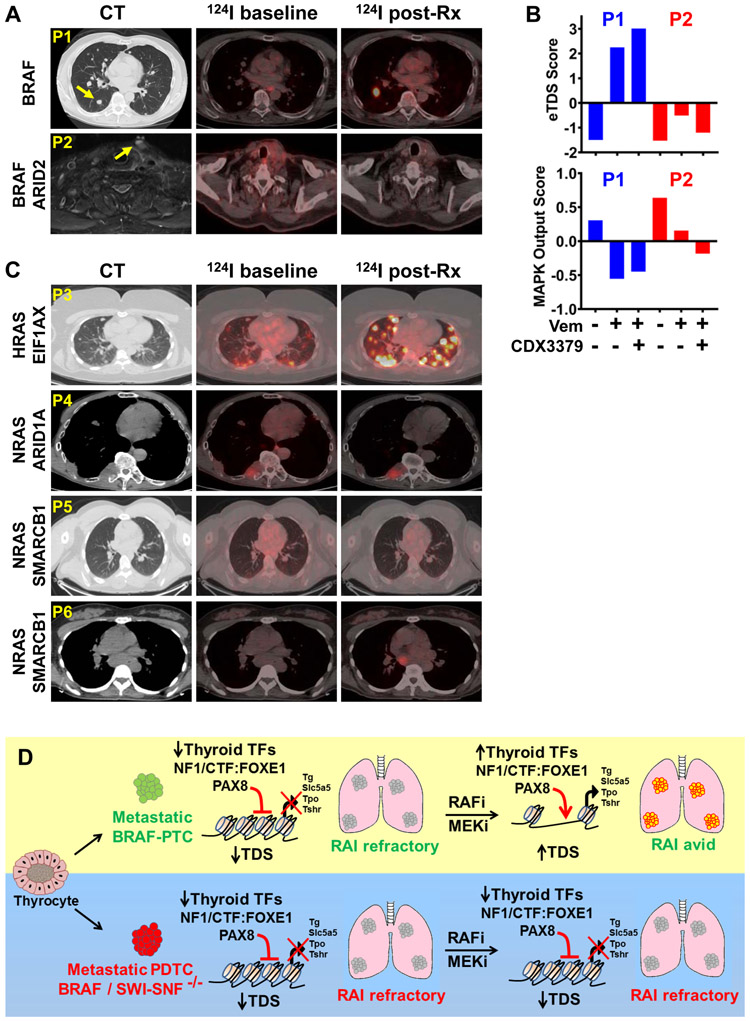
Mutations of subunits of the SWI/SNF chromatin remodeling complexes occur commonly in cancers of different lineages, including advanced thyroid cancers. Here we show that thyroid-specific loss of Arid1a, Arid2, or Smarcb1 in mouse BRAFV600E-mutant tumors promotes disease progression and decreased survival, associated with lesion-specific effects on chromatin accessibility and differentiation. As compared with normal thyrocytes, BRAFV600E-mutant mouse papillary thyroid cancers have decreased lineage transcription factor expression and accessibility to their target DNA binding sites, leading to impairment of thyroid-differentiated gene expression and radioiodine incorporation, which is rescued by MAPK inhibition. Loss of individual SWI/SNF subunits in BRAF tumors leads to a repressive chromatin state that cannot be reversed by MAPK pathway blockade, rendering them insensitive to its redifferentiation effects. Our results show that SWI/SNF complexes are central to the maintenance of differentiated function in thyroid cancers, and their loss confers radioiodine refractoriness and resistance to MAPK inhibitor-based redifferentiation therapies. SIGNIFICANCE: Reprogramming cancer differentiation confers therapeutic benefit in various disease contexts. Oncogenic BRAF silences genes required for radioiodine responsiveness in thyroid cancer. Mutations in SWI/SNF genes result in loss of chromatin accessibility at thyroid lineage specification genes in BRAF-mutant thyroid tumors, rendering them insensitive to the redifferentiation effects of MAPK blockade.This article is highlighted in the In This Issue feature, p. 995.


Conflict of interest statement

Conflict of interest

JAF: Consultant, Loxo Oncology. Grant support, Eisai Pharmaceuticals.

ALH: Research Funding (Clinical trials): AstraZeneca, Novartis, Eisai Pharmaceuticals, Genentech-Roche, Bayer, Celldex (previously Koltan). Advisory Board: AstraZeneca, Eisai Pharmaceuticals, Sanofi Genzyme, Novartis, Genentech-Roche.

Figures

Figure 1:
Figure 1:. Mutations of SWI/SNF subunit genes are associated with thyroid tumor progression.
(A) Oncoprint of SWI/SNF subunit mutations in human thyroid cancers. The color- coded bars in the top row represent the data study source for each sample. Tissues from the MSK clinical cohort and from Landa et al. (10) were sequenced by MSK-IMPACT. TCGA genotyping was by WES (9). (B) Frequency of SWI/SNF mutations in human papillary (PTC), poorly-differentiated (PDTC), and anaplastic thyroid cancer (ATC). (C) Clonality of SWI/SNF mutations in PTC vs PDTC/ATC. (D) Frequency of SWI/SNF mutations in different cancer types. Unlike renal and rhabdoid cancers that predominantly harbor a distinct SWI/SNF subunit mutation, thyroid (ATC) and some other cancers have mutations in diverse SWI/SNF subunits.
Figure 2:
Figure 2:. Modeling Swi/Snf loss in genetically engineered mouse models with endogenous BrafV600E expression.
(A) Schema of mouse models: Thyroid-specific expression of Cre recombinase driven by Tpo-Cre substitutes exon 15 of wild type Braf by a mutant allele, resulting in endogenous expression of BrafV600E (82). Cre-excision of stop cassette also enables YFP expression in thyroid cells. E9 of Arid1a, E4 of Arid2, and E1 of Smarcb1 are floxed to inactivate the respective alleles. (B) Representative H&E-stained thyroid sections of Wt, TBraf, and compound TBraf mice with homozygous A1a, A2, or Sb1 loss. TBraf mice develop classical PTC, whereas TBraf/A1a and TBrafA2 have PDTC-like histology. TBraf/Sb1 mice develop ATC at 15 weeks with spindle cells, irregular nuclei, and areas of necrosis. (C) i-iv: Rhabdoid cells (arrows) in (i) human sinonasal carcinoma and (ii) human ATC with SMARCB1 loss, and (iii) mouse TBraf/Sb1 thyroid tumor. (iv) TBraf/Sb1 mice exhibit frequent lung metastases (arrows). (D) Kaplan-Meier survival analysis for mice with the indicated genotypes. TBraf/A1a and TBraf/Sb1 mice had median survival of 11 and 15 weeks, with a log-rank p-value of 0.0043 and <0.0001, respectively. (E) Histological classification of tumors obtained from mice with the indicated genotypes. p-values for PTC vs PDTC/ATC in TBraf vs compound TBraf with homozygous A1a, A2, or Sb1 loss were calculated using Fisher’s exact test.
Figure 3:
Figure 3:. Swi/Snf loss downregulates expression and decreases chromatin accessibility of thyroid differentiation genes.
Thyroid tissue lineage transcription factor (A) and iodine metabolism (B) gene expression in homozygous A1a, A2 and Sb1 knockout mice by RNAseq as compared to WT. #Due to incomplete recombination of the floxed Arid1a allele in TA1a mice, RNAseq was performed in YFP+-sorted compared to WT YFP+ cells (n=3 per group; Mean ± SEM; Student's t-test, * P ≤ 0.05; ** P ≤ 0.01 vs WT). (C) Unsupervised k-means clustering of ATAC-seq peak gains (red) and losses (blue) in the indicated genotypes (n = 3 biological replicates for WT, and 2 each per TA1a, TA2 and TSb1). Four groups are noted by unsupervised k-means clustering. (D) TF motifs enriched in specific clusters identified using HOMER de novo motif discovery. Thyroid lineage TF motif enrichments are indicated as red bars in cluster 3. (E) Tornado plots of ATAC-seq signals representing 1592 sites around the Foxe1, Nkx2-1 and Pax8 binding sites sorted by log2 fold change (± 3 kb of the peak center). (F) Heatmap of chromatin accessibility at the indicated thyroid differentiation genes. (G) Representative IGV plots showing ATAC-seq peak losses at key thyroid lineage TFs: Pax8 and Foxe1 at putative enhancer and promoter regions; Nis proximal promoter and upstream enhancer elements [* marks confirmed Nis enhancer (47)].
Figure 4:
Figure 4:. Braf-mutant thyroid tumors with Swi/Snf loss are refractory to the redifferentiation effects of MEK inhibition.
(A) Mice were treated with the MEK inhibitor CKI for 8 days, and bulk thyroids collected for qRT-PCR of thyroid differentiation markers or disaggregated and YFP-sorted for ATAC-Seq and RNA-Seq profiling. (B) Quantitative RT-PCR of lineage transcription factors and of (C) iodine metabolism genes (n ≥ 3/group; Mean ± SEM). (D) Unsupervised k-means clustering analysis of differential ATAC-Seq peaks of YFP-sorted thyroid tumors treated with or without CKI (n=3 for Vehicle and CKI-treated TBraf, TBraf/A1a, TBraf/A2; n=2 for TBraf/Sb1). (E) RNA-seq mean z-score of the genes present in each of the 7 ATAC-seq k-means clusters (p-values for ATAC-seq to RNA-seq concordance are shown in Supplementary Table S2). (F) TF motifs enriched in clusters 2, 3, 5 and 6 identified using known sequence motifs curated by the HOMER suite. Thyroid lineage TF motif enrichments are indicated as red bars in cluster 6. TF motif enrichments for clusters 1, 4 and 7 are shown in Supplementary Fig. S7B. (G) ATAC-seq IGV plots of the indicated genotypes treated with or without CKI.
Figure 5:
Figure 5:. Response of mouse thyroid cancer cell lines to MAPK and BRD9 inhibitors:
(A) Three thyroid tumor cell lines derived from each of the mouse genotypes were treated with 300 nM CKI for 8 days in the presence of bovine TSH, after which cells were harvested for RNA-seq or ATAC-seq. (B) Expression of thyroid lineage TFs and (C) iodine metabolism genes in TBraf, TBraf/A1a, TBraf/A2, and TBraf/Sb1 cell lines compared to normal thyroid tissue (each dot represents an independent thyroid tumor cell line; n = 3; Mean ± SEM). (D) Tornado plots of averaged ATAC-seq signals ±3 kb of peak center in cell lines treated with or without CKI for genes in cluster 5 (top right, 17157 sites) and cluster 6 (bottom right, 12618 sites) compared to the ATAC-seq signals in vivo (top left and bottom left for clusters 5 and 6, respectively). (E) CellTiter-Glo cell viability assay in the indicated panel of cell lines treated with BRD9 bromodomain inhibitor I-BRD9 for 6 days (n=3, Mean ± SD); IC50 values are shown on the right.
Figure 6:
Figure 6:. Swi/Snf loss prevents restoration of RAI uptake by the MEK inhibitor CKI.
(A) Representative autoradiograms of thyroid cancer tissue sections of mice with the indicated genotypes treated with or without CKI for 8d. At day 5 they received 70 μCi of 124I by gavage. (B) 124I uptake quantified using ImageJ. (C,D) Quantification of immunofluorescence staining for pERK (C) and SLC5A5 (D). n≥3; mean ± SEM.* p ≤ 0.05; ** p ≤ 0.01; *** p ≤ 0.001; **** p ≤ 0.0001; Student's t-test.
Figure 7:
Figure 7:. Thyroid cancers with ARID1A, ARID2, or SMARCB1 mutations are resistant to redifferentiation by MAPK pathway inhibitors.
(A) Axial CT (left) and fused 124I-PET-CT chest images (middle and right) of 2 thyroid cancer patients (P1 and P2) with RAI-refractory metastatic thyroid cancer treated for 4 weeks with vemurafenib combined with the HER3 monoclonal antibody CDX-3379. Baseline 124I-PET-CT was performed prior to drug exposure; On Rx 124I-PET-CT was done while on the drug combination. P1 harbored a BRAFV600E-mutant tall cell variant PTC and showed restoration of 124I uptake in previously negative metastatic lesions. P2 harbored a BRAF and ARID2-mutant PDTC that failed to incorporate 124I after Vem + CDX-3379. (B) Enhanced thyroid differentiation (eTDS) and MAPK output scores in RNAseq of 3 serial biopsies of the index lesions (arrows) in P1 (responder) and P2 (non-responder). Bars represent the eTDS and MAPK scores prior to treatment, on vemurafenib alone, and after adding CDX-3379. (C) Axial CT and fused 124I-PET-CT chest images of patients enrolled in a redifferentiation trial with the MEK inhibitor trametinib. P3 harbored a RAS-mutant PTC that showed restoration of 124I uptake with trametinib, whereas patients P4 (RAS + ARID1A), P5 and P6 (RAS + SMARCB1) failed to enhance 124I uptake on trametinib. (D) Model depicting loss of chromatin accessibility at thyroid lineage genes and resistance to MAPK inhibitor-based redifferentiation in BRAFV600E-mutant thyroid cancers with SWI/SNF loss.

References

    1. Grignani F, Ferrucci PF, Testa U, Talamo G, Fagioli M, Alcalay M, et al. The acute promyelocytic leukemia-specific PML-RAR alpha fusion protein inhibits differentiation and promotes survival of myeloid precursor cells. Cell 1993;74(3):423–31 doi 10.1016/0092-8674(93)80044-f. - DOI - PubMed
    1. Stahl M, Tallman MS. Acute promyelocytic leukemia (APL): remaining challenges towards a cure for all. Leukemia Lymphoma 2019;60(13):3107–15 doi 10.1080/10428194.2019.1613540. - DOI - PMC - PubMed
    1. Ward PS, Patel J, Wise DR, Abdel-Wahab O, Bennett BD, Coller HA, et al. The Common Feature of Leukemia-Associated IDH1 and IDH2 Mutations Is a Neomorphic Enzyme Activity Converting alpha-Ketoglutarate to 2-Hydroxyglutarate. Cancer Cell 2010;17(3):225–34 doi 10.1016/j.ccr.2010.01.020. - DOI - PMC - PubMed
    1. Figueroa ME, Abdel-Wahab O, Lu C, Ward PS, Patel J, Shih A, et al. Leukemic IDH1 and IDH2 mutations result in a hypermethylation phenotype, disrupt TET2 function, and impair hematopoietic differentiation. Cancer Cell 2010;18(6):553–67 doi 10.1016/j.ccr.2010.11.015. - DOI - PMC - PubMed
    1. DiNardo CD, Stein EM, de Botton S, Roboz GJ, Altman JK, Mims AS, et al. Durable Remissions with Ivosidenib in IDH1-Mutated Relapsed or Refractory AML. The New England journal of medicine 2018;378(25):2386–98 doi 10.1056/NEJMoa1716984. - DOI - PubMed

Publication types

Substances