. 2021 Mar;11(3):714-735.
doi: 10.1158/2159-8290.CD-20-0873. Epub 2020 Dec 14.

Durable Suppression of Acquired MEK Inhibitor Resistance in Cancer by Sequestering MEK from ERK and Promoting Antitumor T-cell Immunity

Affiliations

Durable Suppression of Acquired MEK Inhibitor Resistance in Cancer by Sequestering MEK from ERK and Promoting Antitumor T-cell Immunity

Aayoung Hong et al. Cancer Discov. 2021 Mar.

Expression of concern in

Abstract

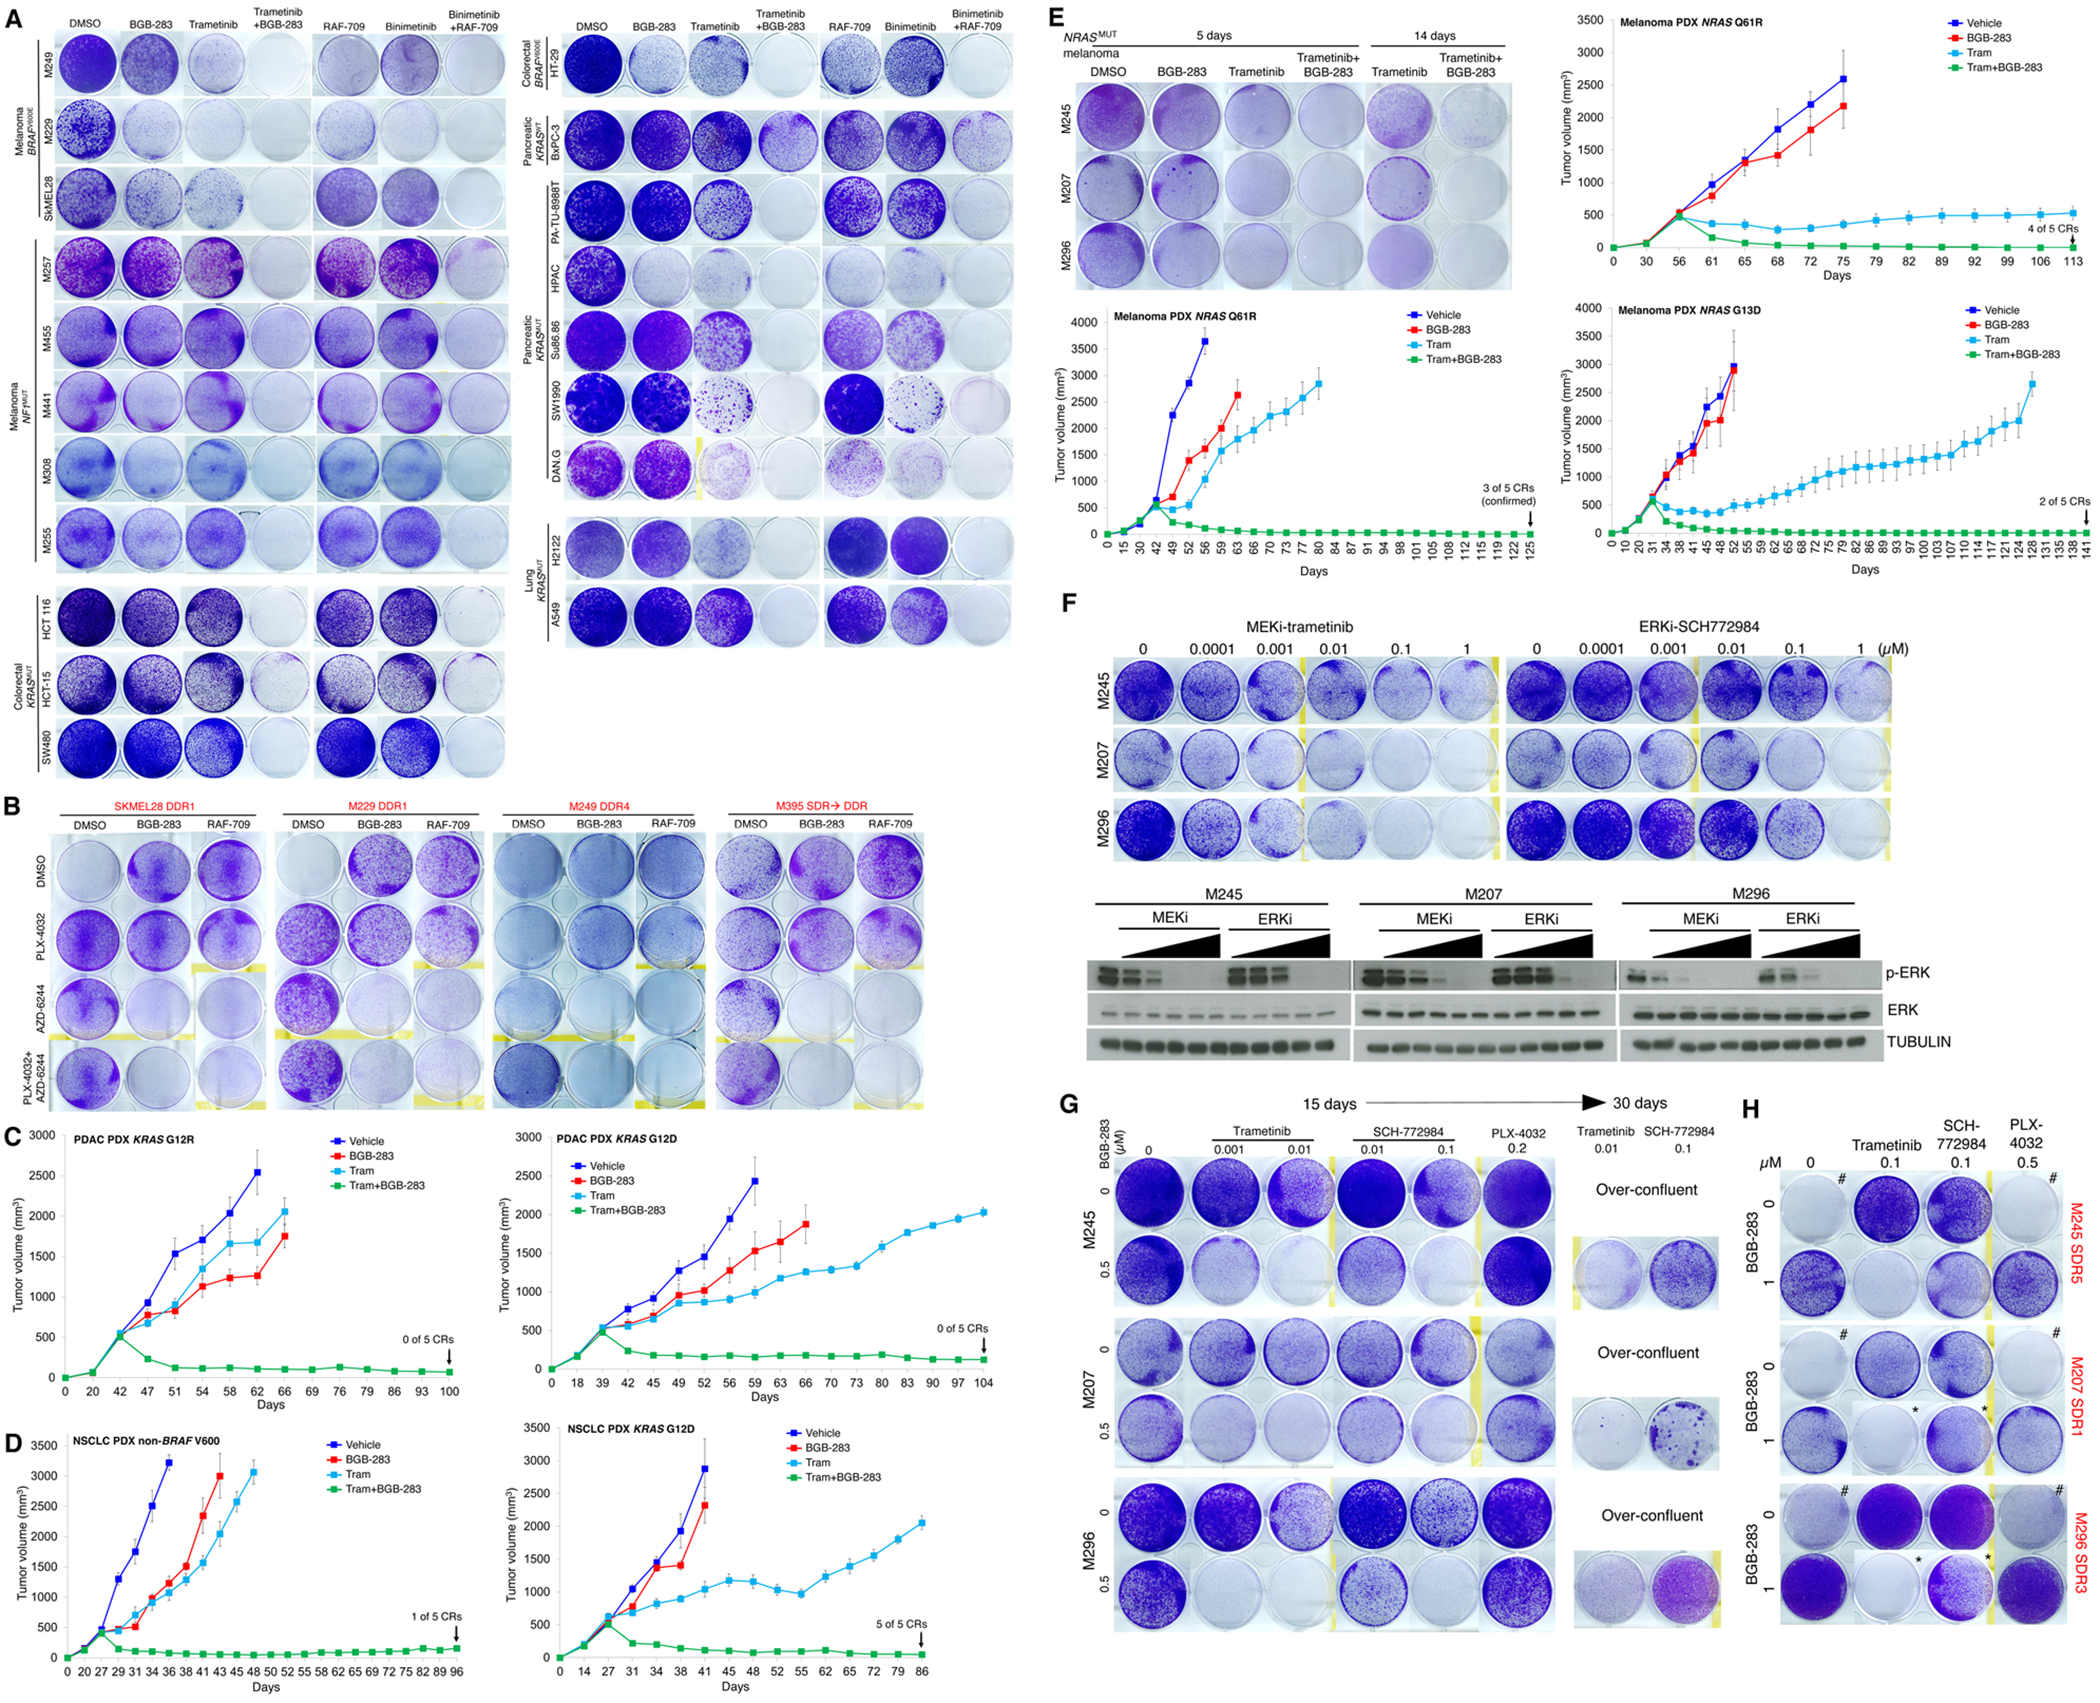
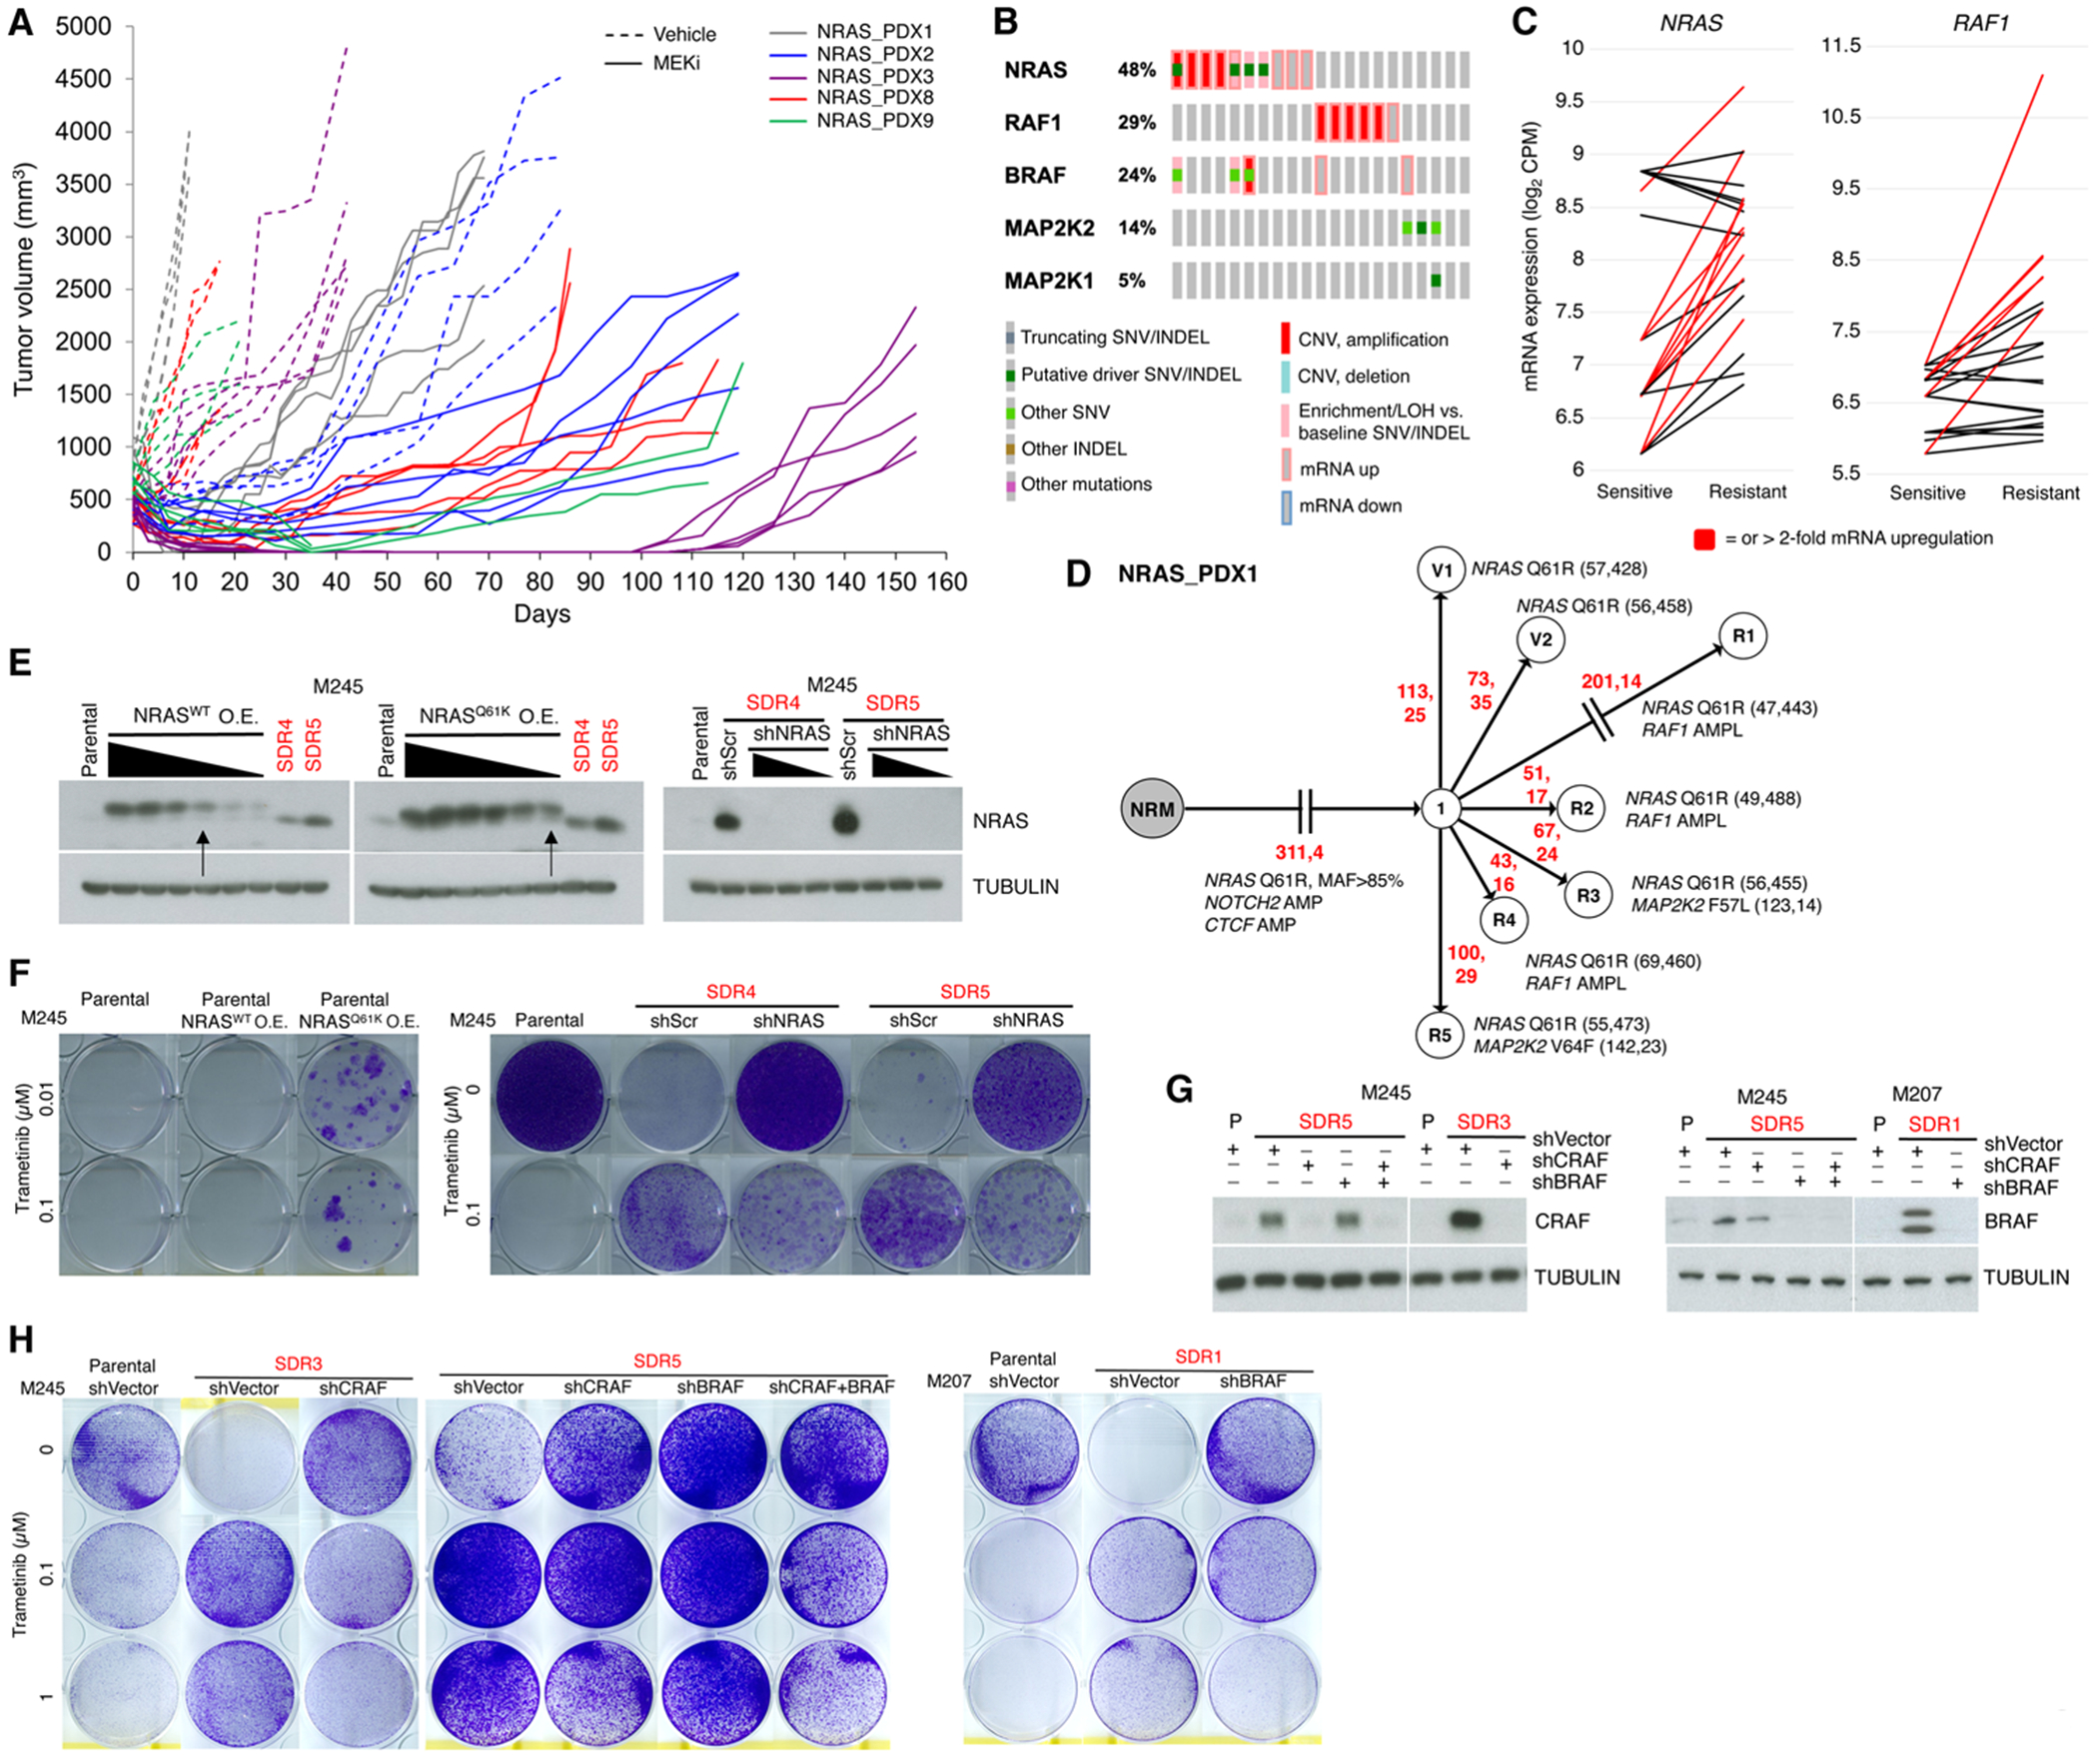
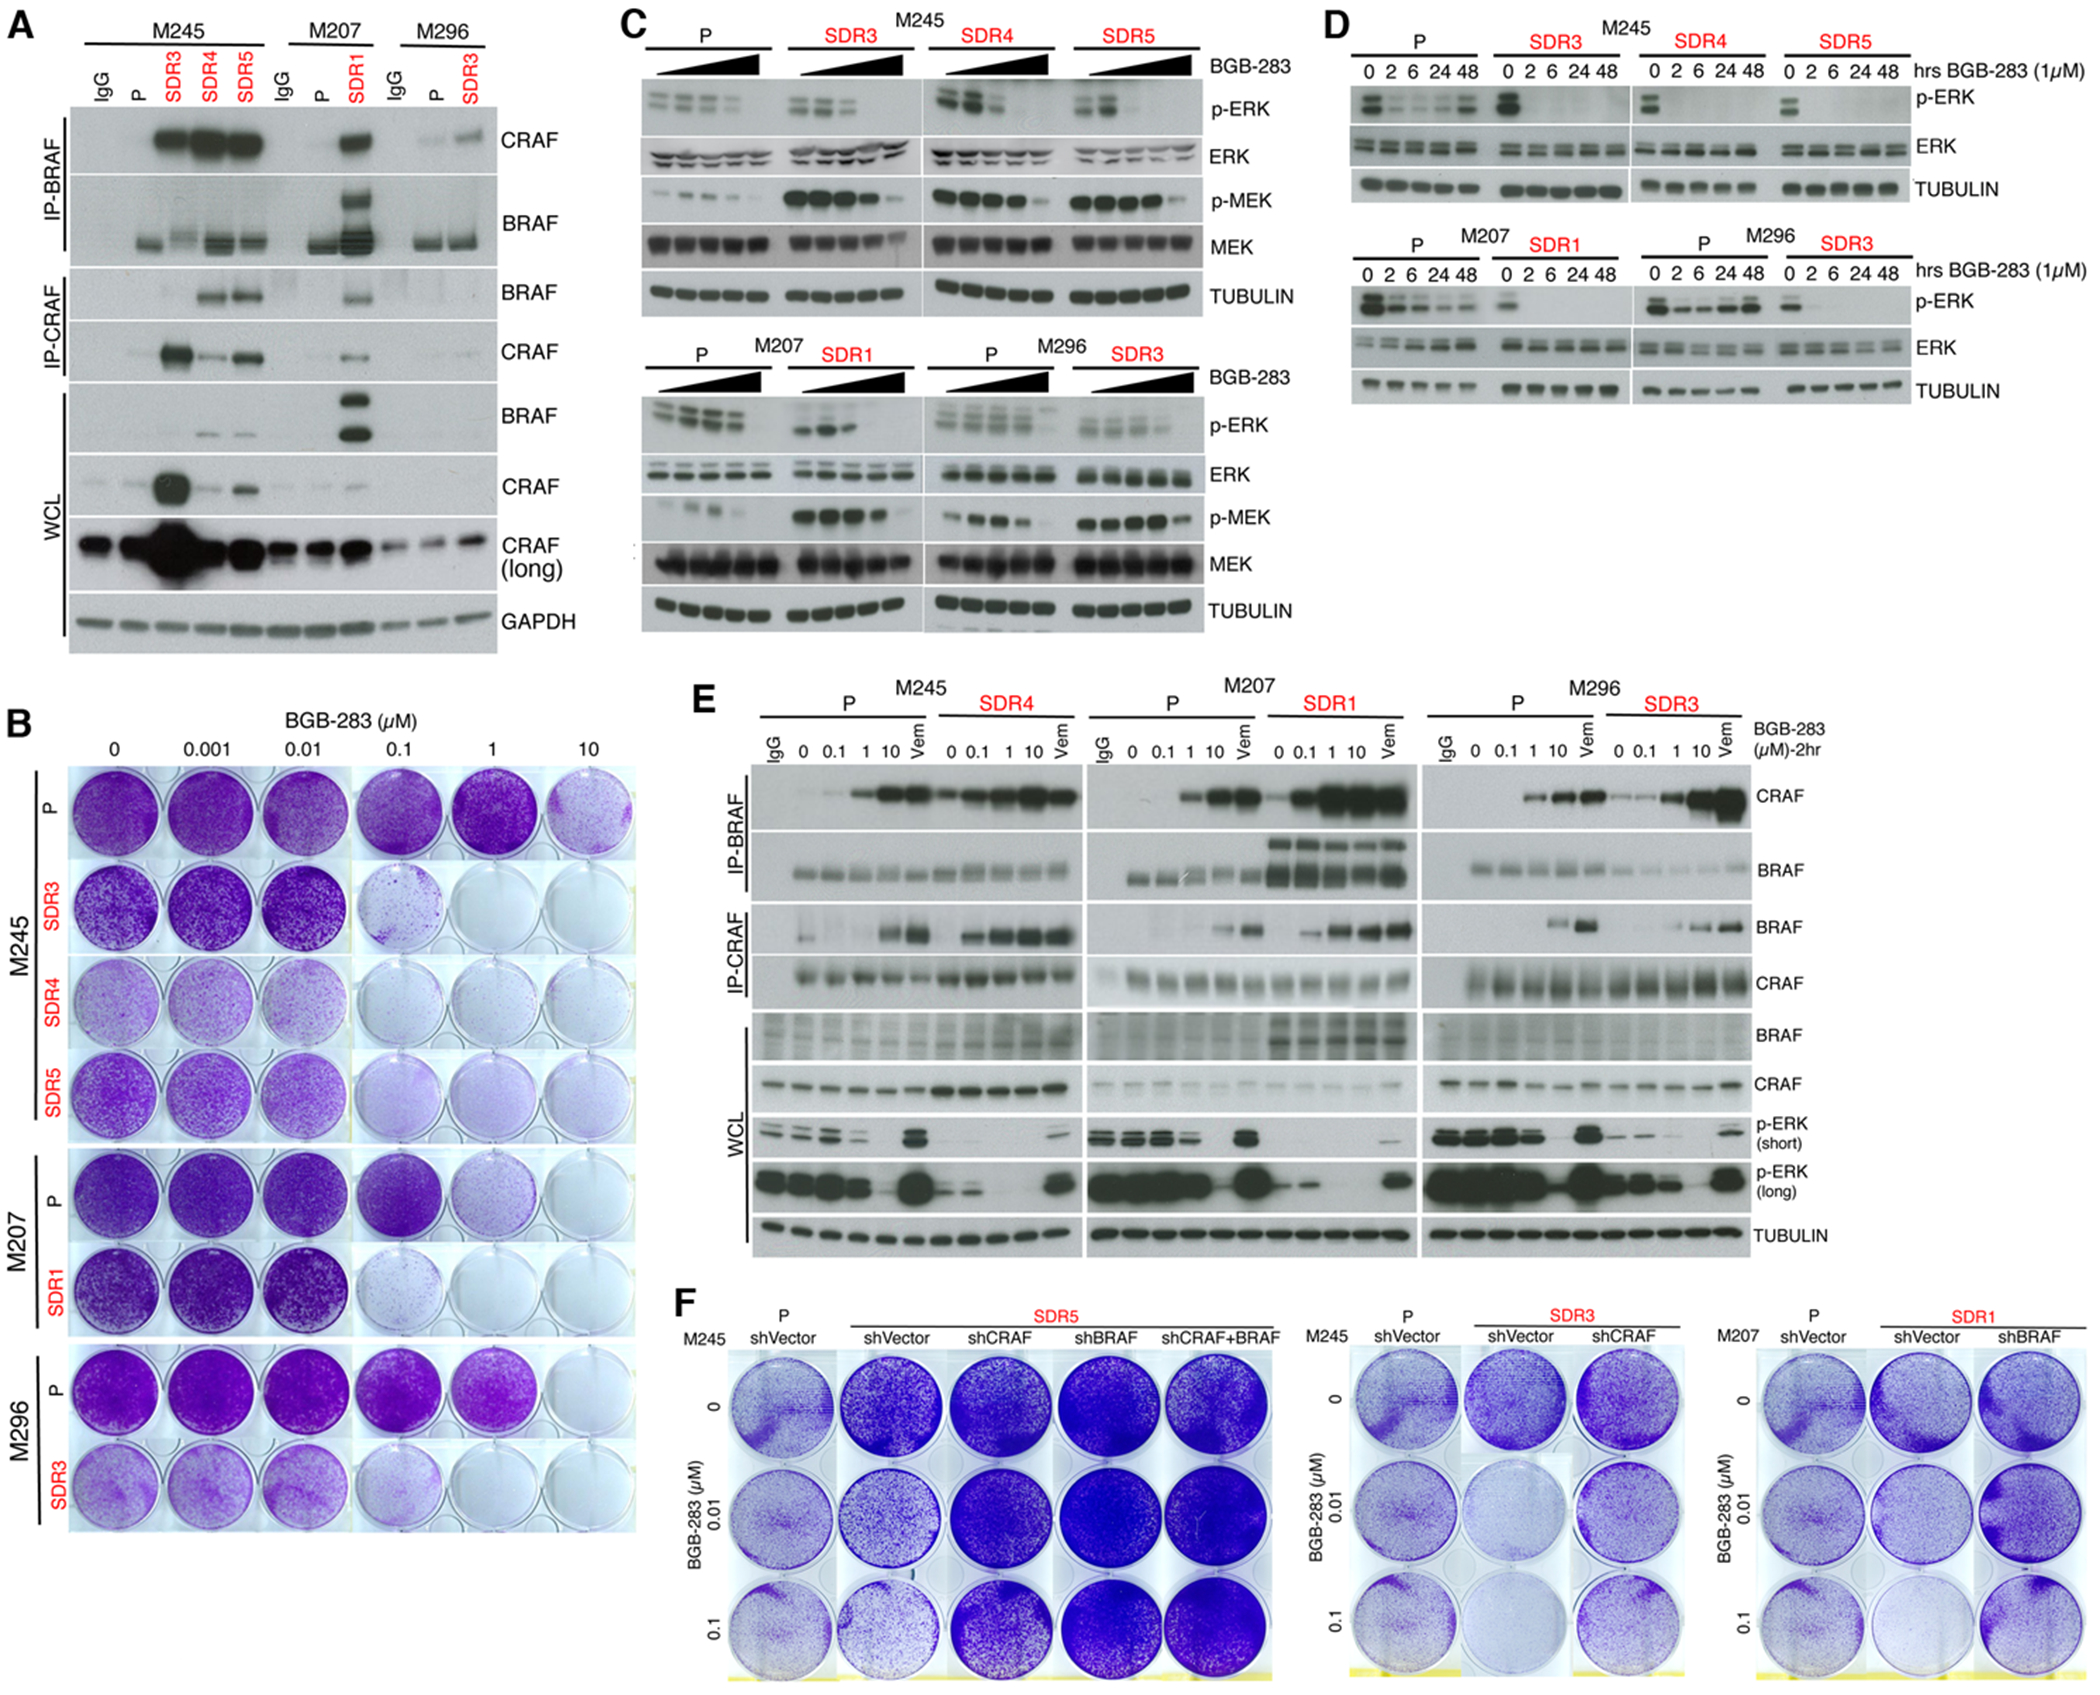
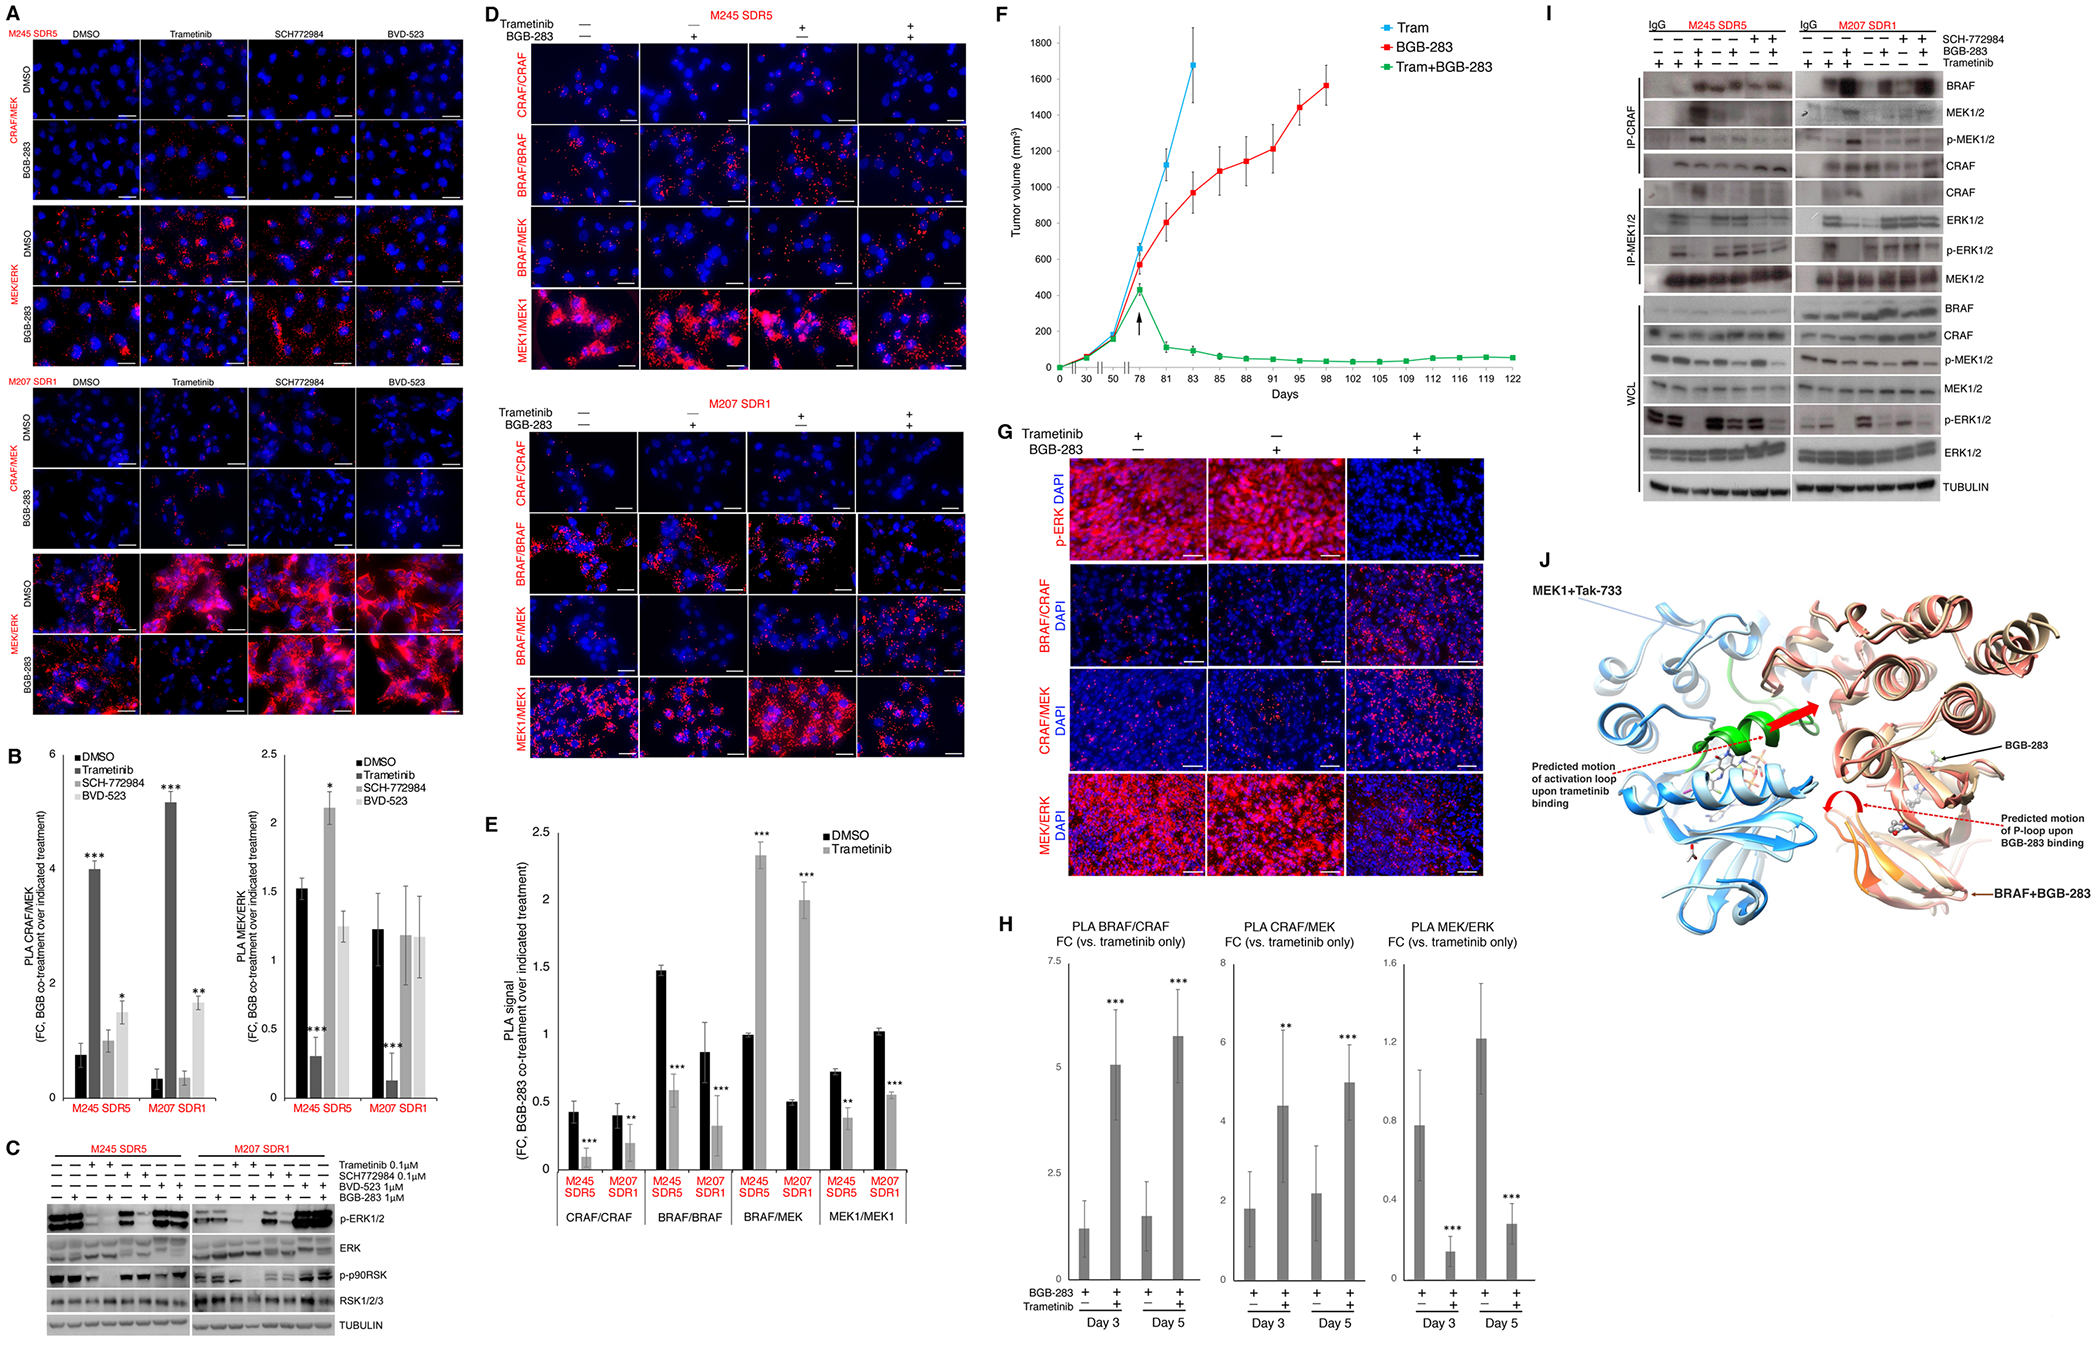
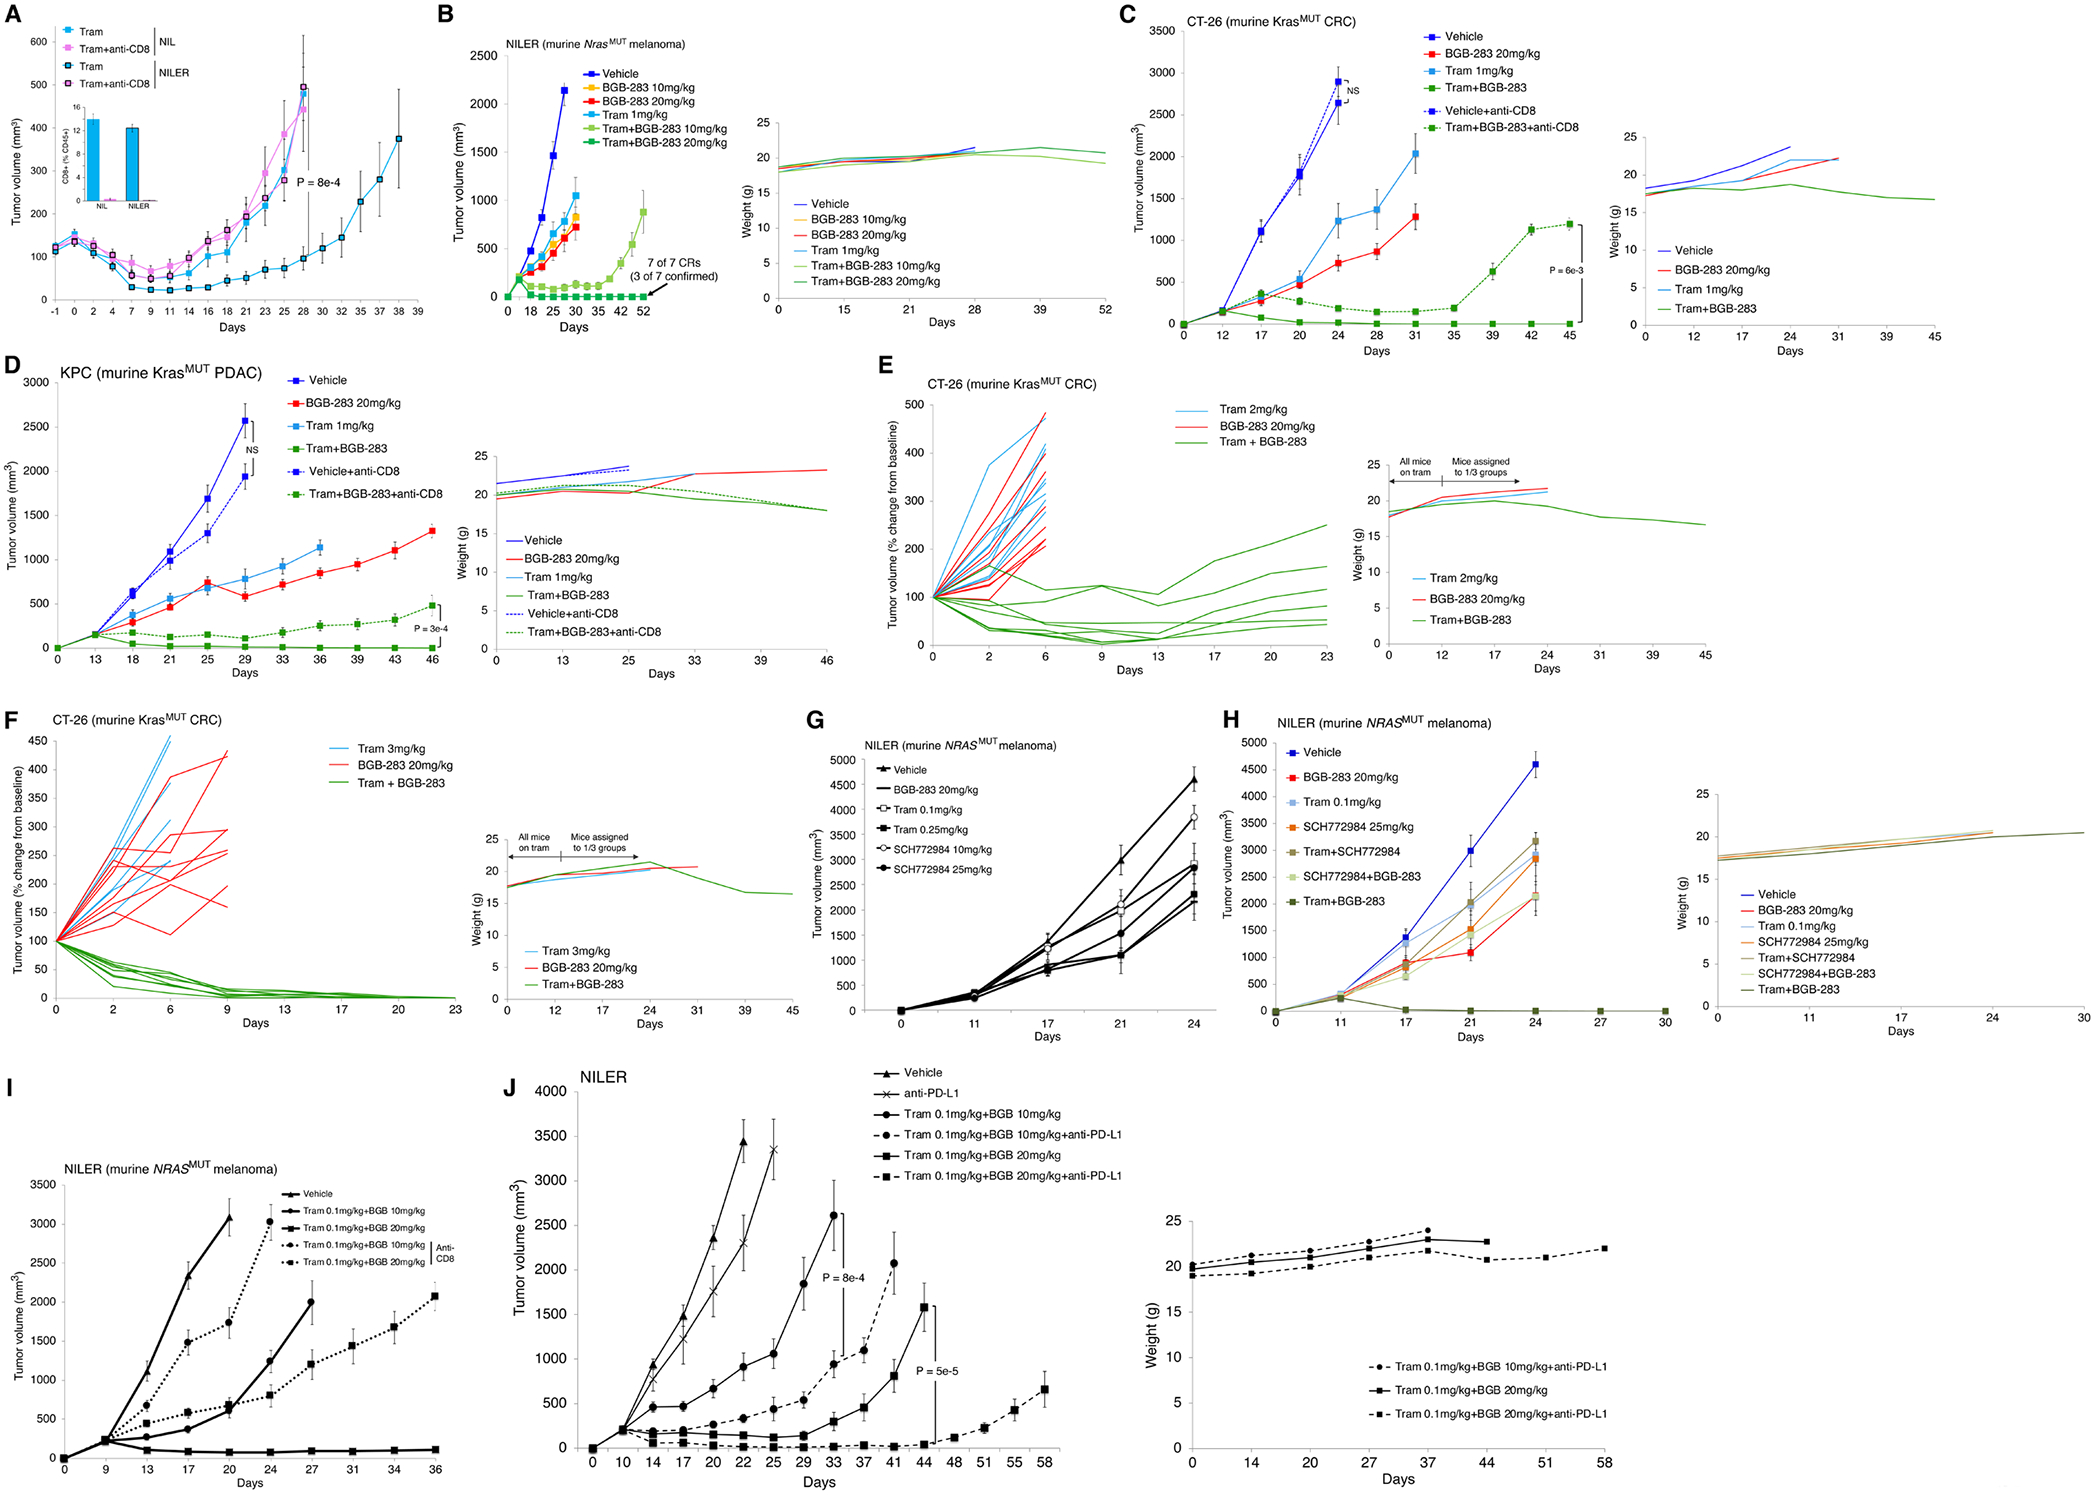
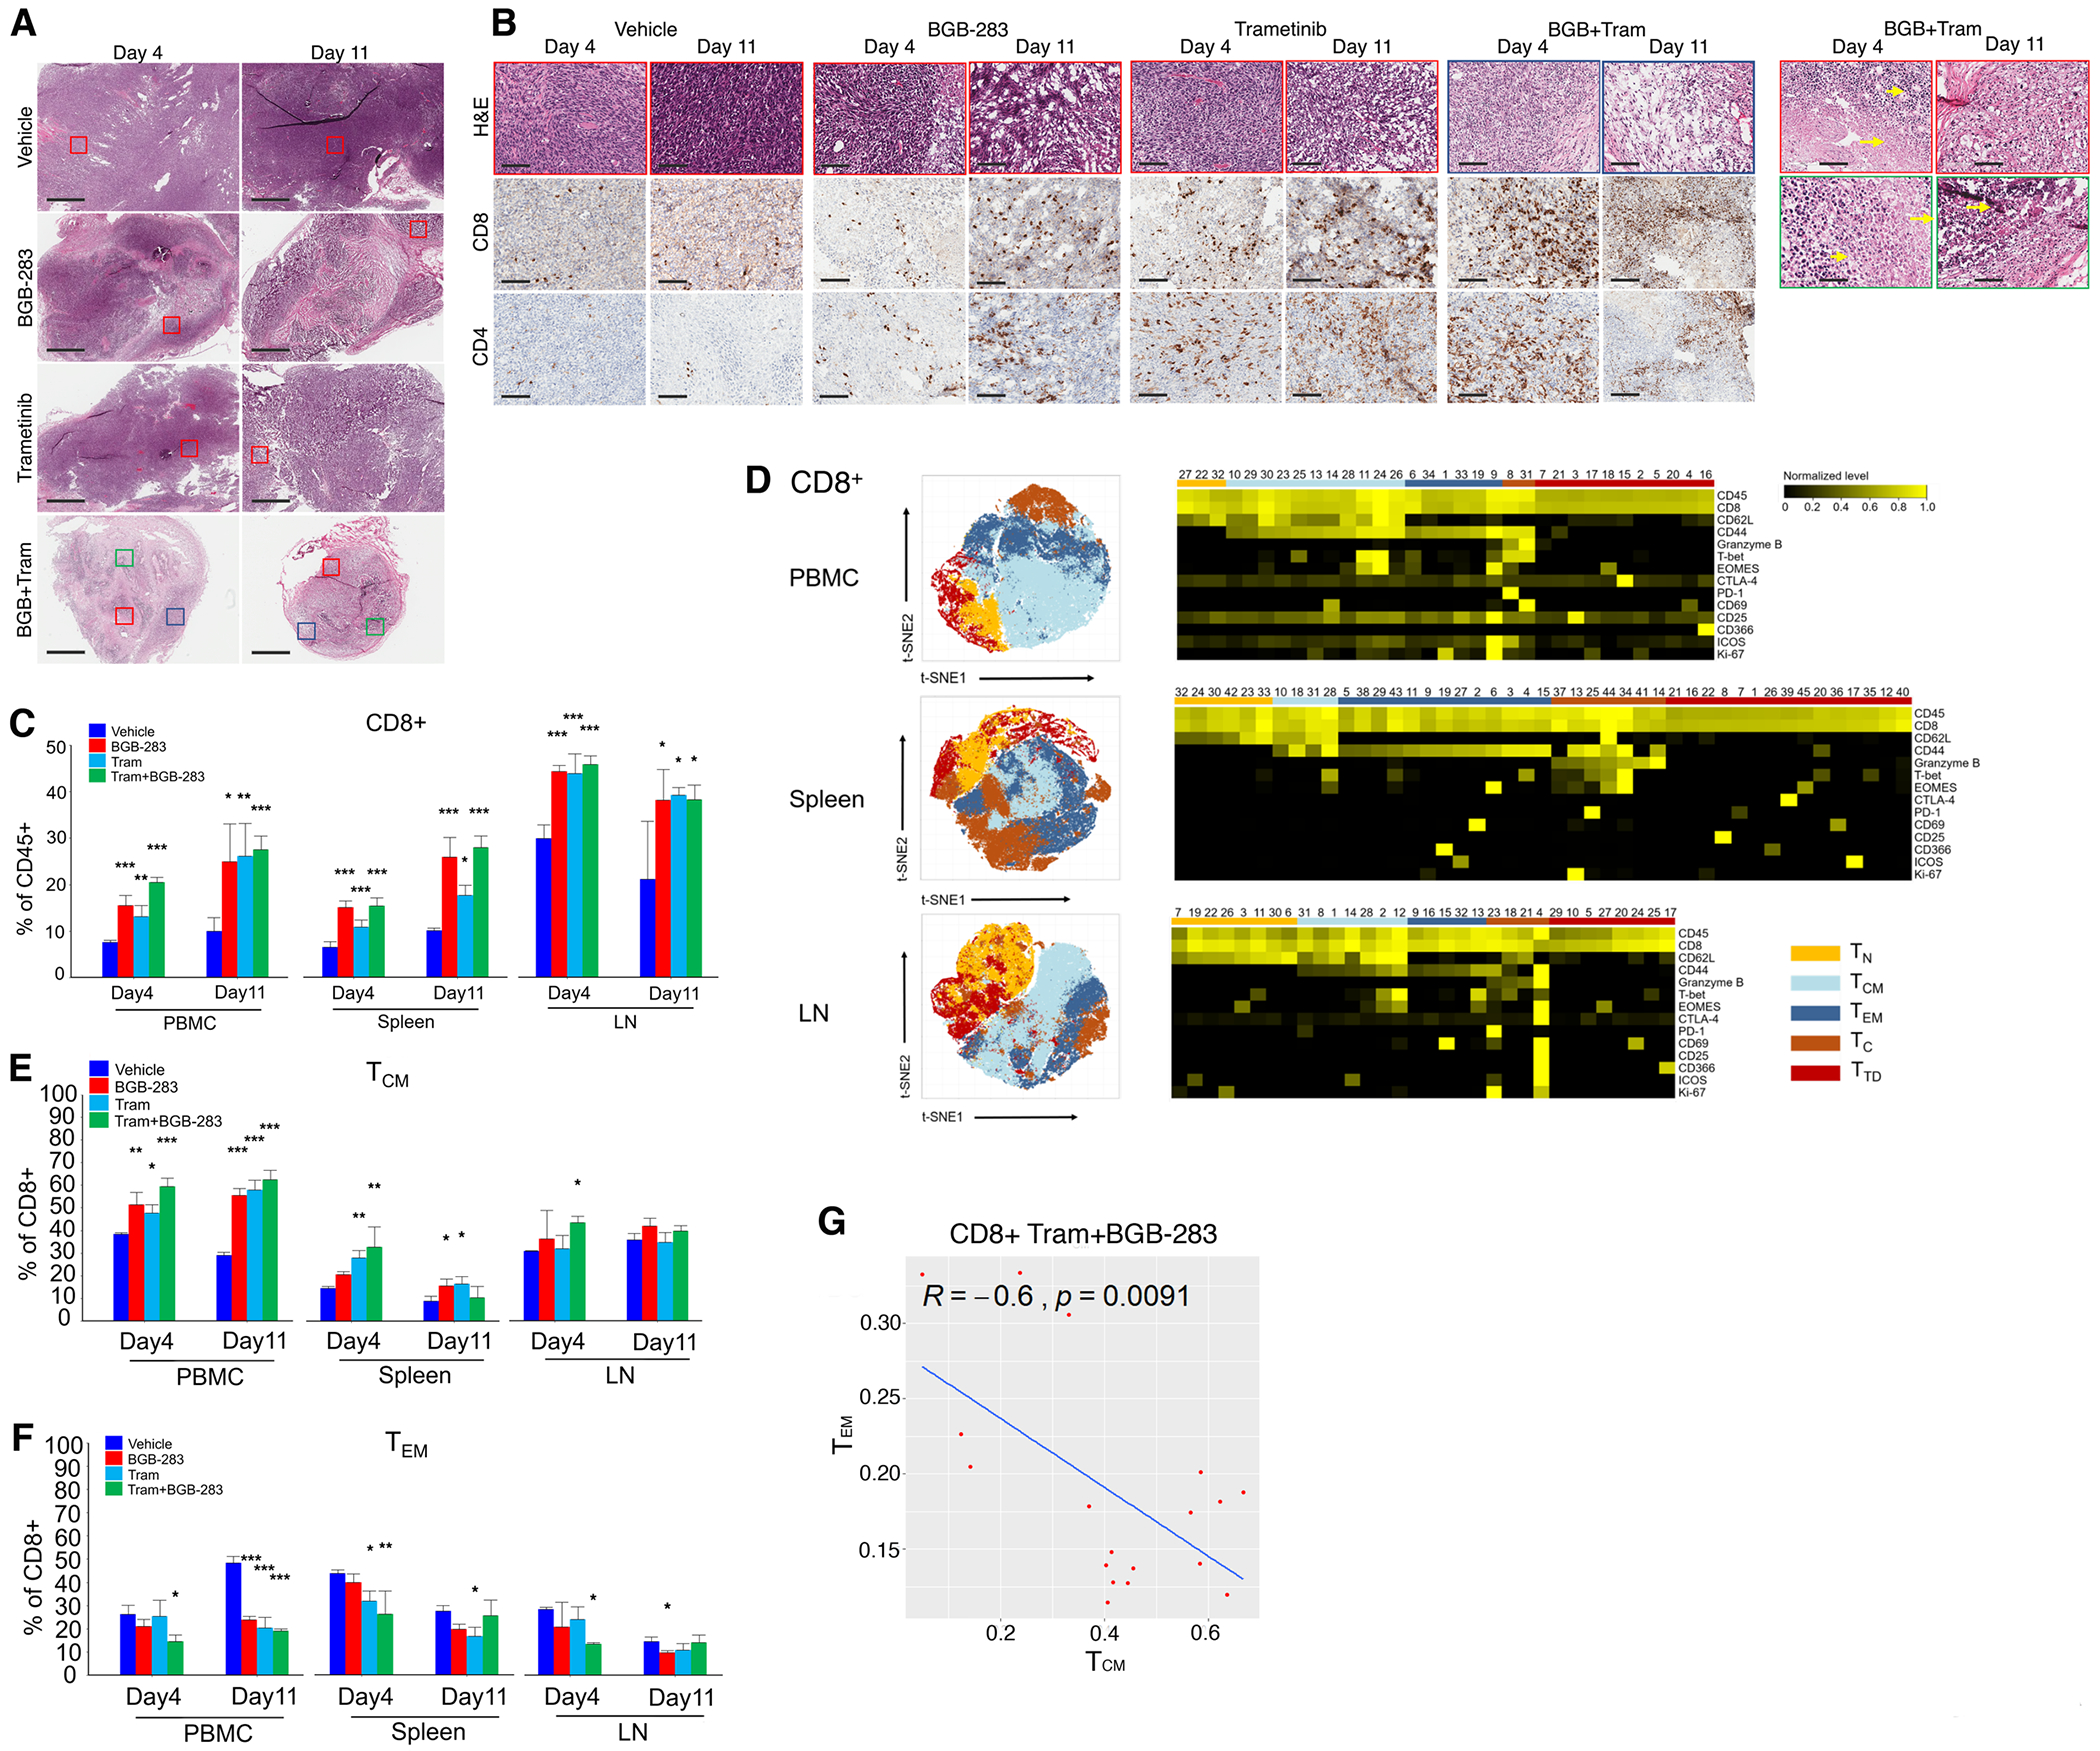
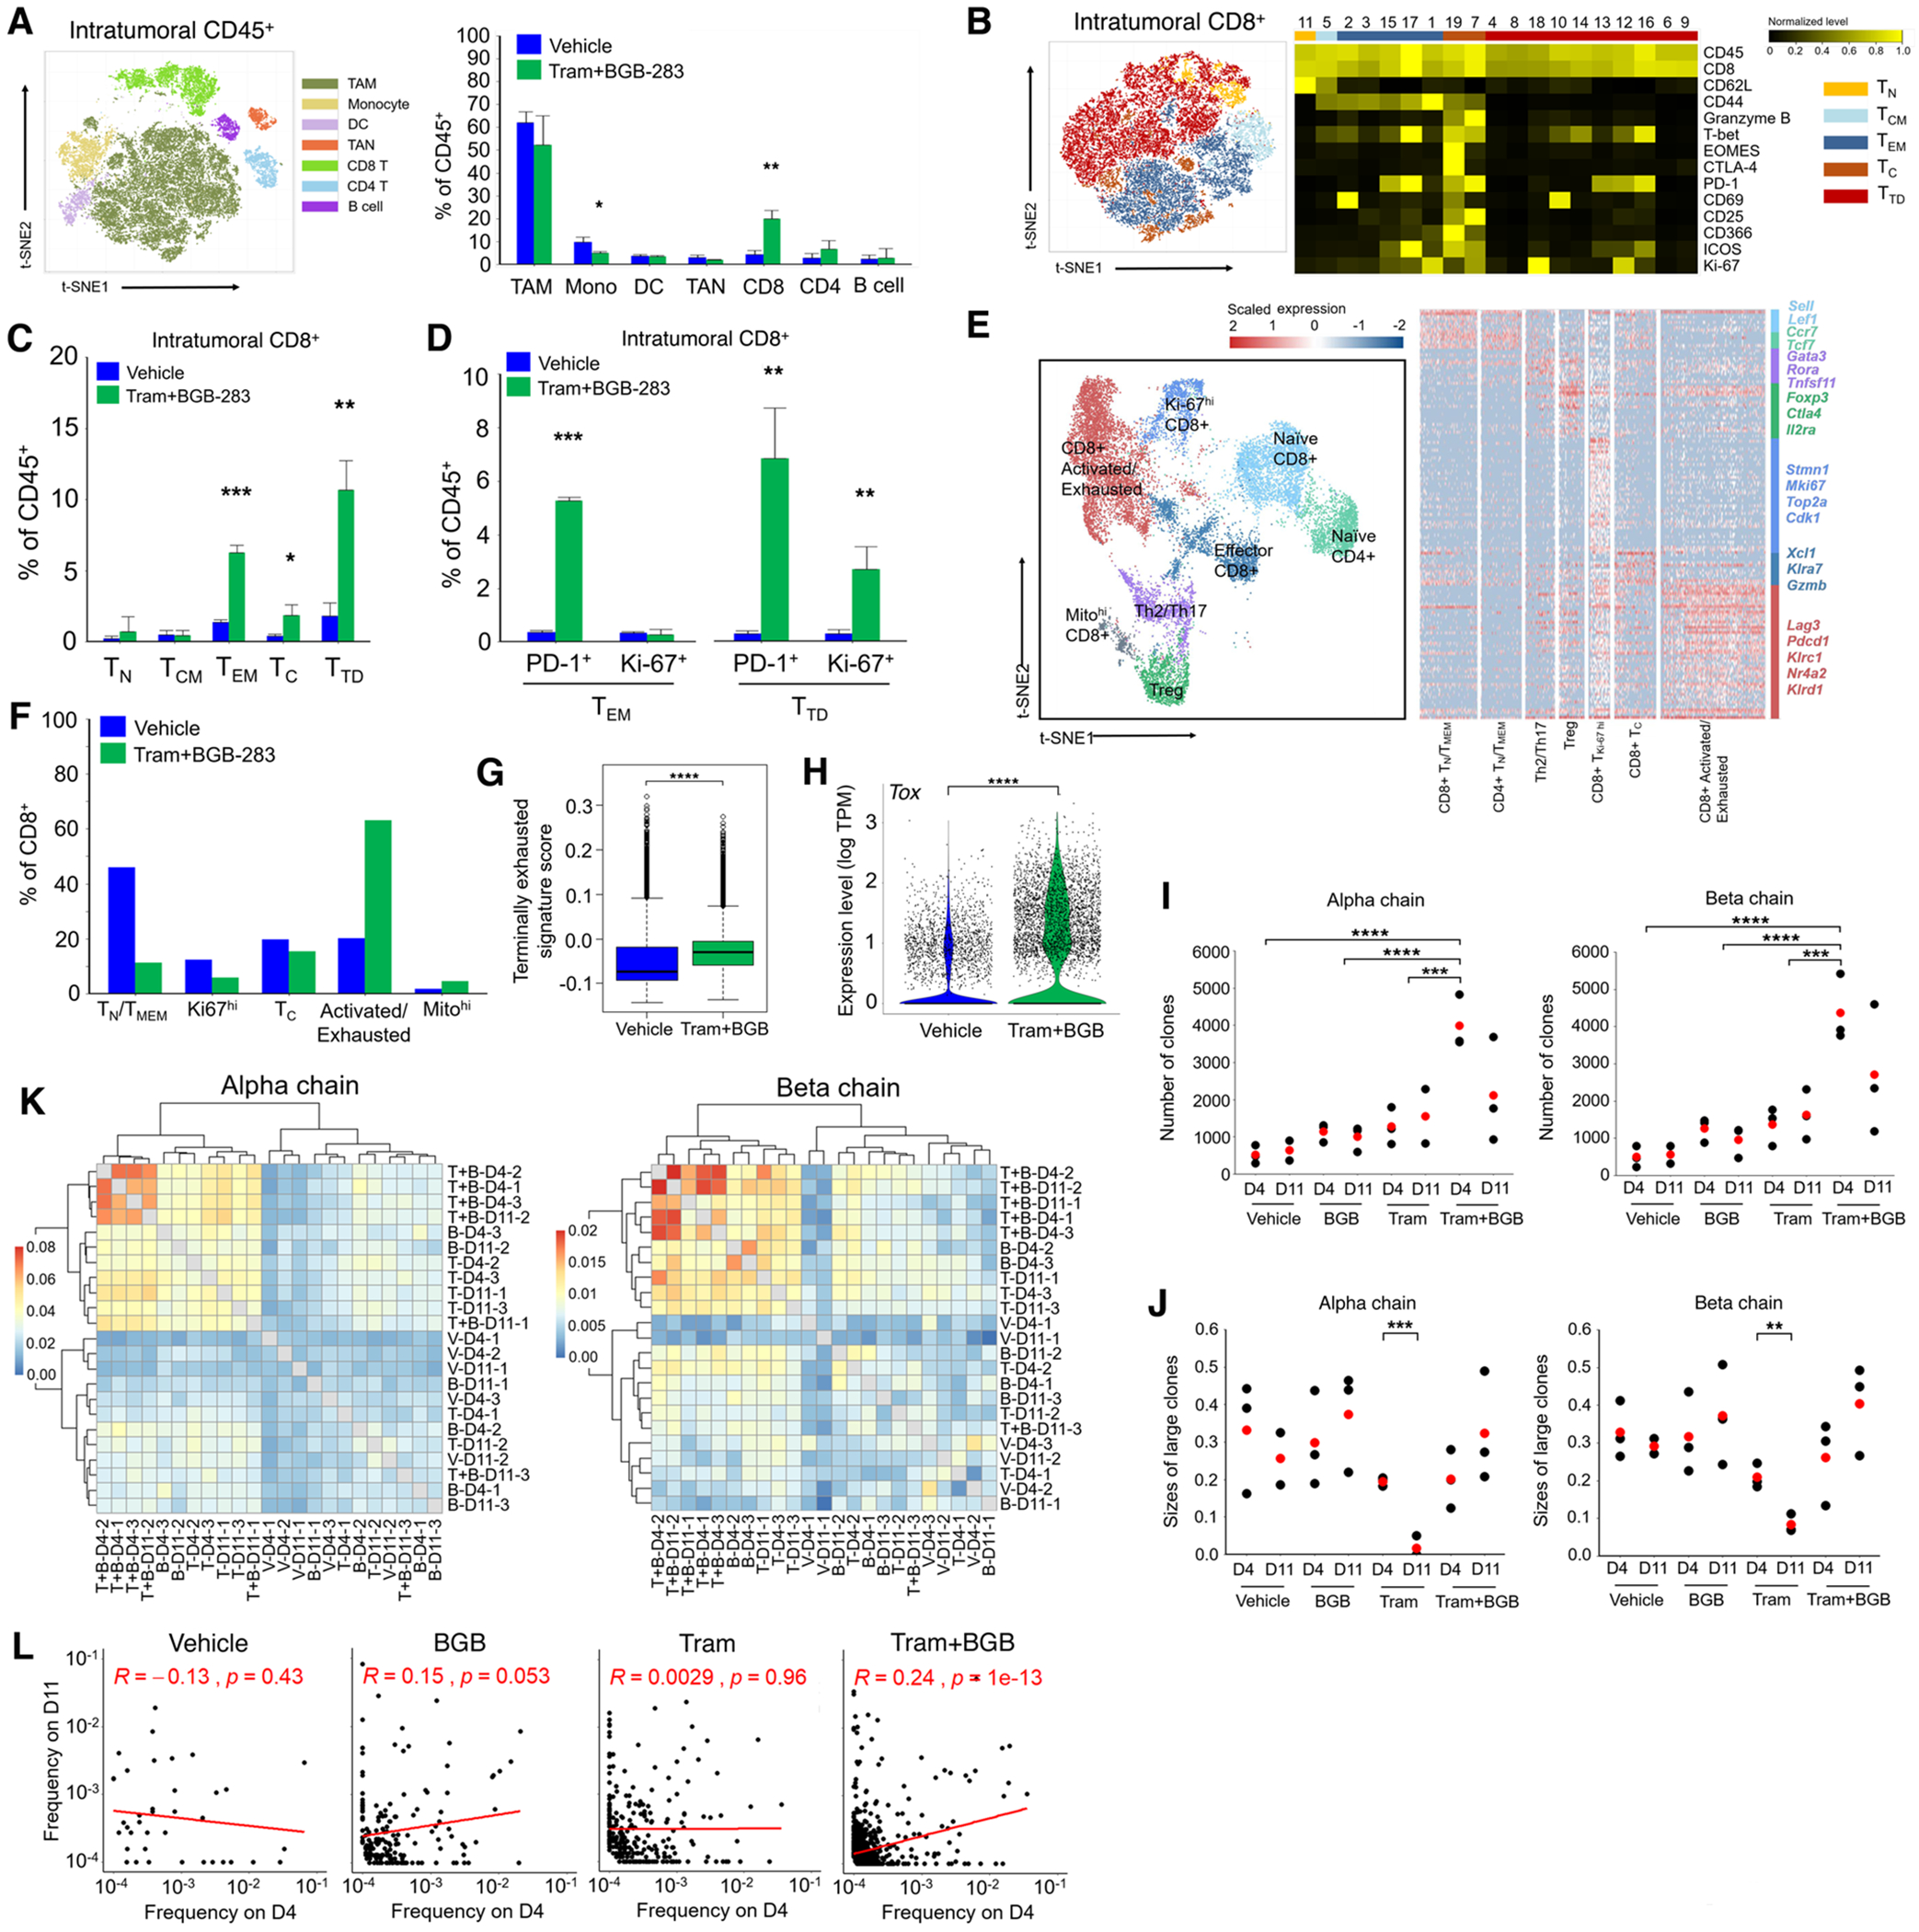
MAPK targeting in cancer often fails due to MAPK reactivation. MEK inhibitor (MEKi) monotherapy provides limited clinical benefits but may serve as a foundation for combination therapies. Here, we showed that combining a type II RAF inhibitor (RAFi) with an allosteric MEKi durably prevents and overcomes acquired resistance among cancers with KRAS, NRAS, NF1, BRAF non-V600, and BRAF V600 mutations. Tumor cell-intrinsically, type II RAFi plus MEKi sequester MEK in RAF complexes, reduce MEK/MEK dimerization, and uncouple MEK from ERK in acquired-resistant tumor subpopulations. Immunologically, this combination expands memory and activated/exhausted CD8+ T cells, and durable tumor regression elicited by this combination requires CD8+ T cells, which can be reinvigorated by anti-PD-L1 therapy. Whereas MEKi reduces dominant intratumoral T-cell clones, type II RAFi cotreatment reverses this effect and promotes T-cell clonotypic expansion. These findings rationalize the clinical development of type II RAFi plus MEKi and their further combination with PD-1/L1-targeted therapy. SIGNIFICANCE: Type I RAFi + MEKi are indicated only in certain BRAF V600MUT cancers. In contrast, type II RAFi + MEKi are durably active against acquired MEKi resistance across broad cancer indications, which reveals exquisite MAPK addiction. Allosteric modulation of MAPK protein/protein interactions and temporal preservation of intratumoral CD8+ T cells are mechanisms that may be further exploited.This article is highlighted in the In This Issue feature, p. 521.


Figures

Figure 1.
Figure 1.
Type II RAFi+MEKi forestalls and overcomes acquired resistance in BRAFMUT, NF1MUT, KRAS MUT and NRAS MUT cancers. A, Clonogenic growth (14 days) of indicated inhibitor-naïve BRAFV600 or NF1 mutant melanoma, BRAFV600MUT or KRASMUT colorectal carcinoma (CRC), KRASMUT non-small cell lung carcinoma (NSCLC), and KRASMUT (vs. KRASWT) pancreatic ductal adenocarcinoma (PDAC) cell lines after treatment with vehicle (DMSO), BGB-283 (0.5 μM), trametinib (0.02 μM), or trametinib (0.02 μM) plus BGB-283 (0.5 μM) or alternatively with RAF709 (0.5 μM), binimetinib (0.02 μM), or binimetinib (0.02 μM) plus RAF709 (0.5 μM). Data representative of two replicates. B, Clonogenic growth (15 days, left two sub-lines; 10 days, right two sub-lines) of indicated type I RAFi+MEKi double-drug resistant (DDR; hereafter all names of sub-lines with acquired drug resistance shown in red text) BRAFV600E melanoma sub-lines. DDR sub-lines were maintained on both PLX4032 (1 μM) plus AZD6244 (1 μM), either PLX4032 or AZD6244, or withdrawn from both inhibitors. On top of these four conditions, a type II RAFi (BGB-283 at 1 μM or RAF-709 at 1 μM) was added. Data representative of two replicates. C, D, Tumor volumes of PDAC (n=2; XWR6, left; XWR7, right, c) and NSCLC (n=2; LBM013-P, left; TM00302, right, d) PDXs in mice that were treated with vehicle, trametinib (3 mg/kg/day PO), BGB-283 (20 mg/kg/day PO), or the combination of trametinib and BGB-283. Vehicle or inhibitor treatments were started at tumor volumes of ~500 mm3. N=5 tumors per group; means ± SEMs. E, Clonogenic growth (5 or 14 days, upper left panel) of indicated inhibitor-naïve NRASMUT melanoma cell lines after treatment with vehicle (DMSO), BGB-283 (0.5 μM), trametinib (0.02 μM), or trametinib (0.02 μM) plus BGB-283 (0.5 μM). Data representative of two replicates. Tumor volumes of NRASMUT (n=3; NRAS_PDX3, top; NRAS_PDX4, middle; NRAS_PDX1, bottom) PDXs in mice that were treated with vehicle, trametinib (3 mg/kg/day PO), BGB-283 (20 mg/kg/day PO), or the combination of trametinib and BGB-283. Vehicle or inhibitor treatments were started at tumor volumes of ~500 mm3. N=5 tumors per group; means ± SEMs. F, (Top) Clonogenic growth (10 days) of indicated inhibitor-naïve NRASMUT melanoma cell lines after treatment with vehicle (DMSO) or indicated concentration of MEKi (trametinib) or ERKi (SCH772984). Data representative of two replicates. (Bottom) Western blots of lysates from NRASMUT melanoma cell lines treated (2 hours) with vehicle (DMSO) or the same concentrations of MEKi or ERKi (Top) with indicated antibodies. G, Clonogenic growth (15 or 30 days) of indicated inhibitor-naïve NRASMUT melanoma cell lines after treatment with vehicle (DMSO) or trametinib, SCH772984, or the type I RAFi PLX-4032 (15 day only) at the indicated concentrations, ± BGB-283. Over-confluent cultures without BGB-283 co-treatment were terminated early and not shown for day 30. Data representative of two replicates. H, As in G, except NRASMUT melanoma sub-lines (single-drug resistant or SDR, indicated in red) with acquired MEKi (trametinib) resistance were used. Day 15 cultures are shown except those marked with * (which indicates day 30 cultures). Cultures marked with # display the drug addiction phenotype.
Figure 2.
Figure 2.
NRAS, BRAF, CRAF and MEK1/2 genomic and transcriptomic alterations drive acquired MEKi resistance in NRASMUT melanoma. A, Volumes of all PDX tumors individually displayed over the course of daily vehicle (dotted lines) or trametinib at 5 mg/kg/day PO (solid lines) treatment (initiated when tumor volumes near 500 mm3). B, Most recurrent ERK pathway GOF genes in trametinib-resistant NRASMUT melanoma PDX tumors or sub-lines vs. vehicle-treated PDX tumors or isogenic, parental cell lines, respectively. C, Levels of NRAS and RAF1(CRAF) mRNA in MEKi-resistant vs. -sensitive NRASMUT melanoma. D, Phylogenetic relationships of MEKi-resistant vs. vehicle-treated NRASMUT melanoma PDX tumors. Branch lengths proportional to the numbers (in red) of somatic SNVs and INDELs. Nearest common ancestors enumerated. Shared and private genomic alterations of CGC genes listed along with wild type and mutant allele frequencies. E, NRAS Western blots (WBs) of indicated cell lines transduced to over-express (O.E.) NRASWT or NRASQ61K (left) or to express shSCRAMBLE (shScr) or shNRAS (right). Single (MEKi) Drug Resistant (SDR) sub-lines indicated in red. TUBULIN, loading controls. Arrows indicate engineered cell lines for assay in f. F, Clonogenic growth (14 days) of indicated cell lines (e) at two indicated trametinib concentrations. G, CRAF or BRAF WBs of indicated cell lines transduced to express shCRAF and/or shBRAF. H, Clonogenic growth (14 days) of indicated cell lines in g at indicated trametinib concentrations.
Figure 3.
Figure 3.
Type II RAFi+MEKi overcomes ERK re-activation and growth in acquired resistant melanoma by inducing BRAF/CRAF complex without reducing p-MEK. A, Immunoprecipitation (IP) of indicated cell lines (parental or P without trametinib and SDR sub-lines with 0.1 μM of trametinib; this convention followed in all experiments, unless otherwise indicated) followed by WBs or direct WBs of whole cell lysates (WCLs) of indicated cell lines. IgG, isotype control for IP. B, Clonogenic growth (15 days) of indicated cell lines treated with the indicated concentrations of BGB-283. Data representative of two replicates. C, Total and phospho-MEK or -ERK WBs of lysates from indicated cell lines treated with increasing concentrations (0, 0.01, 0.1, 1 or 10 μM) of BGB-283 (2 hours). D, Total and phospho-ERK WBs of lysates from indicated cell lines treated with 1 μM of BGB-283 for indicated durations (hours or hrs). E, IP-WBs or direct WBs of WCL after treatment of indicated cell lines with increasing concentrations of BGB-283 or 0.5 μM of vemurafenib (2 hours). IgG, isotype control for IP. Last trametinib (0.1 μM) dose (only for SDR sub-lines) added 16 hours prior to cell lysis. F, Clonogenic growth (14 days) of indicated P lines and SDR sub-lines engineered as in Figure 2g and either untreated or treated with two concentrations of BGB-283.
Figure 4.
Figure 4.
Type II RAFi and MEKi coordinate RAF/MEK stabilization, sequestering MEK from ERK. A, Proximity ligation assays (PLAs) detecting CRAF/MEK and MEK/ERK proximity complexes in NRASMUT melanoma SDR sub-lines withdrawn from trametinib for 12 days or treated for 12 days with trametinib (0.1 μM), SCH-772984 (0.1 μM), or BVD-523 (1.0 μM), ± BGB-283 co-treatment (1 μM). Last fresh dose of inhibitor(s), 12 hours before analysis. DAPI, nuclear stain. Ruler, 20 μm. B, Quantifications of PLA signals in (a) expressed as the fold change (FC) of PLA dots (per nucleus) of BGB-283 co-treatment over DMSO or single inhibitor treatment. N=5 fields; mean ± SDs; all comparisons with respect to FC (BGB-283+DMSO/DMSO); *p<0.1, **p<0.05 and ***p <0.01 based on t-test. C, Western blots (Wbs) of lysates from culture conditions in A using indicated antibodies. D, PLA detecting CRAF/CRAF, BRAF/BRAF, BRAF/MEK and MEK1/MEK1 proximity complexes in two NRASMUT melanoma SDR sub-lines treated with vehicle or trametinib (0.1 μM) for 48 hours, ± BGB-283 (1 μM, last 2 hours). DAPI, nuclear stain. Ruler, 20 μm. E, Quantification of PLA data in c. N=5 fields; mean ± SDs. FCs: black, BGB-283+DMSO/DMSO; grey, BGB-283+tram/tram. Latter FC is compared to the former FC; **p<0.05 and ***p <0.01 based on t-test. F, Tumor volumes of NRAS_PDX1 R2 (with acquired trametinib resistance) in mice that were (starting on day 78, indicated by an arrow) maintained on trametinib (5 mg/kg/day PO), switched to BGB-283 (20 mg/kg/day PO), or treated with BGB-283 (20 mg/kg/day PO) on top of trametinib (5 mg/kg/day PO). N=5 tumors per group; means ± SEMs. G, Immunofluorescence (IF) of p-ERK levels (top row) and PLA of indicated protein/protein proximity complexes (bottom three rows) for three groups of PDX tumors in e. Tumors were collected on days 3 or 5 (from day 78). Images representative of five tumors per group. H, Quantifications of PLA signals of CRAF/BRAF, CRAF/MEK and MEK/ERK complexes expressed as FC of PLA dots per nucleus of each indicated treatment condition vs. continuous trametinib monotherapy. Mean ± SDs; **p<0.05 and ***p <0.01 based on pairwise t-test. I, IP-WBs or direct WBs of WCLs after treatment of indicated trametinib-resistant sub-lines with vehicle (DMSO) or indicated inhibitor(s) as in a. IgG, isotype control for IP. J, Predicted conformational rearrangements of MEK1 and BRAF in complex upon binding to trametinib and BGB-283, respectively. Light brown, BRAF in its MEK1-bound tetrameric conformation; dark brown, BRAF in its BGB-283-bound conformation (BRAF P-loop in orange). Dark blue, MEK1 in BRAF-bound tetrameric conformation; light blue, MEK1 in its Tak-733-bound conformation (MEK1 activation loop in green). Red arrows, predicted and actual rearrangements of MEK1 and BRAF upon trametinib and BGB-283 binding, respectively.
Figure 5.
Figure 5.
Tumor regression in response to Type II RAFi plus MEKi in syngenic models requires CD8+ T-cells. A, Volumes of NIL vs. NILER1-4 tumors in response to trametinib (Tram) treatment (3 mg/kg/day PO) (starting day 0), ± anti-CD8 neutralization (starting -1 day). Inset, CD8+ T-cell levels as a % of CD45+ splenocytes at the end of experiments. N=8 tumors/group; means ± SEMs. P-value, Student t test. B, Volumes of NILER1-4 tumors with indicated treatments starting at 200 mm3. Trametinib at 1 mg/kg/day PO. N=7 tumors/group; means ± SEMs. Complete responses (CRs) confirmed by withdrawal of tram+BGB-283 (20 mg/kg/day PO) without tumor recurrence for 35 days of observation. Right, average body weights of mice in each group measured twice a week. C, D, Volumes of CT-26 (C) or KPC (D) tumors with indicated treatments starting on day 12 and 13, respectively (at 200 mm3 tumor volume). Trametinib at 1 mg/kg/day PO. Anti-CD8 treatment started on day 11 and 12, respectively. N=8 tumors/group; means ± SEMs. Unconfirmed CRs, 6/8 (C) or 2/8 (D) in the tram+BGB-283 (20 mg/kg/day PO) groups on day 45 or 46. P-value, Student t test. Right, average body weights of mice in each group measured twice a week. E, F, Volumes of individual CT-26 tumors relative to tumor-matched baseline volumes (400-450 mm3) on day 0, when tumor-bearing mice were assigned to each of three indicated groups. Trametinib 2 (E) or 3 (F) mg/kg/day PO. Tumors/group (tram, BGB-283, tram+BGB-283): 8, 8, 6 (E) or 8, 8, 8 (F). Unconfirmed CRs, 0/6 (E) or 1/8 (F) in the tram+BGB-283 (20 mg/kg/day PO) groups on day 23. Right, average body weights of mice in each group measured twice a week. G, Volumes of NILER1-4 tumors with indicated daily single-agent treatments starting at 200 mm3. N=8 tumors/group; means ± SEMs. Functionally equivalent doses of trametinib vs. SCH772984 were selected for use in H. H, Volumes of NILER1-4 tumors with indicated treatment starting at 200 mm3. Trametinib at 0.1 mg/kg/day PO, SCH772984 at 25 mg/kg/day IP. N=8 tumors/group; means ± SEMs. Right, average body weights of mice in each group measured twice a week. I, Volumes of NILER1-4 tumors with indicated treatment starting at 200 mm3. Trametinib at 0.1 mg/kg/day plus BGB-283 at 10 or 20 mg/kg/day ± anti-CD8 neutralization (starting day 8). N=8 tumors/group; means ± SEMs. J, Volumes of NILER1-4 tumors with indicated treatment starting at 200 mm3 and day 10. Trametinib at 0.1 mg/kg/day plus BGB-283 at 10 or 20 mg/kg/day ± anti-PD-L1 treatment. N=8 tumors/group; means ± SEMs. P-value, Student t test. Right, average body weights of mice in each group measured twice a week.
Figure 6.
Figure 6.
Type II RAFi+MEKi elicits systemic expansion of central memory CD8+ T-cells in mice-bearing NrasMUT melanoma. A, Hematoxylin and eosin (H&E) stains of NILER1–4 tumors (days 4 and 11) on vehicle, BGB-283 (20 mg/kg/d), trametinib (1 mg/kg/d), or both. Representative of three tumors per group. Ruler=1 mm. Colored boxes delineate magnified areas in e. B, Magnified areas of NILER1–4 tumors analyzed by H&E and representative CD8 and CD4 immnuohistochemistry. Ruler=100 μm. Highlighted H&E images of BGB+tram-treated tumors show areas of inflammation (short arrows), necrosis (long arrows), apoptotic bodies (d11, top) and tumor regression with melanosis (d11, bottom). C, Indicated tissue samples (PBMC, spleen, draining lymph nodes or LNs; n=3 per site) were obtained for CyTOF analysis on days 4 and 11 after starting each treatment group. Frequencies of CD4+ or CD8+ T-cells. Mean ± SEMs. Pairwise group comparisons with respect to the vehicle-treated group. P-value, paired Student’s t test. *p<0.05, **p<0.01 and ***p <0.001. D, t-SNE maps (left) of CD8+ T-cell subsets (within CD45+ cells) in the PMBC, spleen and draining LNs analyzed by CyTOF (pooled data from days 4 and 11). Heatmaps (right) showing the expression values of immune phenotypic protein markers normalized to the maximum mean value across subsets. E, F, As in C, except CyTOF analysis is for indicated CD8+ TCM (h) or TEM (i) subsets. G, Pearson correlation between CD8+ TCM vs. TEM subset frequencies in BGB-283+tram treated mice on (pooled data from days 4 and 11).
Figure. 7.
Figure. 7.
Co-treatment with type II RAFi+MEKi heightens tumor infiltration by effector memory and activated/exhausted CD8+ T-cells and T-cell clonal expansion. A, t-SNE map (left) of tumor infiltrating CD45+ cells analyzed by CyTOF (pooled data from vehicle- and Tram+BGB-283-treated groups). Frequencies of each cluster (right). N=3 tumors per group; mean ± SEMs. Pairwise group comparisons with respect to the vehicle-treated group. P-value, paired Student’s t test. *p<0.05, **p<0.01 and ***p <0.001. B, t-SNE map (left) of tumor infiltrating CD8+ T-cell subsets analyzed by CyTOF (pooled data from vehicle- and Tram+BGB-283-treated groups). Heatmap (right) showing the expression values of immune phenotypic protein markers normalized to the maximum mean value across meta-clusters. C, D, As in A, except CyTOF analysis is shown for indicated CD8+ T-cell subsets (c) or the percentages of PD-1 or Ki-67 positivity within indicated subsets (d). E, UMAP of tumor-infiltrating CD4+ and CD8+T-cells (n=14,199) analyzed by scRNA-seq (pooled data from vehicle- and Tram+BGB-283-treated groups, n=4 tumors per group by combining FACS-sorted CD4+ and CD8+T-cells). Clusters denoted by distinct colors are labeled with inferred cell types (left). Heatmap (right) showing differentially expressed genes (rows) among different T-cell subsets (columns). Specific genes that are associated with different T-cell clusters are highlighted along the right. F, Frequencies of indicated CD8+ T-cell subsets analyzed by scRNA-seq based on treatment status. G, Box plot of terminally exhausted gene signature scores (scRNA-seq) for all CD8+ T-cells in each treatment group. P-value, Wilcoxon rank-sum test, ****p <0.0001. H, Violin plot showing Tox expression levels (scRNA-seq) for all CD8+ T-cells in each treatment group. P-value, Wilcoxon rank-sum test, ****p <0.0001. I, Vehicle-, BGB-283-, Tram- and Tram+BGB-283-treated tumors on days 4 and 11 (n=3 per group, except one outlier in vehicle-treated tumor, d11) were analyzed by TCR-seq. Dot plot showing the number of TCR clones for α or β chain (red dots, average values). P-value, paired Student’s t test, ****p <0.0001. J, As in I except TCR-seq analysis is shown for sizes of large TCR clones (frequency >= 0.05). Pairwise comparison between d4 and d11 was performed in each treatment group with paired Student’s t test. *p<0.05, **p<0.01 and ***p <0.001. K, Clustering of TCR repertoires of tumor-infiltrating T-cells by the levels of shared CDR3 sequences (using the Jaccard index). L, Spearman correlations between frequencies on d4 and d11 of shared α chain CDR3 sequences in each condition. Mean frequency on d4 or d11 of each shared CDR3 sequence (at least in two samples of each condition) was calculated.

References

    1. Samatar AA, Poulikakos PI. Targeting RAS-ERK signalling in cancer: promises and challenges. Nat Rev Drug Discov 2014;13:928–42 - PubMed
    1. Dummer R, Schadendorf D, Ascierto PA, Arance A, Dutriaux C, Di Giacomo AM, et al. Binimetinib versus dacarbazine in patients with advanced NRAS-mutant melanoma (NEMO): a multicentre, open-label, randomised, phase 3 trial. Lancet Oncol 2017;18:435–45 - PubMed
    1. Flaherty KT, Robert C, Hersey P, Nathan P, Garbe C, Milhem M, et al. Improved survival with MEK inhibition in BRAF-mutated melanoma. N Engl J Med 2012;367:107–14 - PubMed
    1. Nazarian R, Shi H, Wang Q, Kong X, Koya RC, Lee H, et al. Melanomas acquire resistance to B-RAF(V600E) inhibition by RTK or N-RAS upregulation. Nature 2010;468:973–7 - PMC - PubMed
    1. Su F, Viros A, Milagre C, Trunzer K, Bollag G, Spleiss O, et al. RAS mutations in cutaneous squamous-cell carcinomas in patients treated with BRAF inhibitors. N Engl J Med 2012;366:207–15 - PMC - PubMed

Publication types

MeSH terms

Substances