. 2020 Dec 14;4(2):e202000965.
doi: 10.26508/lsa.202000965. Print 2021 Feb.

Degradation of arouser by endosomal microautophagy is essential for adaptation to starvation in Drosophila

Affiliations

Degradation of arouser by endosomal microautophagy is essential for adaptation to starvation in Drosophila

Anne-Claire Jacomin et al. Life Sci Alliance. .

Abstract

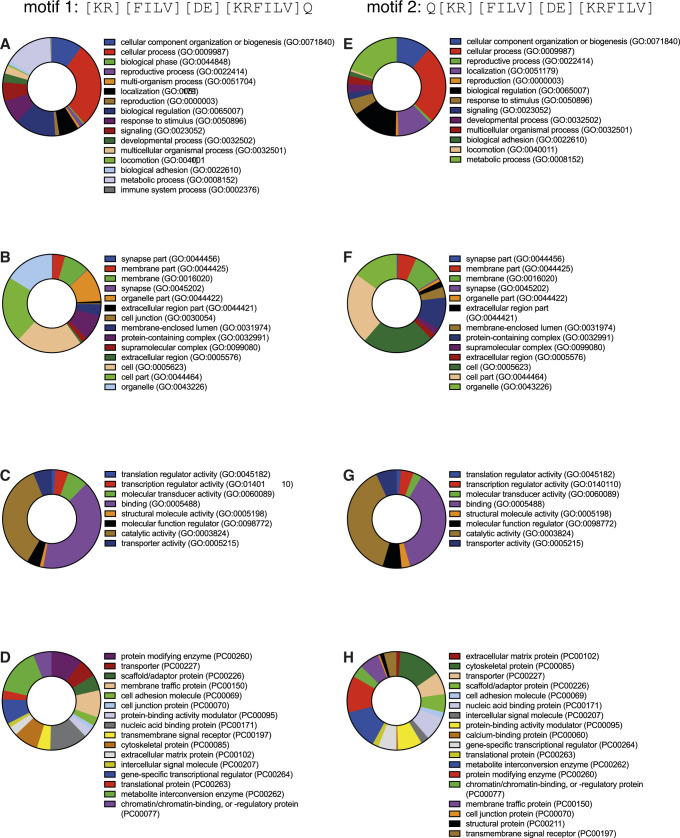
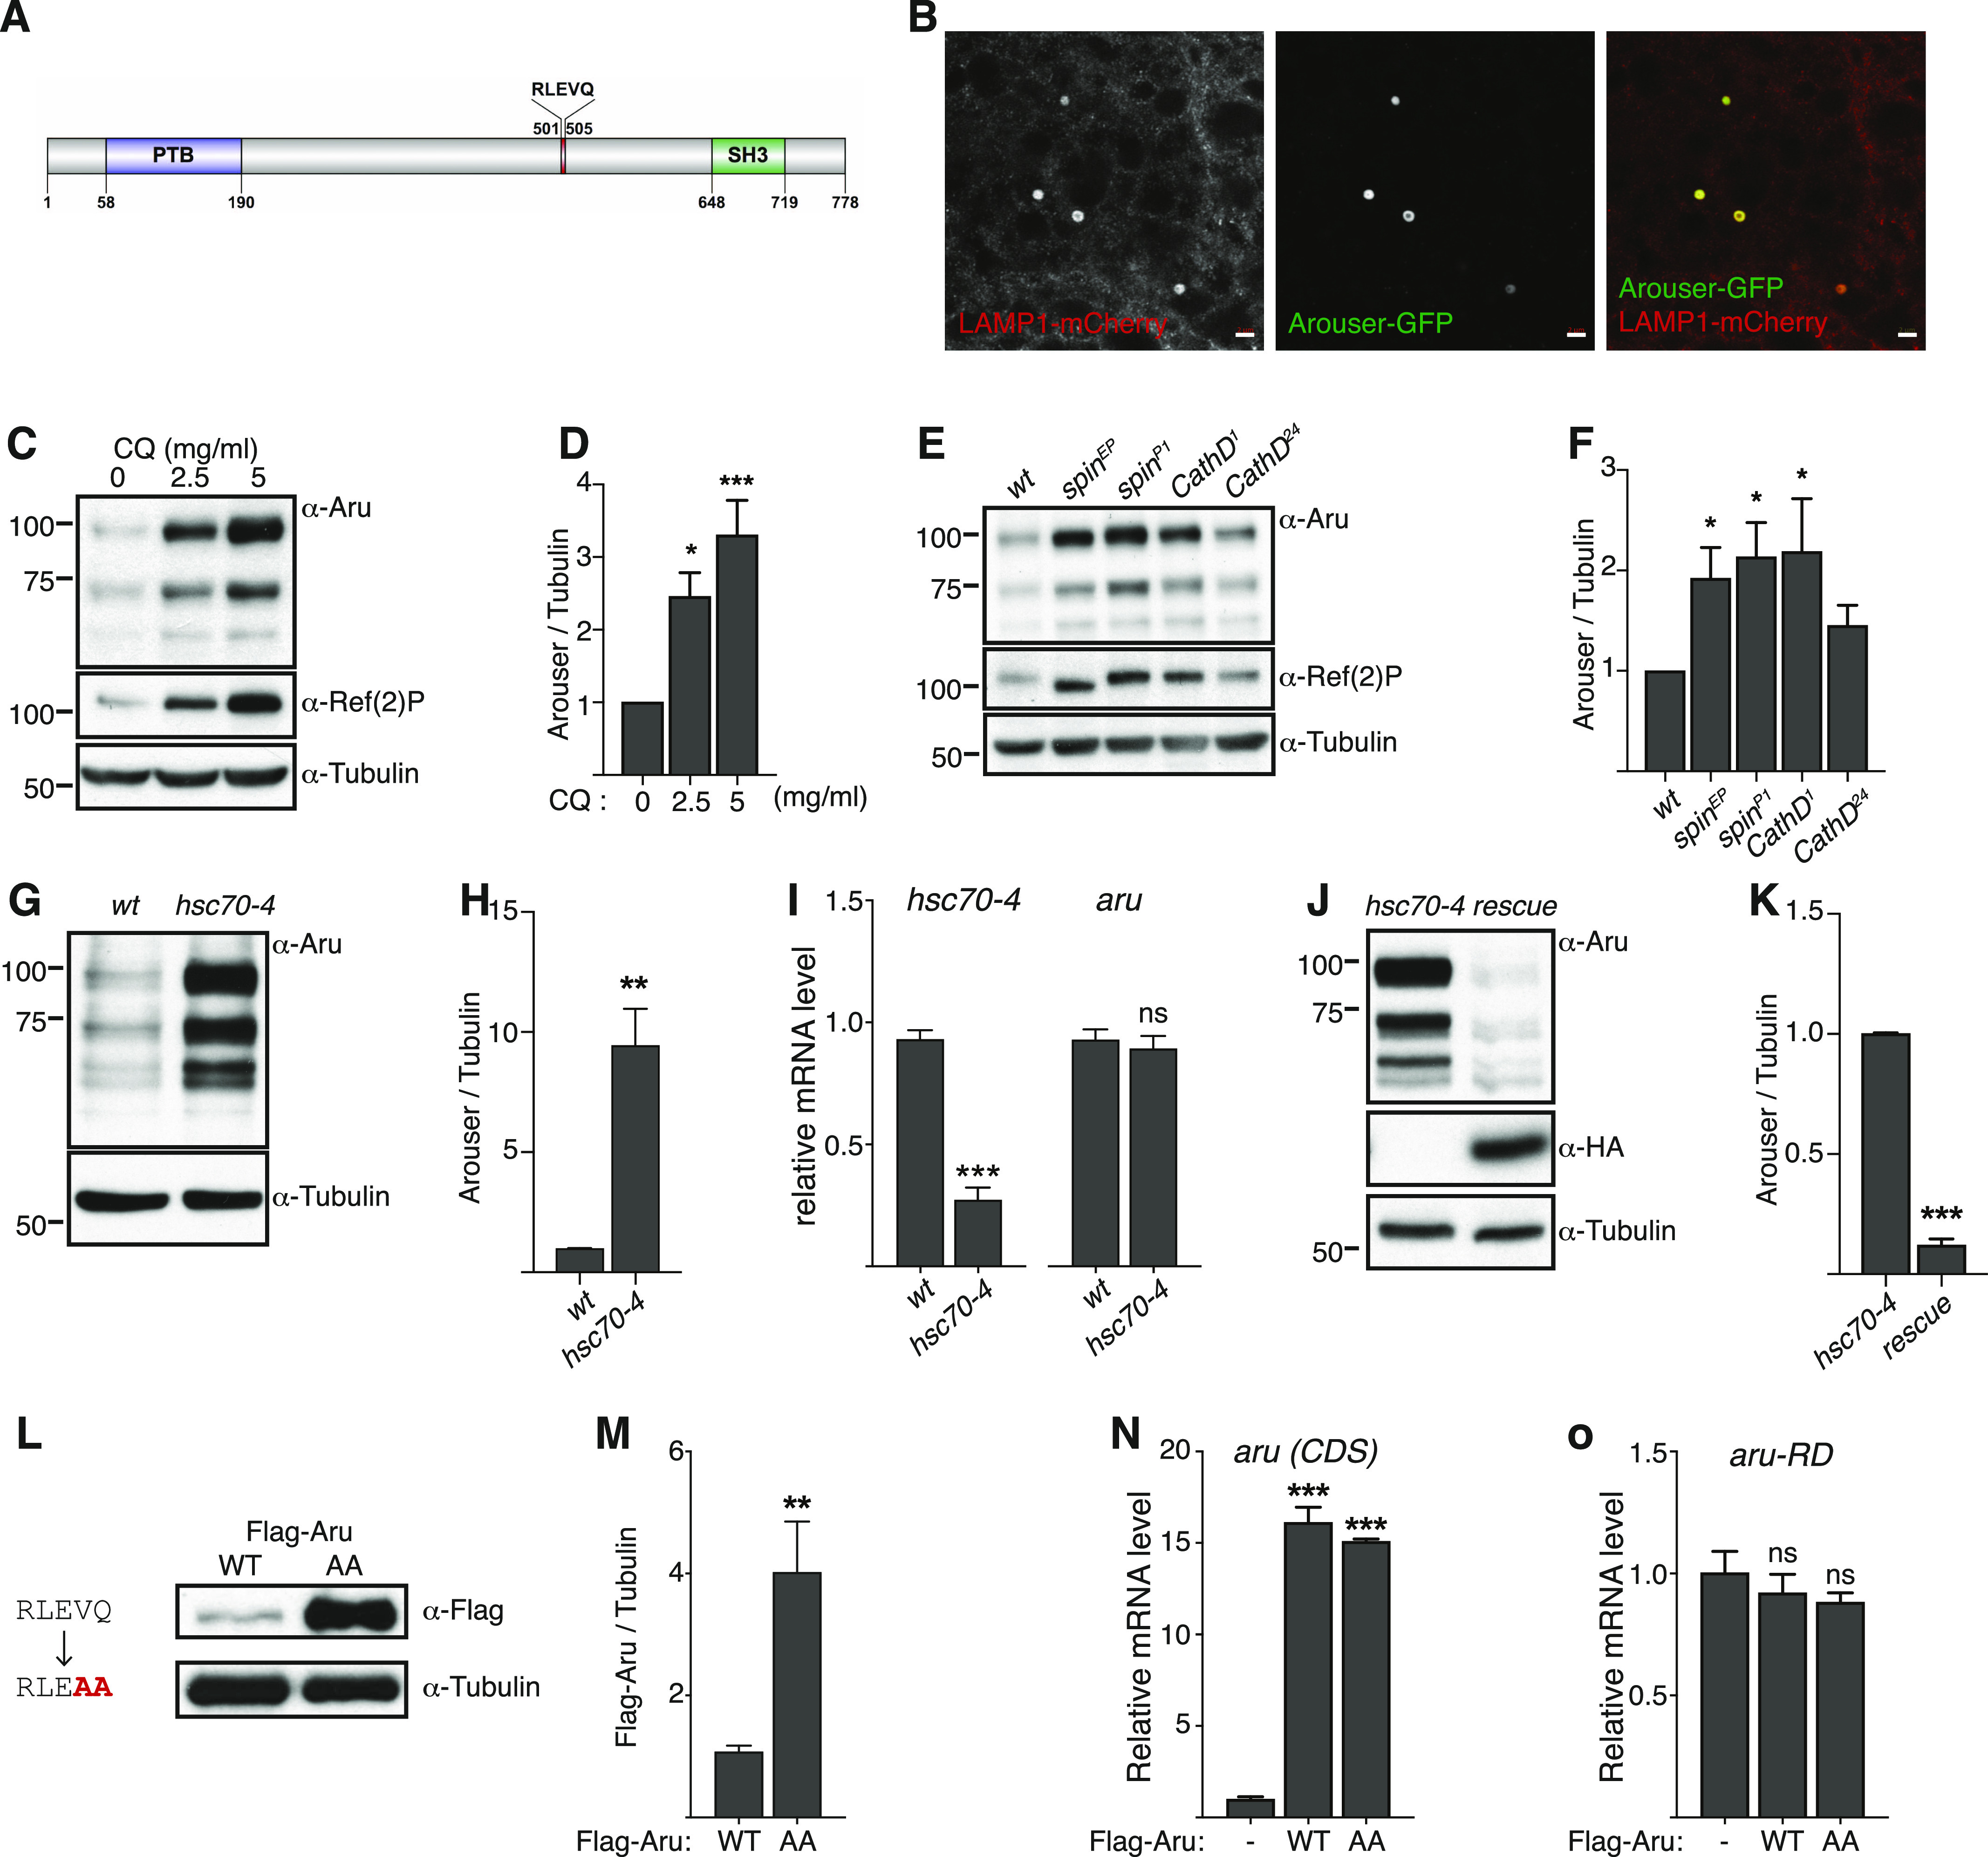
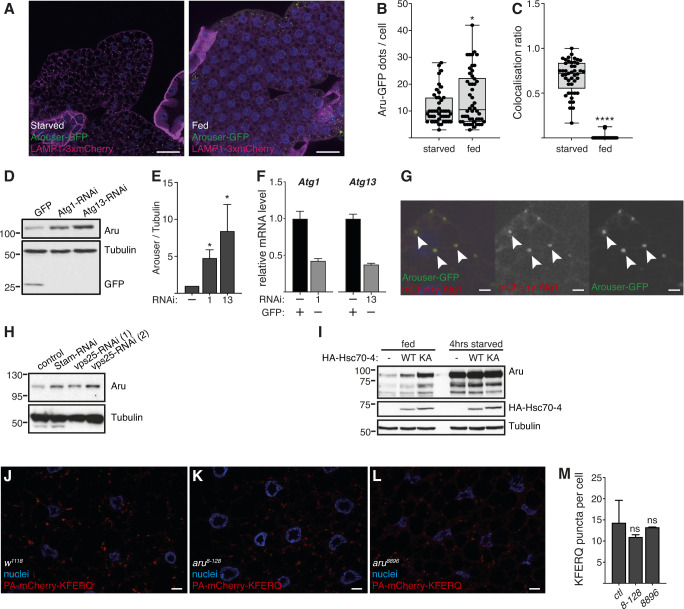
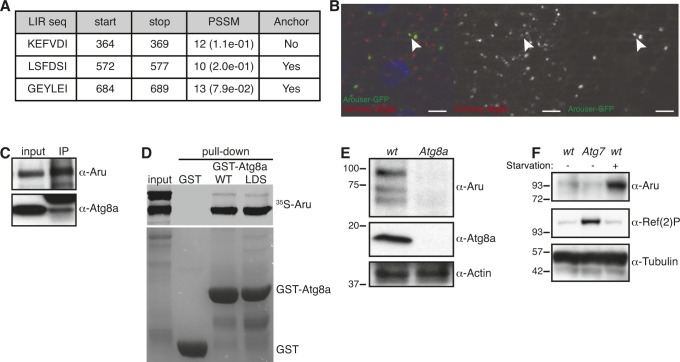
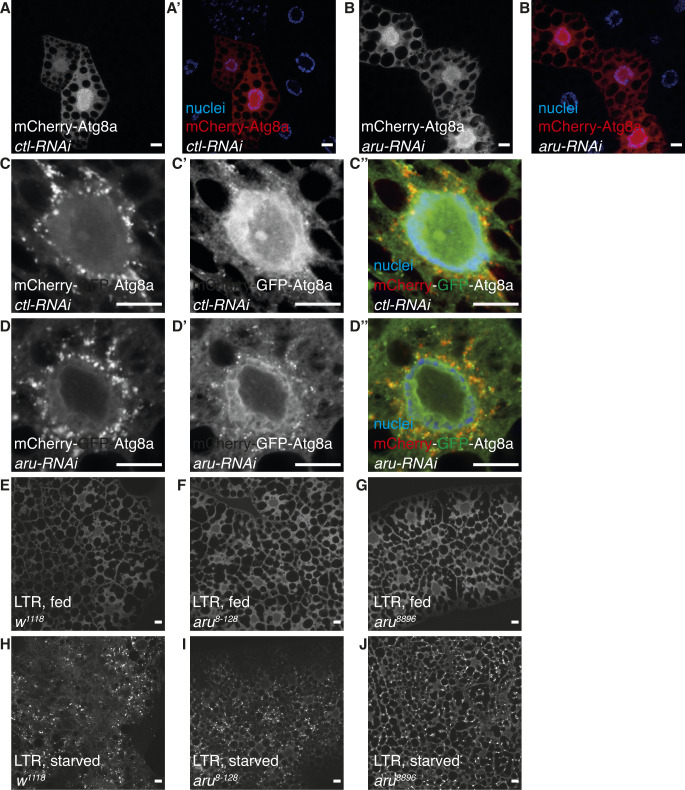
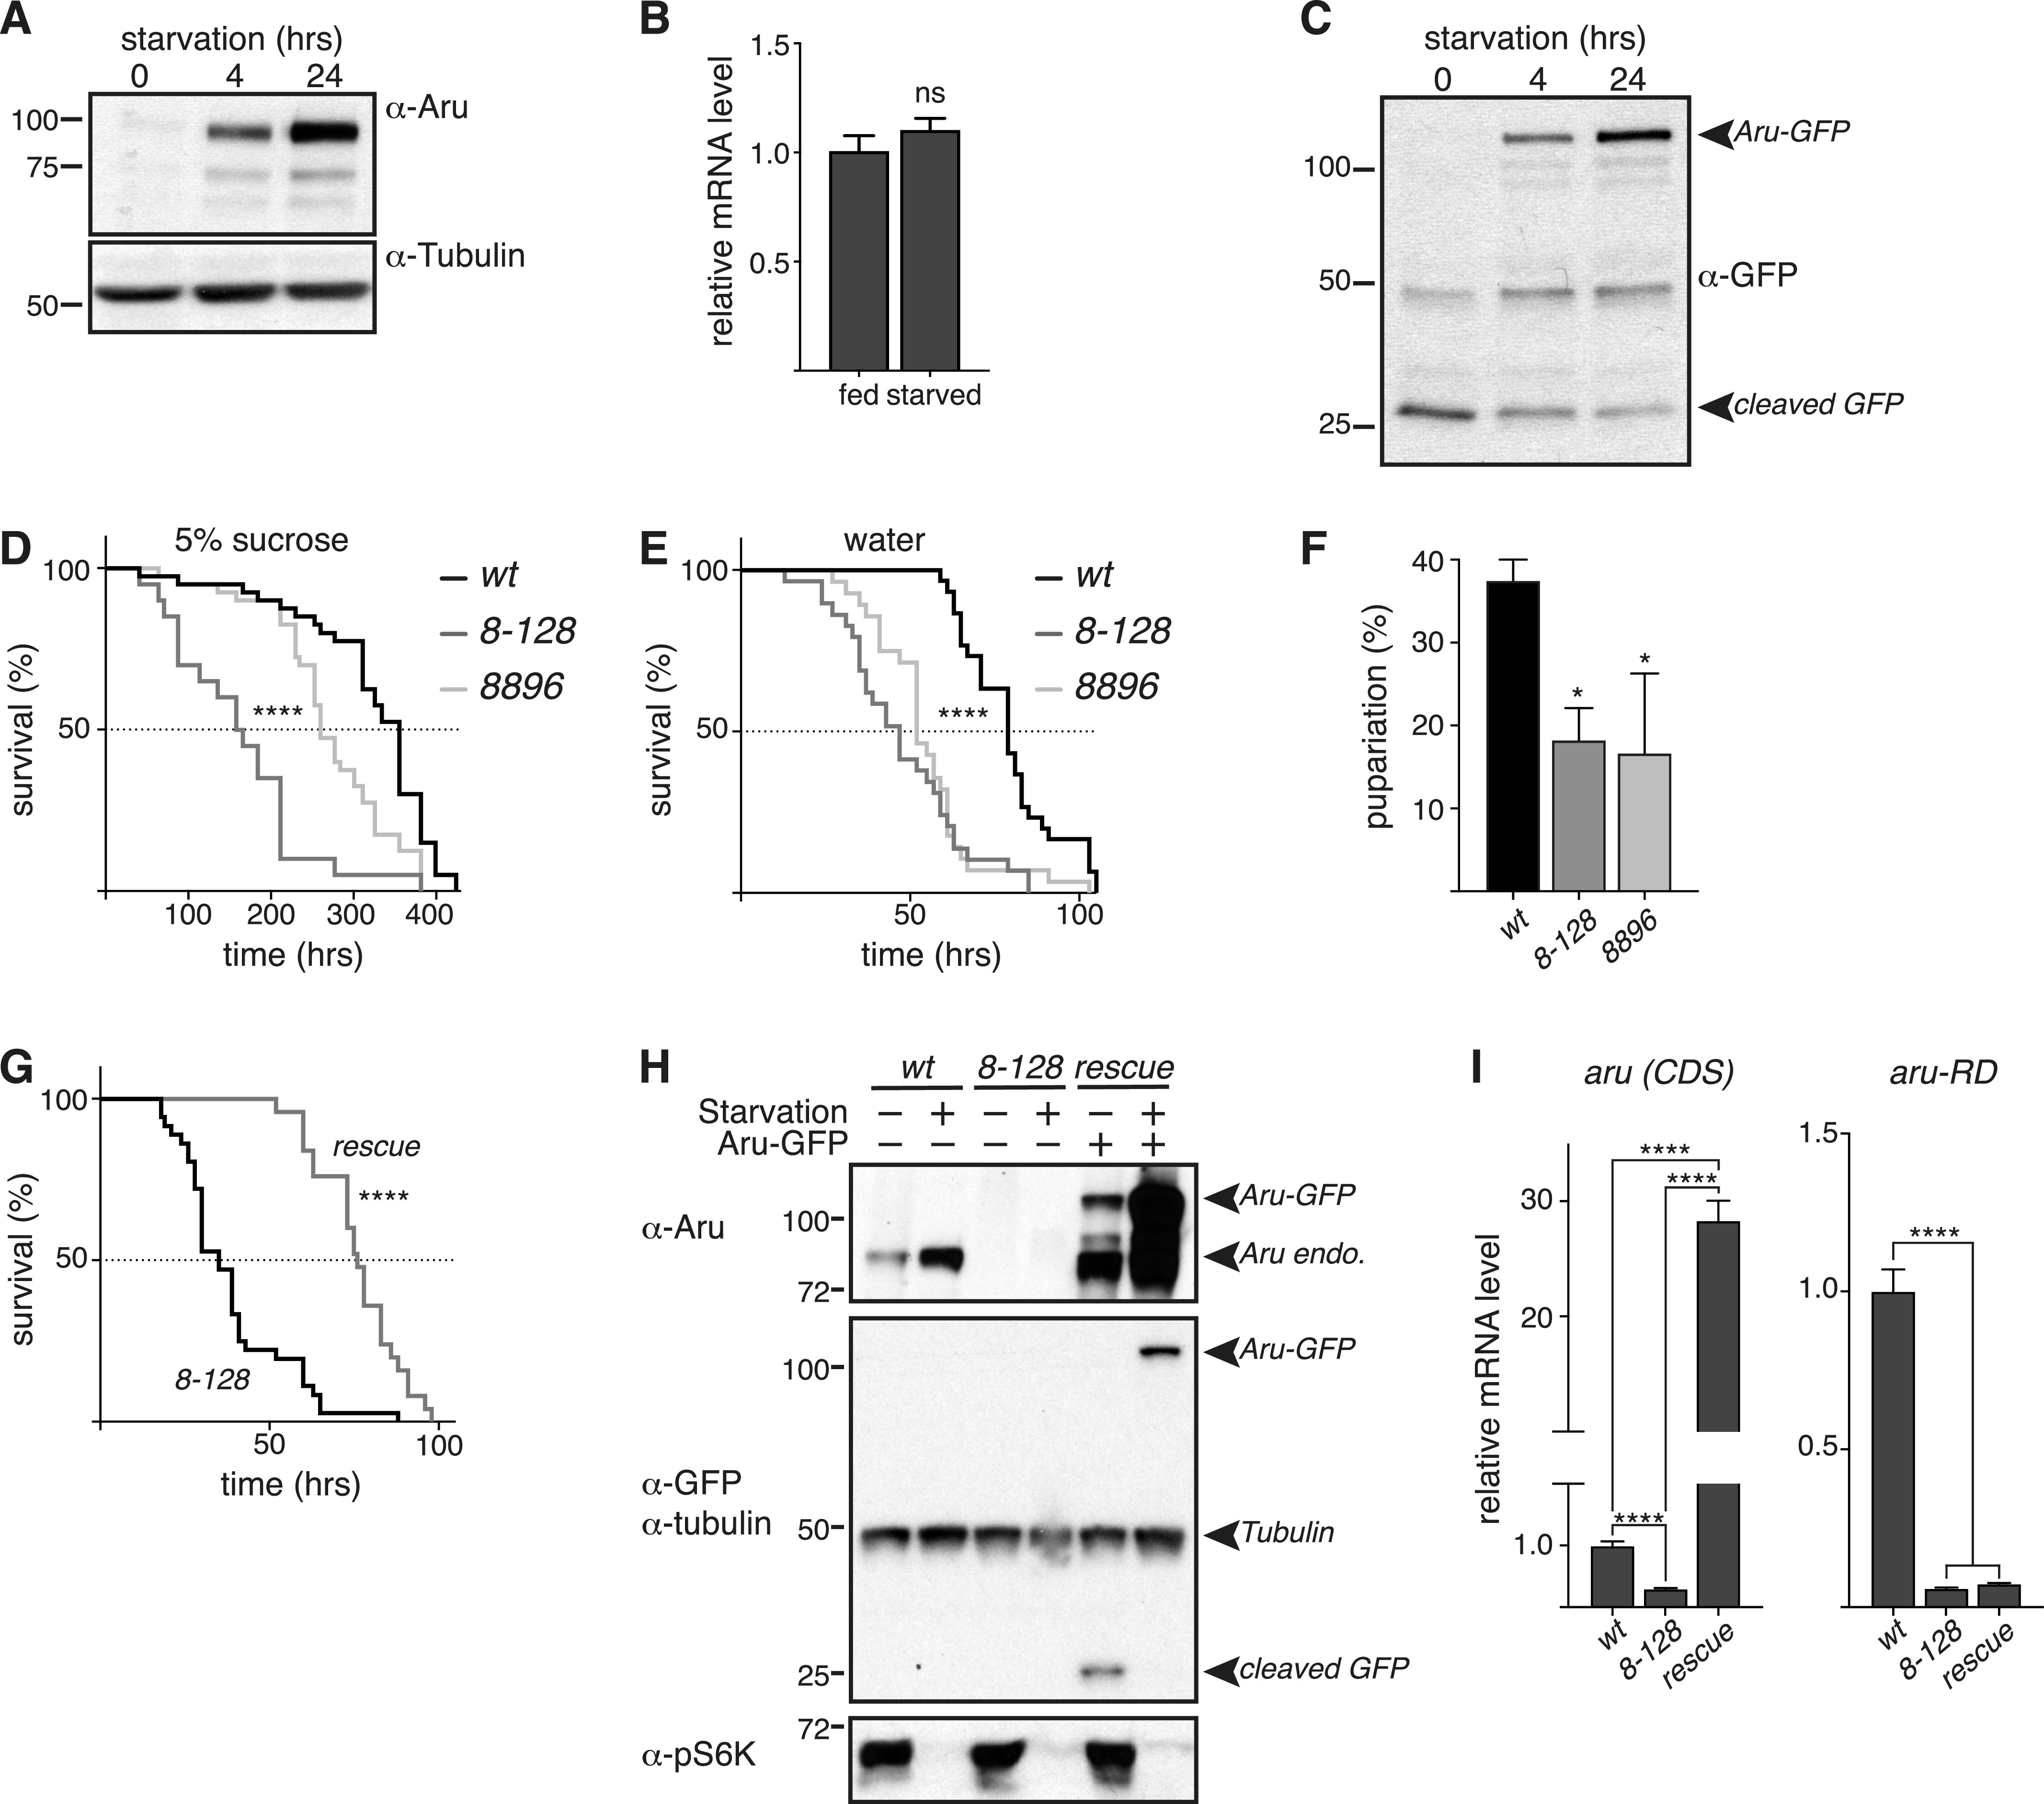
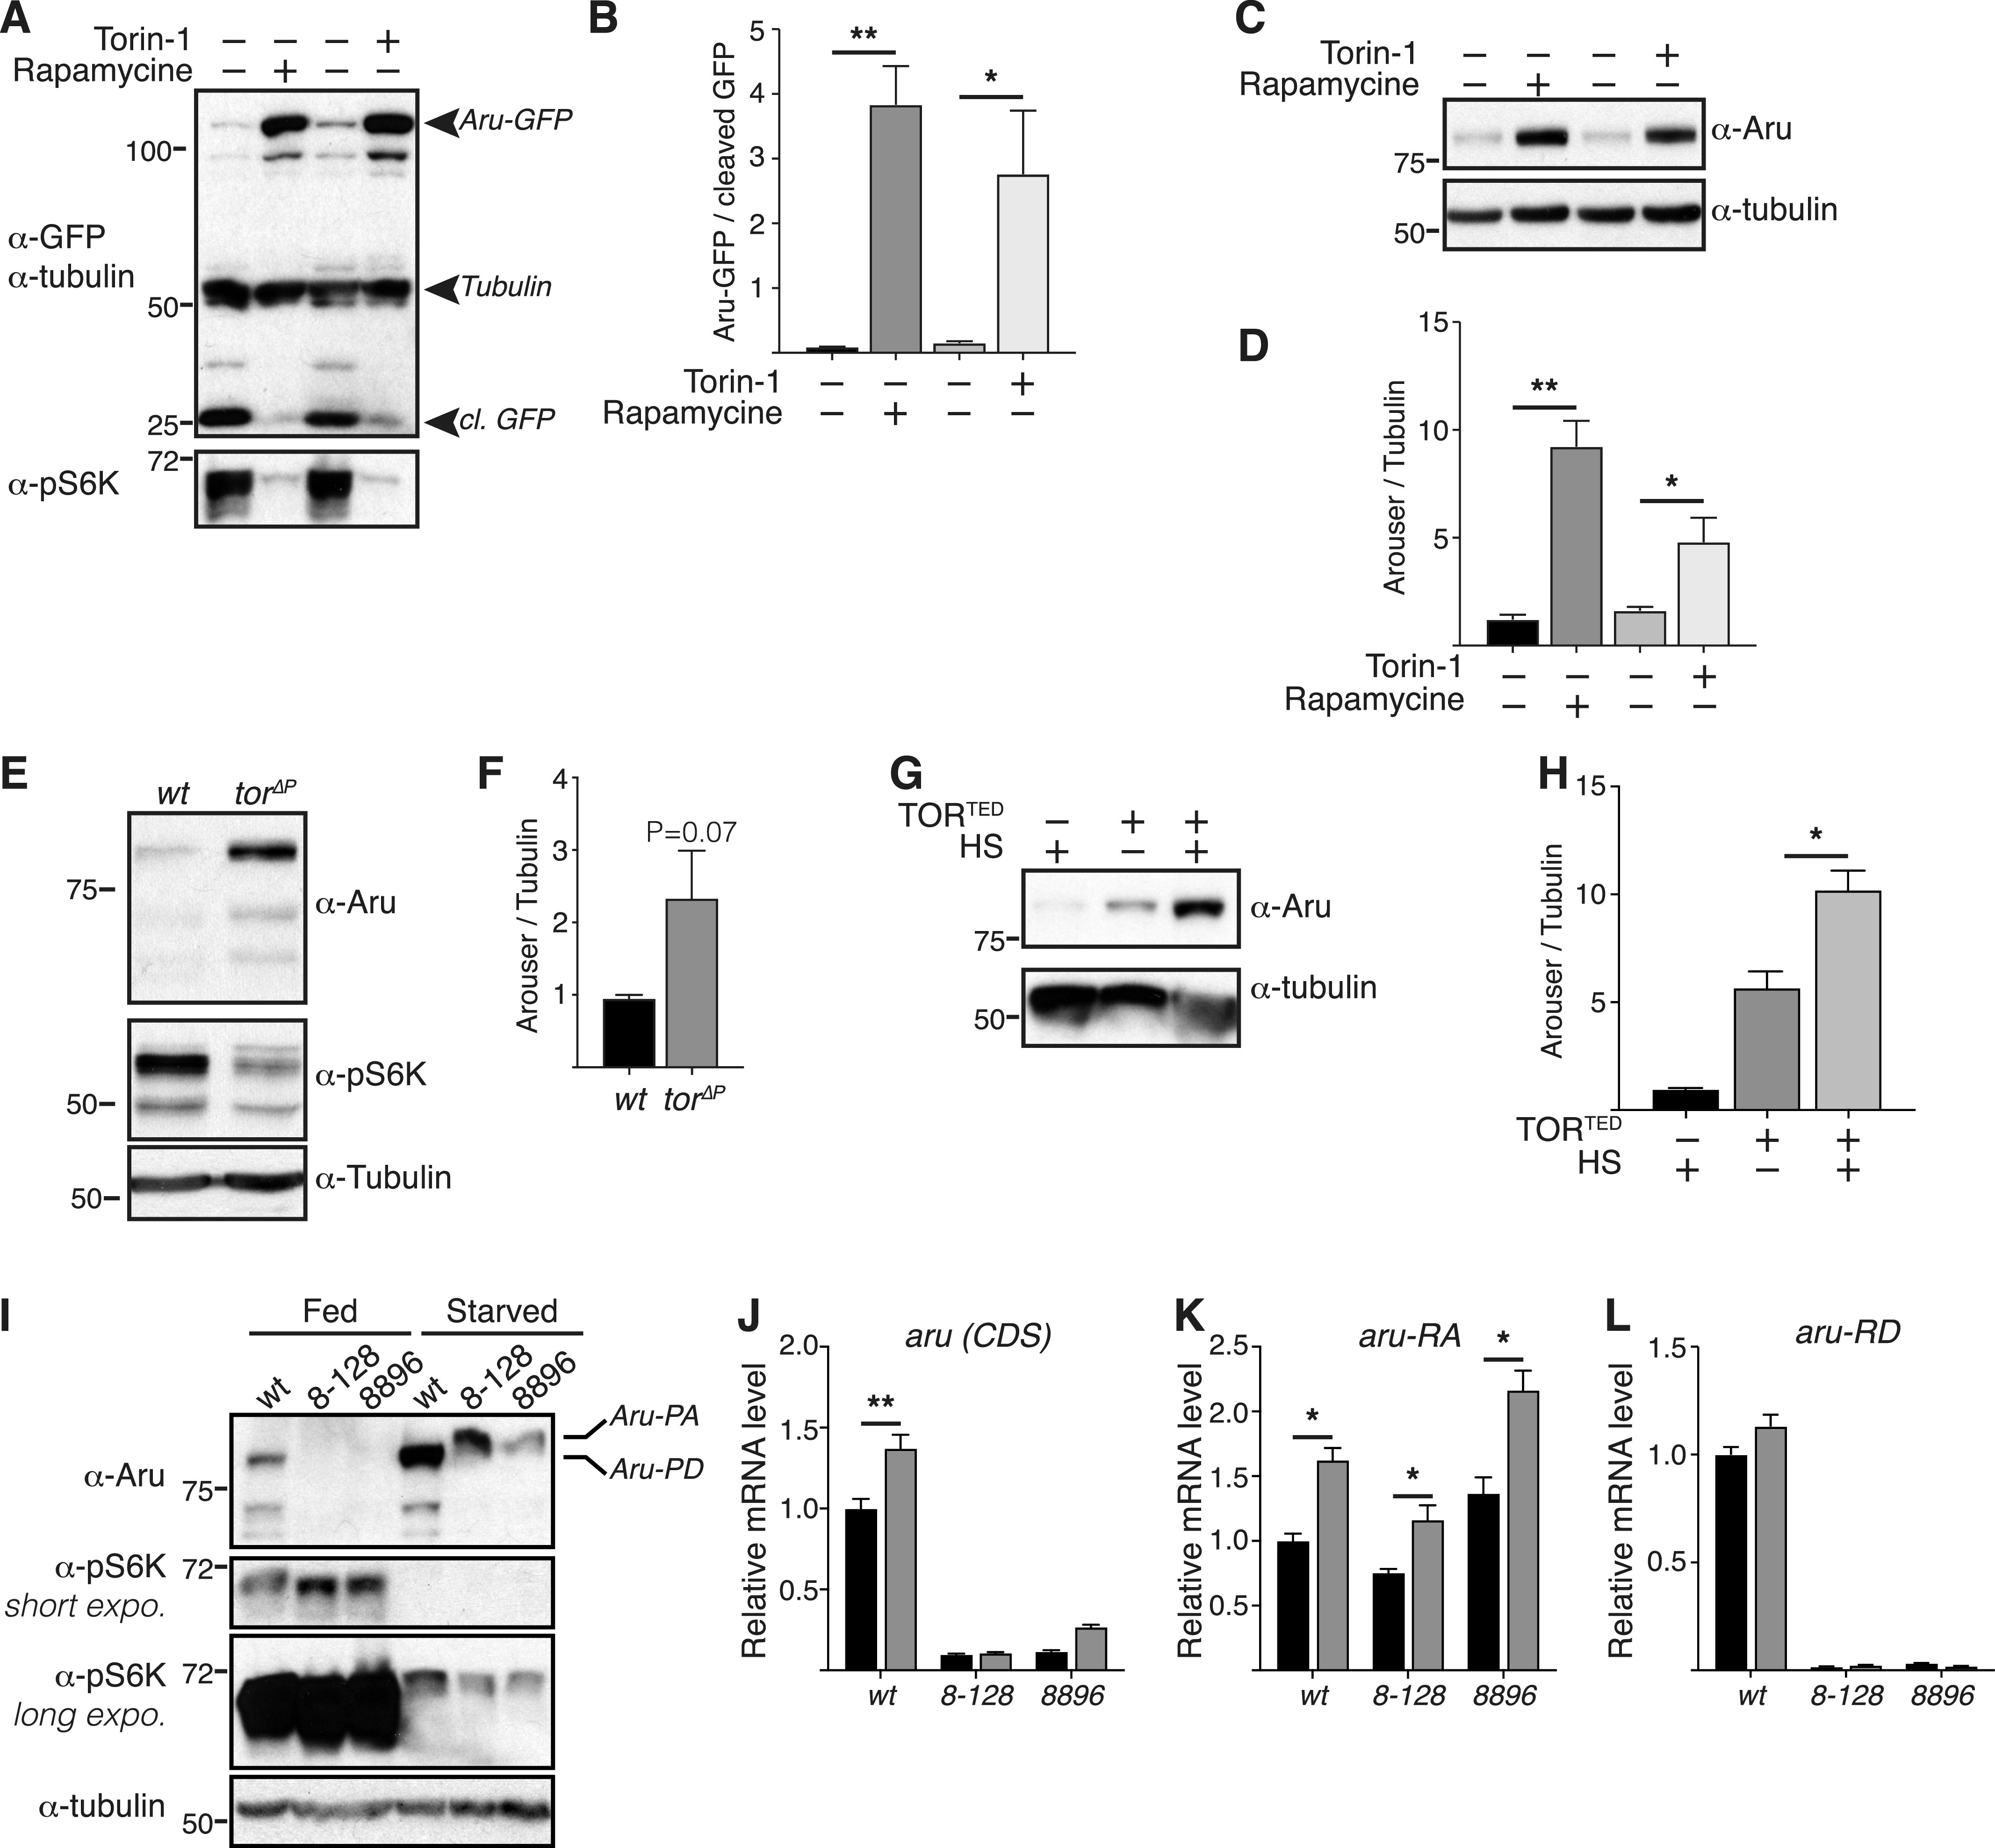
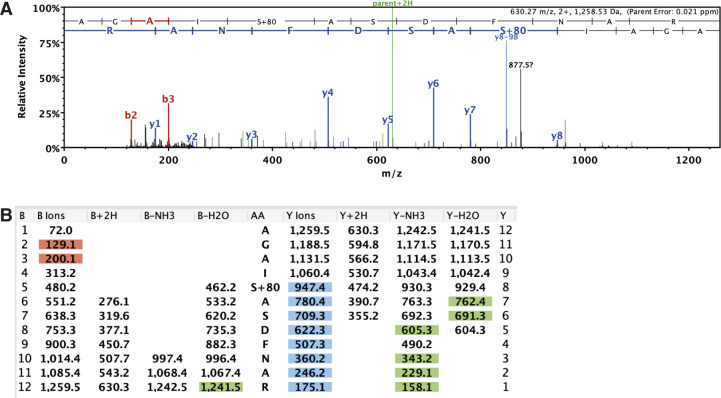
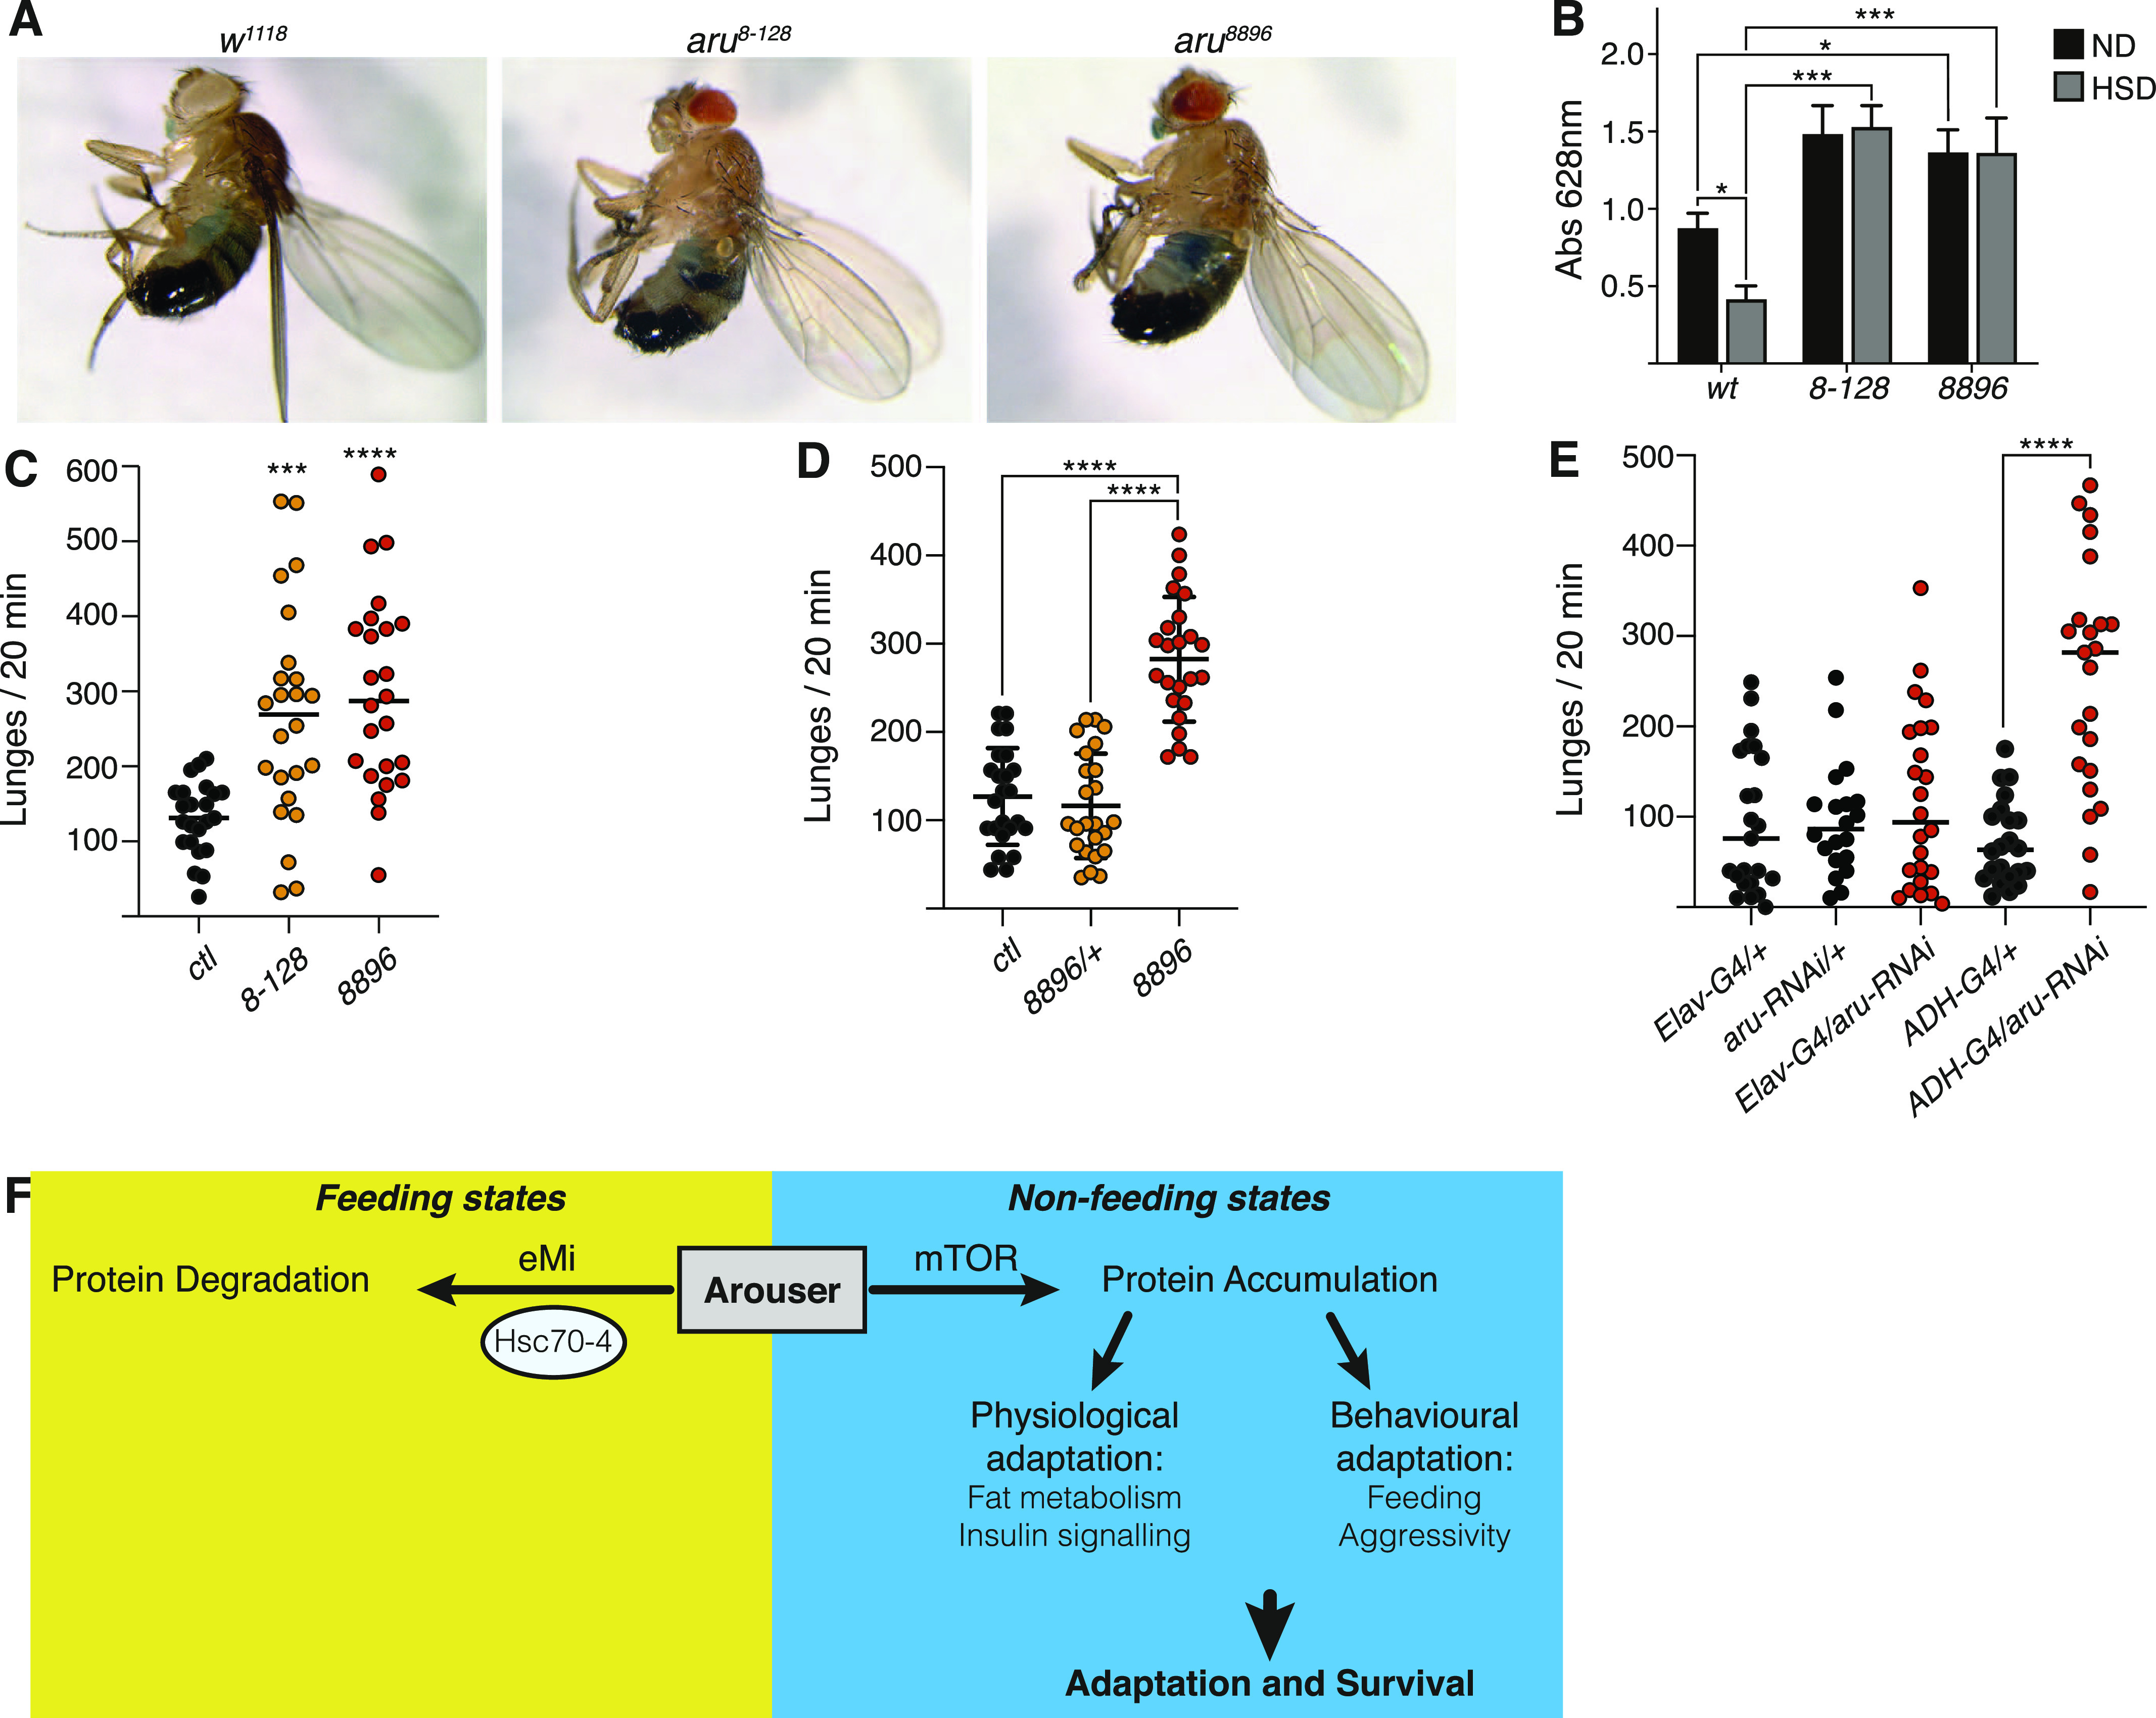
Hunger drives food-seeking behaviour and controls adaptation of organisms to nutrient availability and energy stores. Lipids constitute an essential source of energy in the cell that can be mobilised during fasting by autophagy. Selective degradation of proteins by autophagy is made possible essentially by the presence of LIR and KFERQ-like motifs. Using in silico screening of Drosophila proteins that contain KFERQ-like motifs, we identified and characterized the adaptor protein Arouser, which functions to regulate fat storage and mobilisation and is essential during periods of food deprivation. We show that hypomorphic arouser mutants are not satiated, are more sensitive to food deprivation, and are more aggressive, suggesting an essential role for Arouser in the coordination of metabolism and food-related behaviour. Our analysis shows that Arouser functions in the fat body through nutrient-related signalling pathways and is degraded by endosomal microautophagy. Arouser degradation occurs during feeding conditions, whereas its stabilisation during non-feeding periods is essential for resistance to starvation and survival. In summary, our data describe a novel role for endosomal microautophagy in energy homeostasis, by the degradation of the signalling regulatory protein Arouser.


Conflict of interest statement

The authors declare that they have no conflict of interest.

Figures

Figure S1.
Figure S1.. KFERQ-like motif-containing proteins were analysed by the PANTHER classification system.
(A, B, C, D, E, F, G, H) GO-slim classifications are shown for motif 1 ([KR][FILV][DE][KRFILV]Q) (A, B, C, D) and motif 2 (Q[KR][FILV][DE][KRFILV]) (E, F, G, H) with percentage of gene hits amongst the total genes for each function shown. (A, E) Biological process terms. (B, F) Cellular component terms. (C, G) Molecular function terms. (D, H) Protein class categories are defined in each key and in order as appears on the charts.
Figure 1.
Figure 1.. Arouser is a substrate for endosomal microautophagy.
(A) Domains and motif of Arouser protein. PTB, phosphotyrosine binding domain; SH3, SRC Homology 3 Domain. (B) Airyscan confocal section of a fat body cell from starved showing the colocalisation of Arouser-GFP (green) and LAMP1-3xmCherry (red). Scale bar: 2 μm. (C, D, E, F) Western blot analysis and quantification of endogenous Arouser protein in larvae fed for 24 h with chloroquine (C, D) or in larvae with defective lysosomes (E, F). (G, H, I, J, K) Analysis of endogenous Arouser in larvae with defective eMi (G, H, I) and eMi rescue (J, K); relative gene expression levels for hsc70-4 and aru are shown in (I). (L, M) Western blot analysis and quantification of wild-type (WT) and eMi-resistant (AA) Flag-Arouser expressed in the larval fat body. (N, O) Relative gene expression for aru pan-isoform (CDS) (N) and endogenous aru using primers specific to aru-RD isoform (O) in flies expressing Flag-Aru wild-type (WT) and eMi mutant (AA); w1118 flies were used as negative control. Bar charts show means ± s.d. Statistical significance was determined using one-way ANOVA, *P < 0.05, **P < 0.01, ***P < 0.001.
Figure S2.
Figure S2.. Arouser is associated with endosomal microautophagy.
(A) Confocal section of larval fat bodies from 4-h starved or fed larvae expressing Arouser-GFP (green) and the lysosomal marker LAMP1-3xmCherry (red). Nuclei were stained with Hoechst (blue). Scale bar: 50 μm. (B, C) Quantification of the number of Arouser-GFP dots per cells (B) and colocalisation ration between Arouser-GFP and LAMP1-3xmCherry (C). Box and whiskers charts show the distribution and s.d. of all the samples. (D, E) Western blot analysis and quantification of Arouser protein level in Atg1 and Atg13 knockdown larvae post heat-shock. The expression of a GFP control was used to ensure the efficiency of the heat shock. (F) Relative gene expression of Atg1 and Atg13 in control and RNAi expressing larvae. (G) Colocalisation of Arouser-GFP and mCherry-Atg1 in larval fat body cells. Scale bars: 10 μm. (H) Western blot analysis of Arouser protein level in fed larvae expressing RNAi against ESCRT components Stam and Vps25 essential for eMi. (I) Western blot analysis of Arouser protein level in fed and 4 h starved larvae overexpressing HA-Hsc70-4WT or HA-Hsc70-43KA in the fat body. (J, K, L, M) Representative pictures (J, K, L, scale bars: 10 μm) and quantification (M) of PA-puncta in 24 h starved wild-type (wt) and aru mutant larvae. Bar charts show means ± s.d. Statistical significance was determined using one-way ANOVA and based on at least three independent biological replicates, *P < 0.05.
Figure S3.
Figure S3.. Arouser interacts with Atg8a.
(A) Putative xLIR motifs in Arouser identified using the iLIR web-resource. (B) Colocalisation (arrowheads) of Arouser-GFP and mCherry-Atg8a in larval fat body cells. Scale bars: 10 μm. (C) Co-immunoprecipitation between endogenous Arouser and Atg8a in adult flies. (D) GST pull-down assay between GST-tagged Atg8a-WT or -LIR docking site mutant (K48A and Y49A), and radiolabelled myc-Arouser. (E, F) Western blot analysis of endogenous Arouser protein level in fed Atg8a (E) and Atg7 (F) mutant larvae.
Figure S4.
Figure S4.. Loss of Arouser function does not affect macroautophagy.
(A, A′, B, B′) Confocal sections of fat body cells from fed larvae expressing a control (A, A′) or aru (B, B′) RNAi concomitantly with mCherry-Atg8a marker. (C, C′, C″, D, D′, D″) Confocal sections of fat body cells from 4 h starved larvae expressing a control (C, C′, C″) or aru (D, D′, D″) RNAi concomitantly with mCherry-GFP-Atg8a marker. (E, F, G, H, I, J) Confocal sections of fat body from fed (E, F, G) or 4 h starved (H, I, J) larvae stained with Lysotracker-Red.
Figure 2.
Figure 2.. Arouser is involved in resistance to starvation.
(A, C) Western blot analysis of endogenous (A) and overexpressed (C) Arouser in fed and 4–24 h starved larvae. (B) Analysis of aru mRNA levels in fed and starved larvae. Bar chart shows means ± s.d. Statistical significance was determined using two-tailed t test. (D, E) Survival of a 100 wild-type (w1118) and aru mutant males fed on 5% sucrose (D) or water only (E). (F) Proportion of pupae form when well-fed second instar larvae are transferred onto water pads. (G) Survival on water only of the Arouser rescue line (rescue) compare with the corresponding mutant aru8-128. (H) Western blot validation of the rescue line compared with wild-type and aru8-128 mutant in fed and 4 h starved larvae. (I) Relative aru gene expression using primers that recognise endogenous and overexpressed aru (CDS) and primers specific for endogenous arouser (aru-RD). Bar chart shows means ± s.d. Statistical significance was determined using one-way ANOVA and based on at least three independent biological replicates, *P < 0.05.
Figure 3.
Figure 3.. Arouser functions downstream mTOR.
(A, B, C, D) Western blot analysis and quantification of overexpressed Arouser-GFP (A, B) and endogenous Arouser (C, D) protein level in larvae fed for 24 h with Torin-1 or rapamycin supplemented food. (E, F) Western blot analysis and quantification of Arouser protein in larvae lacking mTOR (torP). (G, H) Western blot analysis and quantification of Arouser protein level in larvae transiently expressing a kinase dead version of TOR (TORTED) following heat shock (HS). (I) Western blot analysis of phosphorylated-S6K (p-S6K) in fed and 24 h starved wild-type (wt) and aru8-128 and aru8896 mutant larvae. (J, K, L) Relative aru gene expression in fed and 24 h starved larvae using primer sets that recognise either both aru isoforms (J), or are specific of aru-RA (K) and aru-RD (L) isoforms. Bar charts show means ± s.d. Statistical significance was determined using two-tailed t test and based on at l–east three independent biological replicates, *P < 0.05, **P < 0.01. Survival experiments show the death rate of at least 100 age- and gender-matched flies per condition. Statistical significance of fly survival was calculated using a Gehan–Breslow–Wilcoxon test.
Figure S5.
Figure S5.. Arouser is phosphorylated at residue Ser562.
(A) Spectrum of phosphorylated peptide. (B) Fragmentation table.
Figure 4.
Figure 4.. Arouser is associated with insulin signalling.
(A, B) Relative gene expression for dilp6 (A) and dilp2 (B) in fed and 24 h starved wild-type and aru mutant larvae. Bar chart shows means ± s.d. Statistical significance was determined using one-way ANOVA and based on triplicates, *P < 0.05, **P < 0.01, ***P < 0.001.
Figure 5.
Figure 5.. Arouser-deficient flies have a deficit in lipid.
(A, B, C, D) Confocal section and quantification of the size of the lipid droplets in the fat bodies from fed wild-type and aru mutant larvae (A, B) and adult males (C, D) stained with Bodipy (A) or Oil Red O (C). (E) TAG quantification in adult wilt-type and aru mutant males. (F, G) Analysis of relative mRNA levels for genes involved in lipid mobilisation (F) and storage (G) in 4 h starved larvae. (H, I) Confocal section and quantification of the size of the lipid droplets in the fat bodies from wild-type, aru mutant and rescue larvae. Tissues were stained with Oil Red O (red) and Hoechst (blue). (J) TAG quantification in fed adult aru rescued males. (K) Analysis of relative mRNA levels for genes involved in lipid metabolism in aru mutant and rescued 4 h starved larvae. Bar charts show means ± s.d. Statistical significance was determined using one-way ANOVA and based on at least three independent biological replicates, *P < 0.05, **P < 0.01, ***P < 0.001. For microscopy analysis, tissues from at least 10 animals from three independent biological replicates were analysed.
Figure S6.
Figure S6.. Arouser-deficient flies are unable to store excess of lipid on high sugar diet (HSD).
(A) Confocal section of fat body from larvae fed on normal diet or HSD and stained for lipid droplets with Bodipy. (B) Quantification of the size of lipid droplets. Bar chart shows means ± s.d. Statistical significance was determined using two-tailed t test where the mean between for normal diet and HSD were compared for each genotype individually. Tissues from at least 10 animals from three independent biological replicates were analysed.
Figure S7.
Figure S7.. hsc70-4 loss-of-function and Aru overexpression does not affect the size of lipid droplets.
(A, C) Confocal section of larval fat body stained for lipid droplets with Bodipy. (B) Quantification of the size of lipid droplets. Bar chart shows means ± s.d. No statistical difference was observed using one-way ANOVA test.
Figure 6.
Figure 6.. Feeding, activity and aggressiveness behaviours are affected in aru-deficient flies.
(A, B) Relative quantification of the amount of food ingested by wild-type (wt) and aru mutant adult males fed on normal or high sugar diet. (A) Representative picture of flies after ingestion of coloured food are shown in (A). Bar chart shows means ± s.d. Statistical significance was determined using two-way ANOVA and based on the analysis of 20–40 individuals, *P < 0.05, **P < 0.01, ***P < 0.001. (C) Comparison of the number of lunges per 20 min for aru mutants. (D) Comparison of the number of lunges per 20 min heterozygote and homozygote aru8896 mutants. (E) Comparison of the number of lunges per 20 min of flies silenced for aru specifically in the brain (Elav-G4) or fat body (ADH-G4). For the analysis of aggression phenotype (C, D, E), all the individual recordings are shown on charts. (F) Model of the balance between degradation and stabilisation of Arouser, and it’s implication in fly adaptation and survival during non-feeding states.

References

    1. Arndt V, Dick N, Tawo R, Dreiseidler M, Wenzel D, Hesse M, Furst DO, Saftig P, Saint R, Fleischmann BK, et al. (2010) Chaperone-assisted selective autophagy is essential for muscle maintenance. Curr Biol 20: 143–148. 10.1016/j.cub.2009.11.022 - DOI - PubMed
    1. Bai H, Kang P, Tatar M (2012) Drosophila insulin-like peptide-6 (dilp6) expression from fat body extends lifespan and represses secretion of Drosophila insulin-like peptide-2 from the brain. Aging Cell 11: 978–985. 10.1111/acel.12000 - DOI - PMC - PubMed
    1. Bartlett BJ, Isakson P, Lewerenz J, Sanchez H, Kotzebue RW, Cumming RC, Harris GL, Nezis IP, Schubert DR, Simonsen A, et al. (2011) p62, Ref(2)P and ubiquitinated proteins are conserved markers of neuronal aging, aggregate formation and progressive autophagic defects. Autophagy 7: 572–583. 10.4161/auto.7.6.14943 - DOI - PMC - PubMed
    1. Beller M, Bulankina AV, Hsiao HH, Urlaub H, Jackle H, Kuhnlein RP (2010) PERILIPIN-dependent control of lipid droplet structure and fat storage in Drosophila. Cell Metab 12: 521–532. 10.1016/j.cmet.2010.10.001 - DOI - PubMed
    1. Burnett PE, Barrow RK, Cohen NA, Snyder SH, Sabatini DM (1998) RAFT1 phosphorylation of the translational regulators p70 S6 kinase and 4E-BP1. Proc Natl Acad Sci U S A 95: 1432–1437. 10.1073/pnas.95.4.1432 - DOI - PMC - PubMed

Publication types

LinkOut - more resources