. 2020 Dec 29;117(52):33474-33485.
doi: 10.1073/pnas.2009192117. Epub 2020 Dec 14.

Machine-learning-driven biomarker discovery for the discrimination between allergic and irritant contact dermatitis

Affiliations

Machine-learning-driven biomarker discovery for the discrimination between allergic and irritant contact dermatitis

Vittorio Fortino et al. Proc Natl Acad Sci U S A. .

Abstract

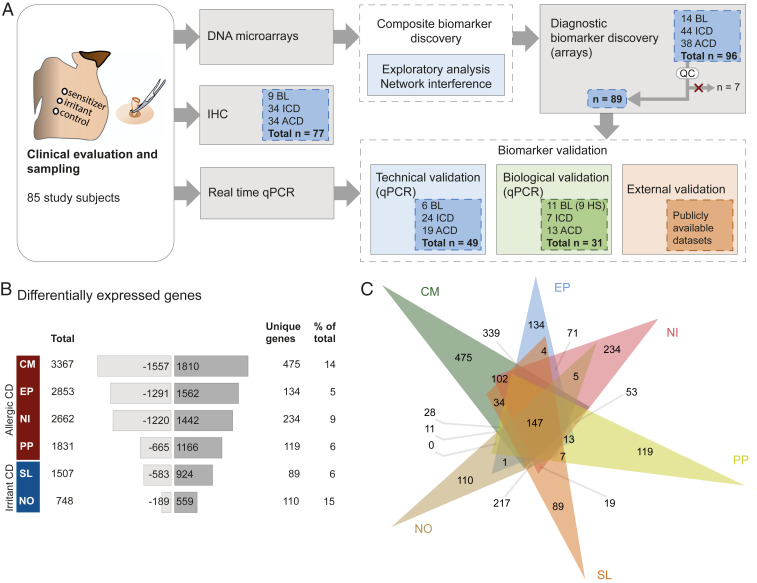
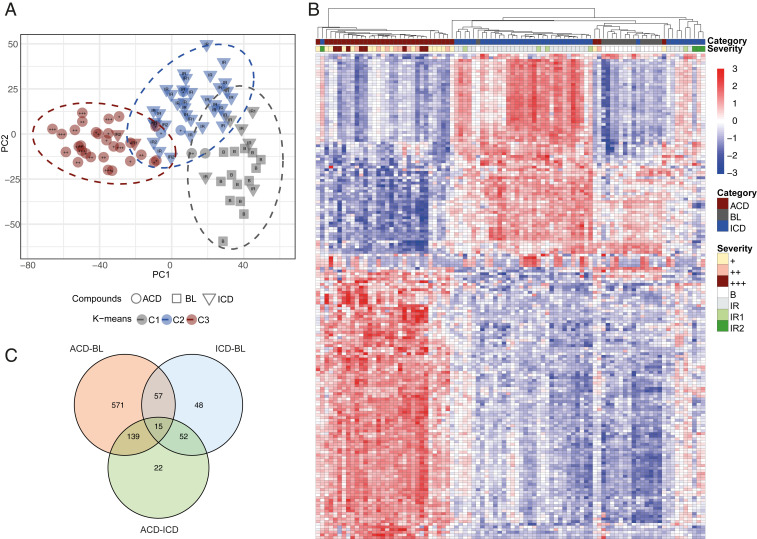
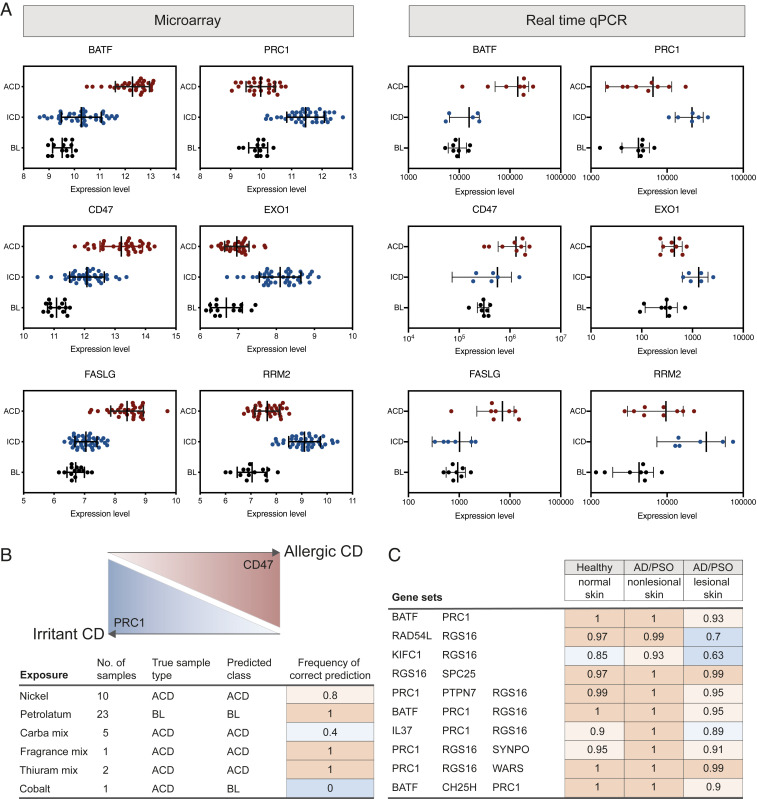
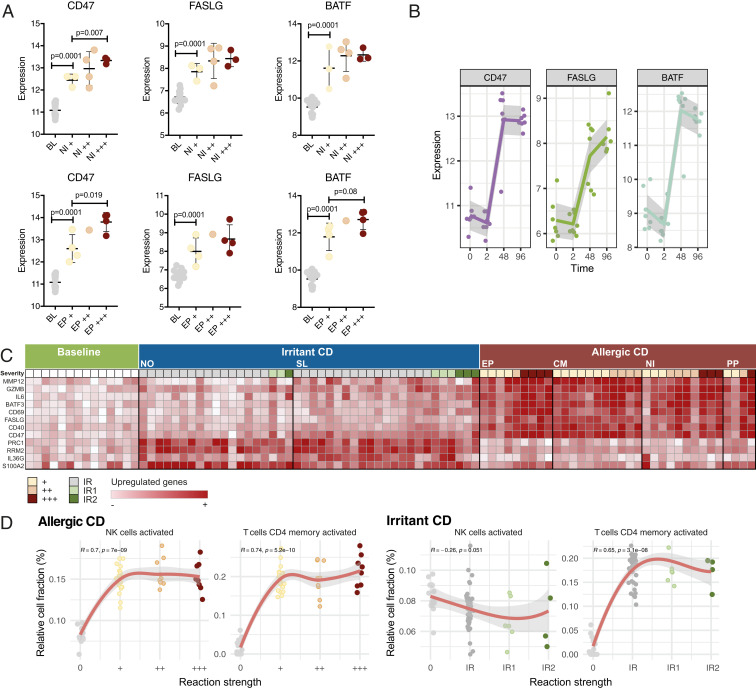
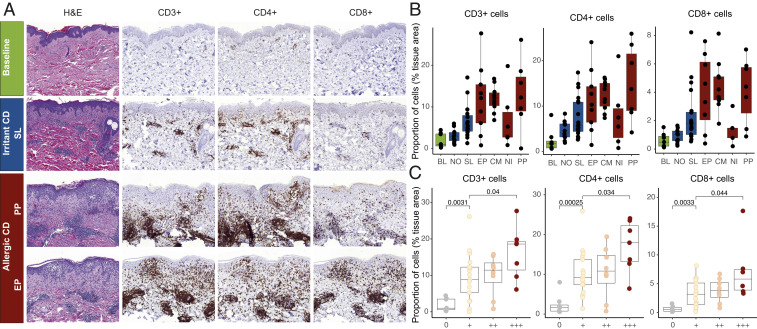
Contact dermatitis tremendously impacts the quality of life of suffering patients. Currently, diagnostic regimes rely on allergy testing, exposure specification, and follow-up visits; however, distinguishing the clinical phenotype of irritant and allergic contact dermatitis remains challenging. Employing integrative transcriptomic analysis and machine-learning approaches, we aimed to decipher disease-related signature genes to find suitable sets of biomarkers. A total of 89 positive patch-test reaction biopsies against four contact allergens and two irritants were analyzed via microarray. Coexpression network analysis and Random Forest classification were used to discover potential biomarkers and selected biomarker models were validated in an independent patient group. Differential gene-expression analysis identified major gene-expression changes depending on the stimulus. Random Forest classification identified CD47, BATF, FASLG, RGS16, SYNPO, SELE, PTPN7, WARS, PRC1, EXO1, RRM2, PBK, RAD54L, KIFC1, SPC25, PKMYT, HISTH1A, TPX2, DLGAP5, TPX2, CH25H, and IL37 as potential biomarkers to distinguish allergic and irritant contact dermatitis in human skin. Validation experiments and prediction performances on external testing datasets demonstrated potential applicability of the identified biomarker models in the clinic. Capitalizing on this knowledge, novel diagnostic tools can be developed to guide clinical diagnosis of contact allergies.

Keywords: allergic contact dermatitis; artificial intelligence; biomarker; irritant contact dermatitis; machine learning.


Conflict of interest statement

The authors declare no competing interest.

Figures

Fig. 1.
Fig. 1.
Overview of the study scheme and numbers of DEGs in human skin after exposure to allergens and irritants. (A) Schematic illustration of the study design, including total number of study participants (leftmost panel) and number of samples included in each assay (all other panels). Biomarker validation was performed at three levels: Technical (samples used in microarray) and biological validation (independent group of patients) by real-time qPCR, and external validation by testing the performance of the identified biomarkers (external datasets). (B) Numbers of DEGs, including the total number of genes, number of down- and up-regulated genes, and the number and ratio of unique genes. (C) Venn diagram depicting overlaps between exposure groups.
Fig. 2.
Fig. 2.
CIBERSORT analysis of the accumulation of leukocytes in treated skin areas based on the transcriptomes. (A) Overview of estimated cell fractions from gene-expression signatures. (B) Significantly changed estimated cell populations after chemical exposure. Boxplots display the mean and ± SD of estimated cell fractions. P values were generated by CIBERSORT using Monte Carlo sampling and the null hypothesis was tested by Pearson correlation. *P < 0.01; **P < 0.001; ***P < 0.0001; ****P < 0.00001.
Fig. 3.
Fig. 3.
The grouping of transcriptomes. The clustering of samples was analyzed by (A) using PCA and k-means algorithms, and by (B) hierarchical clustering, revealing three clearly separated groups; ACD, ICD, and BL. Reaction strength is graded +, ++, or +++ and IR, IR1, and IR2 for ACD and ICD reactions, respectively. In this figure, the reaction strength of BL samples (no reaction) is called “B.” (C) Venn diagram illustrating overlaps of DEGs between ACD and BL, ICD and BL, and ACD and ICD.
Fig. 4.
Fig. 4.
Network analysis of coexpressed genes associated with ACD or ICD. Networks were inferred based on the transcriptomes identified for positive patch tests against (A) allergens or (B) irritants. The networks were generated and visualized using the INfORM platform. Genes were considered linked in the network, if their expression profiles correlated positively (red edges) or negatively (blue edges). Modules in the network were defined based on the similarity of the gene expression profiles, and the indicated direction of gene expression (black arrow, up-regulated; light grey arrow, down-regulated) is based on average fold-changes of all genes of each module. Top enriched functions were identified by using EnrichR.
Fig. 5.
Fig. 5.
Validation of biomarkers selected by GARBO. (A) Expression levels of selected biomarkers measured by arrays (panels on the Left) and validated by real time qPCR in an independent group of patients (panels on the Right). Error bars correspond to SD. Selected combinations of biomarkers were tested in external datasets of (B) ACD (access code GSE60028) and (C) atopic dermatitis (AD) and psoriasis (PSO) (access code E-MTAB-8149), revealing predictive potential of the biomarkers, reported as the frequency of correct prediction. GSE60028 was used to demonstrate the generalizability of the selected biomarker models on new, external ACD samples; the second external testing dataset (E-MTAB-8149) aimed to prove the uncertainty of the biomarker models when trying to classify lesional and nonlesional skin in psoriasis and atopic dermatitis.
Fig. 6.
Fig. 6.
Biomarker expression and leukocyte infiltration as a function of severity and time. (A) The expression of selected biomarkers in response to NI (Upper) and EP (Lower) relative to severity. P values were generated by unpaired t test and error bars correspond to SD. (B) The expression of selected biomarkers at time points 2, 48, and 96 h after NI exposure. (C) An overview of ACD and ICD associated key genes in relation to reaction strength (allergic reactions graded +, ++, or +++; irritant reactions graded IR, IR1, or IR2). (D) Spearman’s rank correlation between the proportion of immune cells (estimated by deconvolution analysis of transcriptomes) and reaction strengths reveal dependence of both ACD and ICD on activated CD4 memory T cells, but of ACD only, on activated NK cells.
Fig. 7.
Fig. 7.
IHC staining of chemical exposed human skin. (A) Representative images of BL, SL-, PP-, and EP-exposed samples (original magnification ×10) displaying a larger infiltration of CD3+, CD4+, and CD8+ cells in response to allergen exposure (PP and EP). (B) Positively stained cells identified by deep learning algorithms for each exposure group. Groups were compared using Dunn’s multiple comparison test (results available in SI Appendix, Table S6). (C) Significant association between T lymphocyte infiltration and the severity of the reaction (graded +, ++, and +++). Statistical analysis was performed using Mann–Whitney U test and P values of <0.05 were considered significant. Boxplots display mean, and first and third quartiles.

References

    1. Keegel T., Moyle M., Dharmage S., Frowen K., Nixon R., The epidemiology of occupational contact dermatitis (1990-2007): A systematic review. Int. J. Dermatol. 48, 571–578 (2009). - PubMed
    1. Diepgen T. L., et al. , Prevalence of contact allergy in the general population in different European regions. Br. J. Dermatol. 174, 319–329 (2016). - PubMed
    1. Carøe T. K., Ebbehøj N. E., Bonde J. P., Agner T., Occupational hand eczema and/or contact urticaria: Factors associated with change of profession or not remaining in the workforce. Contact Dermat. 78, 55–63 (2018). - PubMed
    1. Moberg C., Alderling M., Meding B., Hand eczema and quality of life: A population-based study. Br. J. Dermatol. 161, 397–403 (2009). - PubMed
    1. Tan C. H., Rasool S., Johnston G. A., Contact dermatitis: Allergic and irritant. Clin. Dermatol. 32, 116–124 (2014). - PubMed

Publication types

MeSH terms