

Predicting long-term dynamics of soil salinity and sodicity on a global scale
- PMID: 33318212
- PMCID: PMC7776813
- DOI: 10.1073/pnas.2013771117
Predicting long-term dynamics of soil salinity and sodicity on a global scale
Abstract
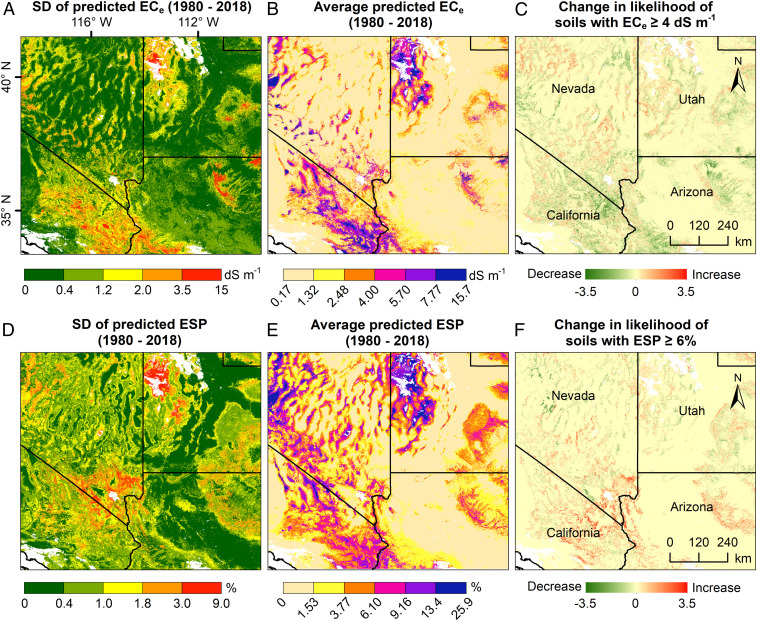
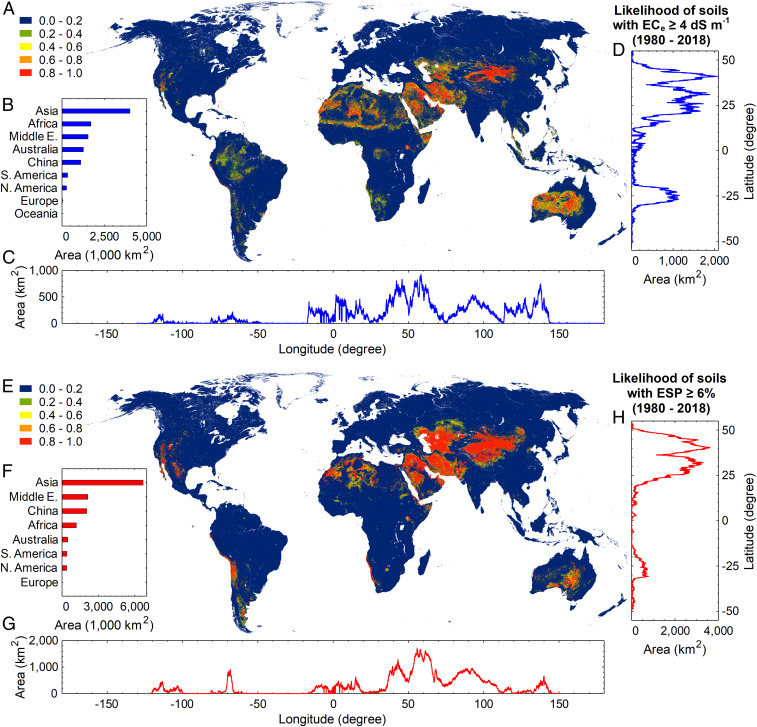
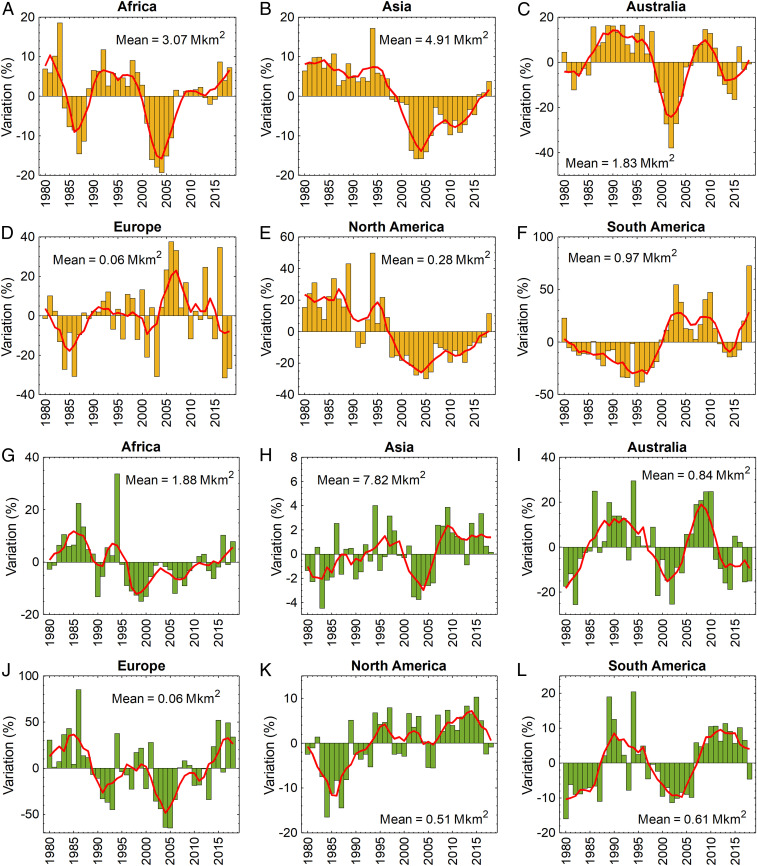
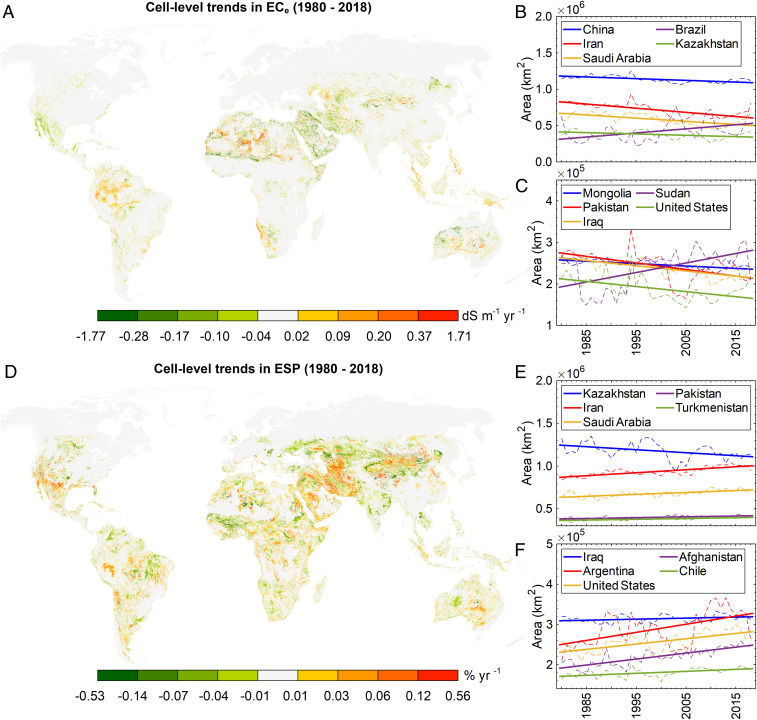
Knowledge of spatiotemporal distribution and likelihood of (re)occurrence of salt-affected soils is crucial to our understanding of land degradation and for planning effective remediation strategies in face of future climatic uncertainties. However, conventional methods used for tracking the variability of soil salinity/sodicity are extensively localized, making predictions on a global scale difficult. Here, we employ machine-learning techniques and a comprehensive set of climatic, topographic, soil, and remote sensing data to develop models capable of making predictions of soil salinity (expressed as electrical conductivity of saturated soil extract) and sodicity (measured as soil exchangeable sodium percentage) at different longitudes, latitudes, soil depths, and time periods. Using these predictive models, we provide a global-scale quantitative and gridded dataset characterizing different spatiotemporal facets of soil salinity and sodicity variability over the past four decades at a ∼1-km resolution. Analysis of this dataset reveals that a soil area of 11.73 Mkm2 located in nonfrigid zones has been salt-affected with a frequency of reoccurrence in at least three-fourths of the years between 1980 and 2018, with 0.16 Mkm2 of this area being croplands. Although the net changes in soil salinity/sodicity and the total area of salt-affected soils have been geographically highly variable, the continents with the highest salt-affected areas are Asia (particularly China, Kazakhstan, and Iran), Africa, and Australia. The proposed method can also be applied for quantifying the spatiotemporal variability of other dynamic soil properties, such as soil nutrients, organic carbon content, and pH.
Keywords: global scale modeling; machine learning; soil salinity; soil salinization; soil sodicity.
Copyright © 2020 the Author(s). Published by PNAS.
Conflict of interest statement
The authors declare no competing interest.
Figures
References
-
- Abrol I., Yadav J. S. P., Massoud F., Salt-Affected Soils and Their Management (Food & Agriculture Organization, Rome, 1988).
-
- Bleam W. F., Soil and Environmental Chemistry (Academic Press, 2016).
-
- Rengasamy P., World salinization with emphasis on Australia. J. Exp. Bot. 57, 1017–1023 (2006). - PubMed
-
- Ponnamperuma F., “Role of cultivar tolerance in increasing rice production on saline lands” in Salinity Tolerance in Plants: Strategies for Crop Improvement, Staples R. C., Thoenniessen G. H., Eds. (Wiley, New York, 1984), pp. 255–272.
-
- Metternicht G., “Soils: Salinization” in International Encyclopedia of Geography: People, the Earth, Environment and Technology, Richardson D. et al., Eds. (Wiley, 2016), pp. 1–10.
Publication types
Associated data
LinkOut - more resources
Full Text Sources
Miscellaneous
