. 2020 Dec 9;13(2):2397-2417.
doi: 10.18632/aging.202269. Epub 2020 Dec 9.

Immune profile of the tumor microenvironment and the identification of a four-gene signature for lung adenocarcinoma

Affiliations

Immune profile of the tumor microenvironment and the identification of a four-gene signature for lung adenocarcinoma

Tao Fan et al. Aging (Albany NY). .

Abstract

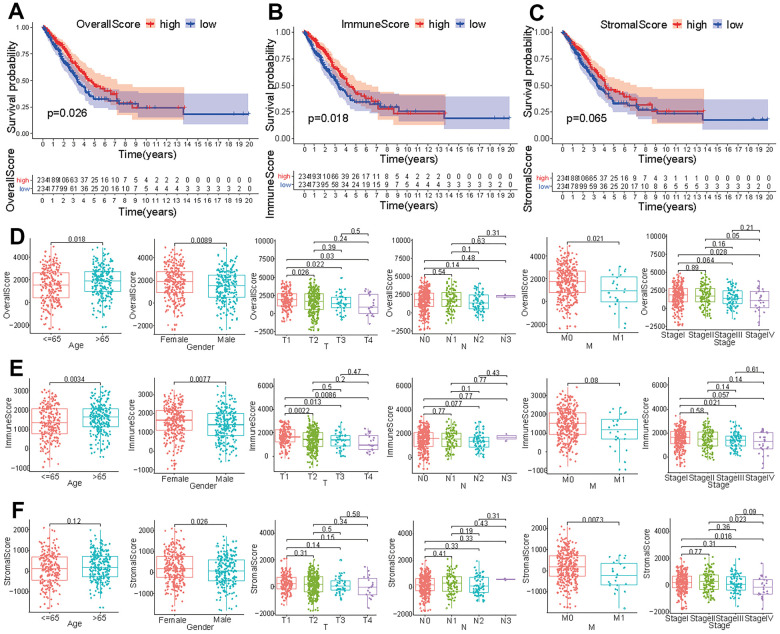
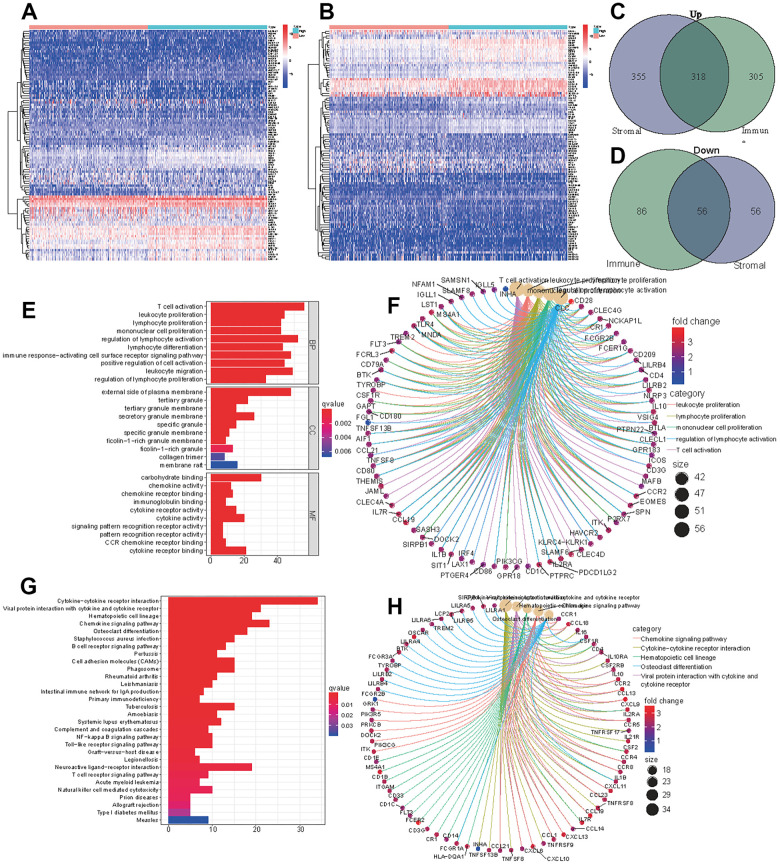
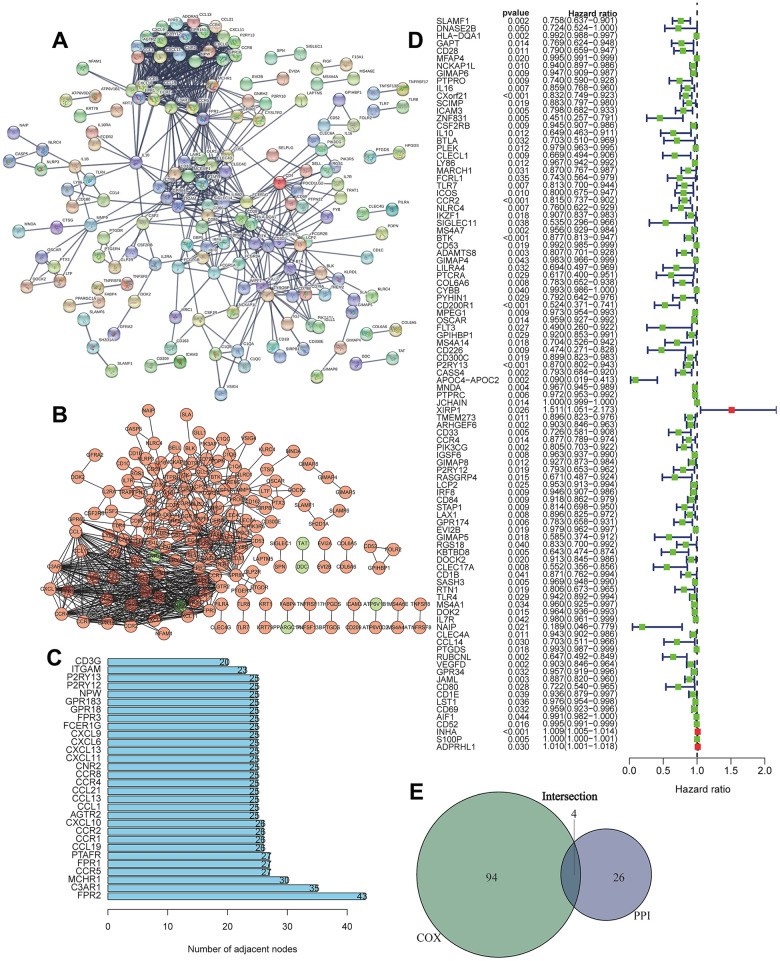
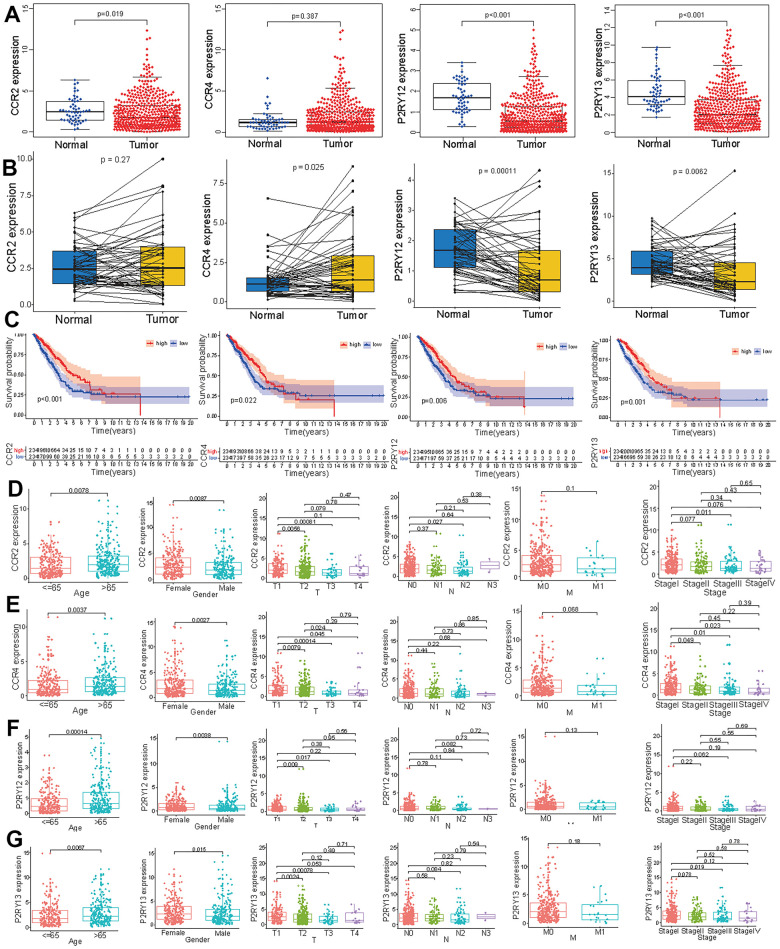
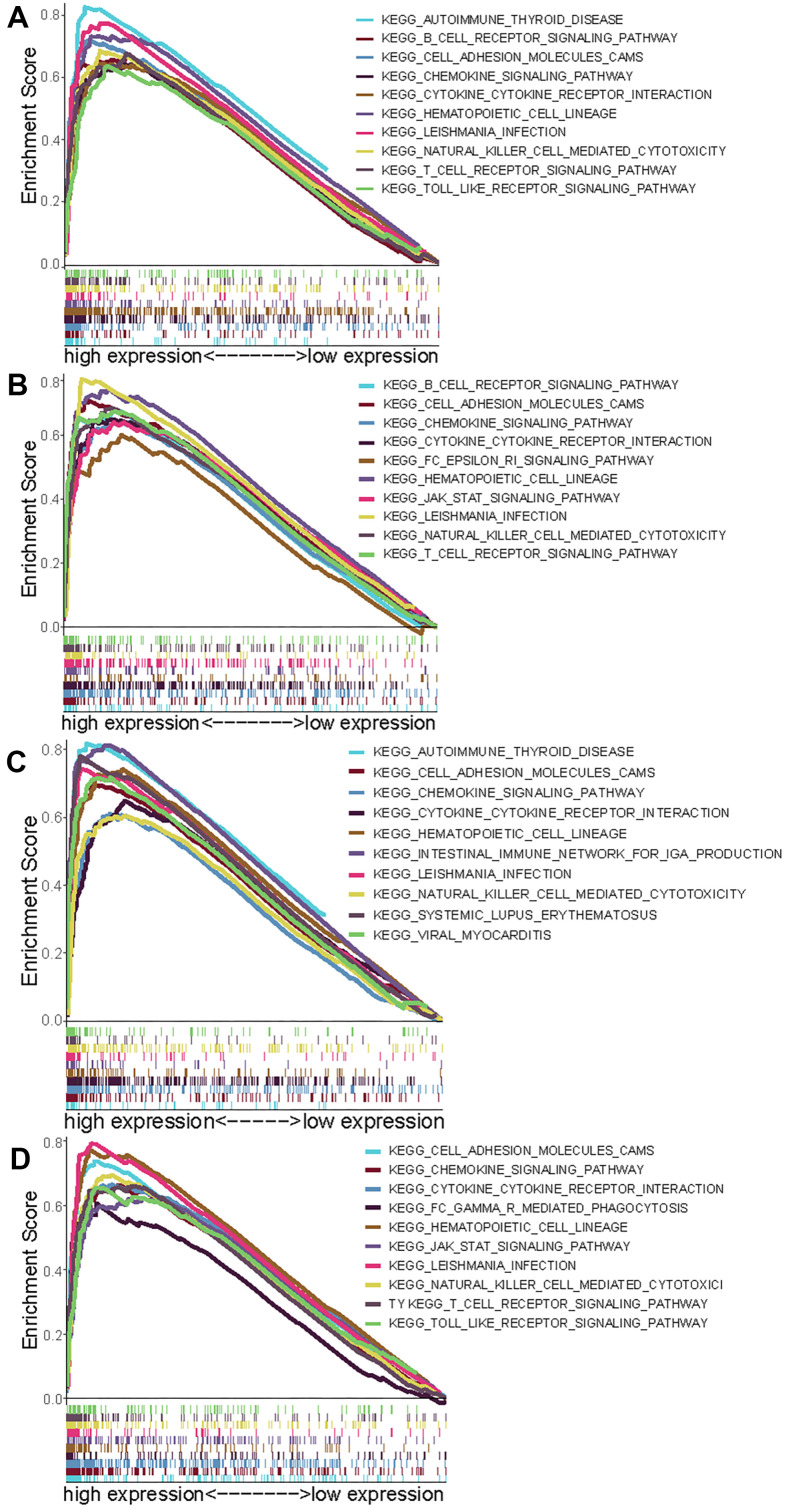
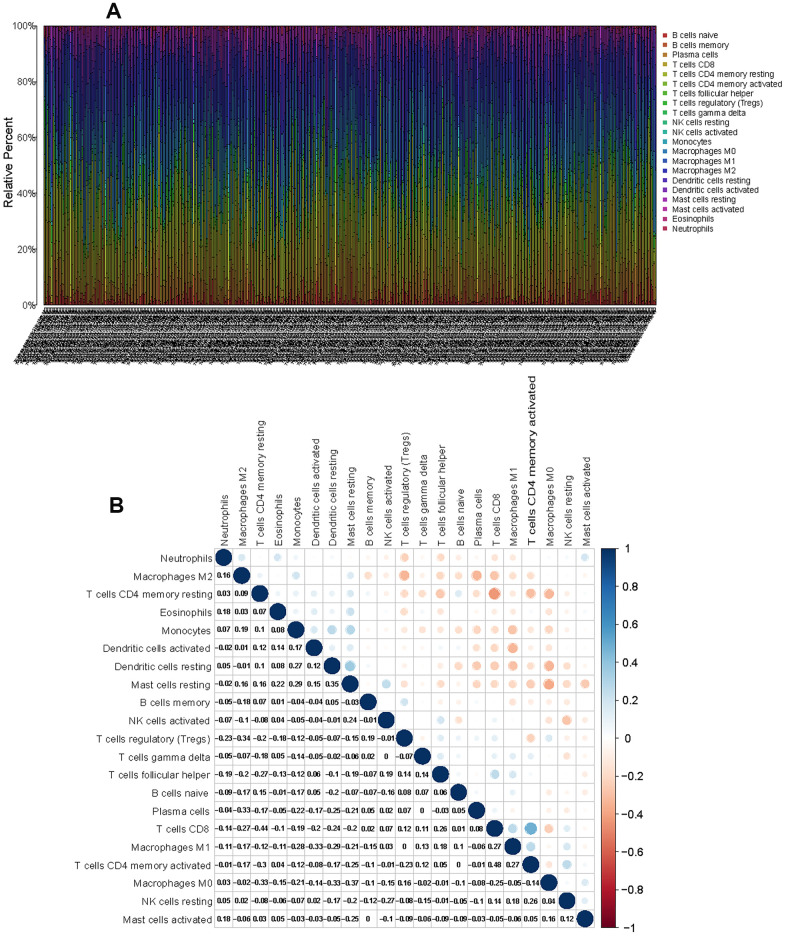
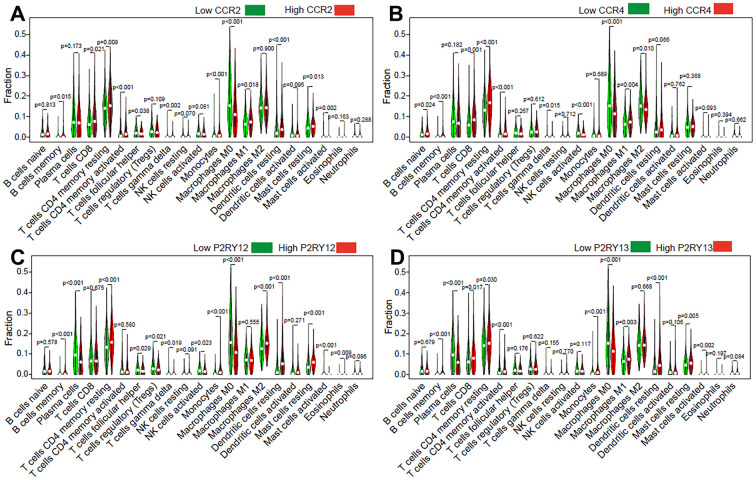
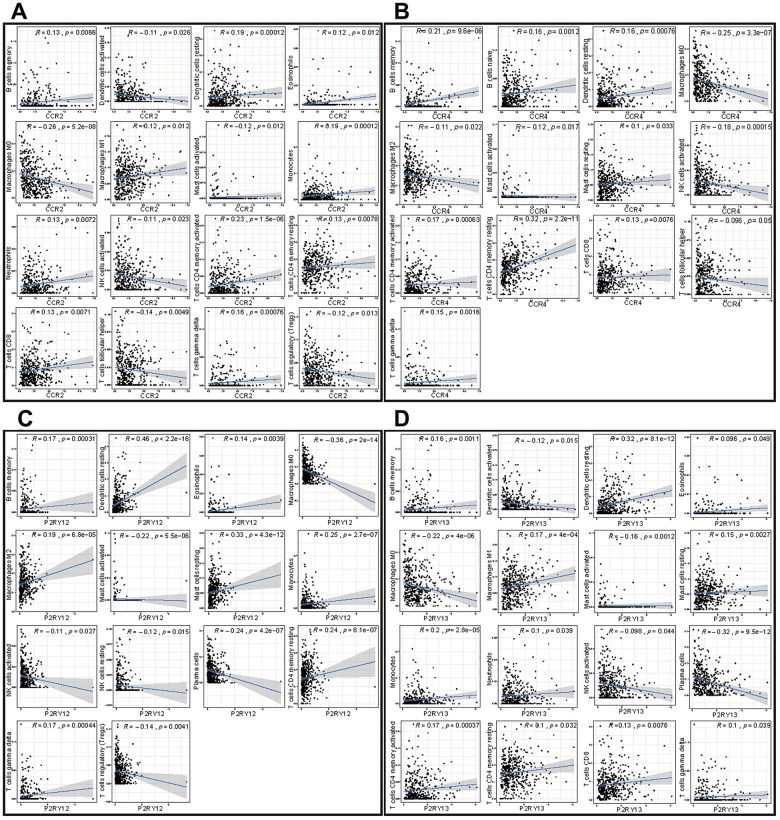
The composition and relative abundances of immune cells in the tumor microenvironment are key factors affecting the progression of lung adenocarcinomas (LUADs) and the efficacy of immunotherapy. Using the cancer gene expression dataset from The Cancer Genome Atlas (TCGA) program, we scored stromal and immune cells for tumor purity prediction by CIBERSORT and ESTMATE. Differential expression analysis was employed to identify 374 genes between the high-score group and the low-score group, which were utilized to conduct Gene Ontology (GO) and Kyoto Encyclopedia of Genes and Genomes (KEGG) enrichment analysis. Protein-protein interaction (PPI) and Cox regression analysis were performed on the differentially expressed genes (DEGs) to identify four key tumor microenvironment (TME) -related genes (CCR2, CCR4, P2RY12, and P2RY13). The expression levels of the four DEGs differed significantly among LUAD patients of different ages, genders, and TNM stages. We found that the infiltration of resting memory CD4+ T cells, memory B cells, and M0 macrophages into the TME was co-regulated by these four DEGs. These four genes were closely related to the prognosis of LUAD and affected the infiltration of immune cells into the TME, which had predictive prognostic value in LUAD.

Keywords: immune cell infiltration; lung adenocarcinoma; tumor immunity; tumor microenvironment; tumor stroma.


Conflict of interest statement

CONFLICTS OF INTEREST: We declare no conflicts of interest.

Figures

Figure 1
Figure 1
Correlation of tumor score with different clinical features. Survival analysis of patients with LUAD based on overall score (A), immune score (B), and stromal score (C). Effect of age, gender or tumor TNM stage on overall score (D), immune score (E), and stromal score (F).
Figure 2
Figure 2
DEGs of high immune score (stromal score) and low score groups and functional enrichment analysis. Heatmap of significantly differentially expressed genes based on immune (A) and stromal (B) scores for LUAD. Venn diagram analysis of high (C) and low (D) expressed genes based on immune and stromal scores. (E) GO analysis of aberrantly expressed genes at the intersection of two groups. (F) CircleMap showing the functional interactions between pathways and genes as extracted from GO. (G) KEGG analysis of aberrantly expressed genes at the intersection of two groups. (H) CircleMap showing the functional interactions between pathways and genes as extracted from KEGG.
Figure 3
Figure 3
Screening of differentially expressed genes based on protein-protein interaction (PPI) and Univariate Cox regression analysis. (A) PPI network of the aberrantly expressed genes based on STRING (interaction confidence value > 0.95). (B) Visualized PPI analysis of differentially expressed genes using Cytoscape. (C) Top 30 genes with maximum adjacent nodes. (D) Univariate Cox regression analysis for the aberrantly expressed genes. Genes with a p value less than 0.05 are shown in the forest plot. (E) Venn diagram of key genes in PPI and Cox regression analysis. Four TIIC-related genes (CCR2, CCR4, P2RY12, and P2RY13) were finally screened as prognostic factors of LUAD.
Figure 4
Figure 4
Expression levels of the four genes (CCR2, CCR4, P2RY12, and P2RY13) and their prognostic value in LUAD patients. (A) The expression levels of the four genes in LUAD and normal tissues. (B) The levels of these four genes in paired tumor and adjacent normal tissues. (C) Survival curves of the expression of these four genes in the high-expression (red line) and low-expression (blue line) groups. The expression levels of CCR2 (D), CCR4 (E), P2RY12 (F), and P2RY12 (G) in patients with LUAD of different ages, genders and tumor TNM stages.
Figure 5
Figure 5
Select GSEA plots of signatures for the four genes. (A) Enriched gene sets in KEGG collection by high expression of CCR2 (A), CCR4 (B), P2RY12 (C), and P2RY13 (D). Each line with a unique color represents one particular gene set. The upregulated genes are located on the left of the x-axis, and the downregulated genes are on the right. Only the gene sets with FDR q < 0.05, NOM p < 0.05, and FWER p < 0.05 are displayed. The top 10 leading gene sets are presented in the plot.
Figure 6
Figure 6
CIBERSORT for estimating TIIC components in the LUAD microenvironment. (A) Stacked bar chart representing the component of TIICs in LUAD samples. (B) Correlation matrix of the different tumor-infiltrating immune cell proportions in LUAD.
Figure 7
Figure 7
Effect of the four genes on TIIC levels in patients with LUAD. Violin plot indicating the ratio differentiation of 21 types of TIICs in high/low CCR2 (A), CCR4 (B), P2RY12 (C), and P2RY13 (D) expression relative to the median expression level.
Figure 8
Figure 8
Correlation of the expression of the four genes with immune cell infiltration levels in patients with LUAD. (A) Scatter plot showing that 16 kinds of TIICs were correlated with the CCR2 expression (p < 0.05). (B) Scatter plot showing that 13 kinds of TIICs were correlated with CCR4 expression (p < 0.05). (C) Scatter plot showing 14 kinds of TIICs correlated with P2RY12 expression (p < 0.05). (D) Scatter plot showing 16 kinds of TIICs correlated with P2RY13 expression (p < 0.05).
Figure 9
Figure 9
Venn diagram analysis of aberrantly TIICs based on the difference analysis method and correlation analysis method. (A) Venn diagram indicating 11 kinds of TIICs correlated with CCR2 expression co-determined by difference and correlation analysis displayed in violin and scatter plots, respectively. (B) Venn diagram indicating 9 kinds of TIICs correlated with CCR4 expression co-determined by difference and correlation analysis displayed in violin and scatter plots, respectively. (C) Venn diagram indicating 13 kinds of TIICs correlated with P2RY12 expression co-determined by difference and correlation analysis displayed in violin and scatter plots, respectively. (D) Venn diagram indicating 11 kinds of TIICs correlated with P2RY13 expression co-determined by difference and correlation analysis displayed in violin and scatter plots, respectively. (E) Venn diagram indicating 3 kinds of TIICs that were co-related by these four genes.

References

    1. Chen W, Zheng R, Baade PD, Zhang S, Zeng H, Bray F, Jemal A, Yu XQ, He J. Cancer statistics in China, 2015. CA Cancer J Clin. 2016; 66:115–32. 10.3322/caac.21338 - DOI - PubMed
    1. Siegel RL, Miller KD, Jemal A. Cancer statistics, 2019. CA Cancer J Clin. 2019; 69:7–34. 10.3322/caac.21551 - DOI - PubMed
    1. Topalian SL, Wolchok JD, Chan TA, Mellman I, Palucka K, Banchereau J, Rosenberg SA, Dane Wittrup K. Immunotherapy: the path to win the war on cancer? Cell. 2015; 161:185–86. 10.1016/j.cell.2015.03.045 - DOI - PMC - PubMed
    1. Galluzzi L, Chan TA, Kroemer G, Wolchok JD, López-Soto A. The hallmarks of successful anticancer immunotherapy. Sci Transl Med. 2018; 10:eaat7807. 10.1126/scitranslmed.aat7807 - DOI - PubMed
    1. Schmidt L, Eskiocak B, Kohn R, Dang C, Joshi NS, DuPage M, Lee DY, Jacks T. Enhanced adaptive immune responses in lung adenocarcinoma through natural killer cell stimulation. Proc Natl Acad Sci USA. 2019; 116:17460–69. 10.1073/pnas.1904253116 - DOI - PMC - PubMed

Publication types

MeSH terms