. 2020 Dec 14;11(1):6383.
doi: 10.1038/s41467-020-19966-5.

The role of polygenic risk and susceptibility genes in breast cancer over the course of life

Collaborators, Affiliations

The role of polygenic risk and susceptibility genes in breast cancer over the course of life

Nina Mars et al. Nat Commun. .

Abstract

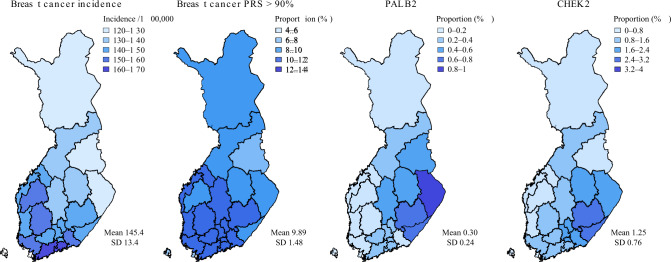
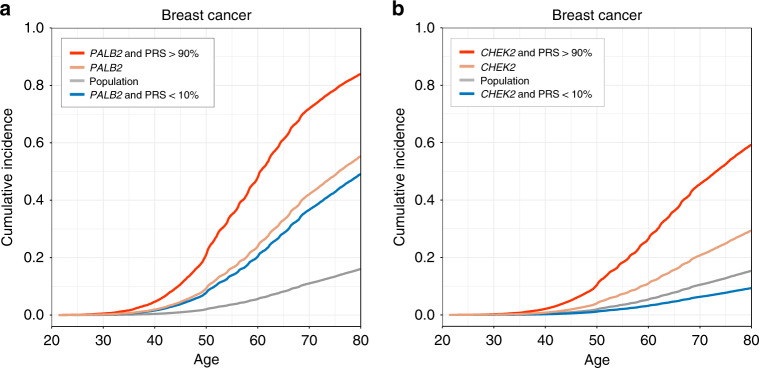
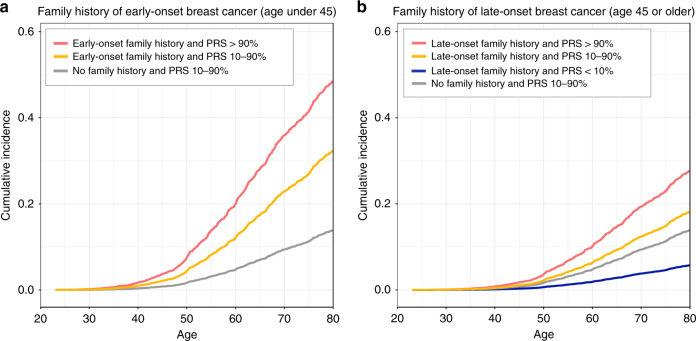
Polygenic risk scores (PRS) for breast cancer have potential to improve risk prediction, but there is limited information on their utility in various clinical situations. Here we show that among 122,978 women in the FinnGen study with 8401 breast cancer cases, the PRS modifies the breast cancer risk of two high-impact frameshift risk variants. Similarly, we show that after the breast cancer diagnosis, individuals with elevated PRS have an elevated risk of developing contralateral breast cancer, and that the PRS can considerably improve risk assessment among their female first-degree relatives. In more detail, women with the c.1592delT variant in PALB2 (242-fold enrichment in Finland, 336 carriers) and an average PRS (10-90th percentile) have a lifetime risk of breast cancer at 55% (95% CI 49-61%), which increases to 84% (71-97%) with a high PRS ( > 90th percentile), and decreases to 49% (30-68%) with a low PRS ( < 10th percentile). Similarly, for c.1100delC in CHEK2 (3.7-fold enrichment; 1648 carriers), the respective lifetime risks are 29% (27-32%), 59% (52-66%), and 9% (5-14%). The PRS also refines the risk assessment of women with first-degree relatives diagnosed with breast cancer, particularly among women with positive family history of early-onset breast cancer. Here we demonstrate the opportunities for a comprehensive way of assessing genetic risk in the general population, in breast cancer patients, and in unaffected family members.


Conflict of interest statement

A.P. is a member of the Pfizer Genetics Scientific Advisory Panel. H.J. has a co-appointment at Orion Pharma, has received fees from Neutron Therapeutics, and owns stocks of Orion Pharma and Sartar Therapeutics. The remaining authors declare no competing interests.

Figures

Fig. 1
Fig. 1. Geographic variation in genetic risk.
The risk is compared to age-standardised breast cancer incidence. The proportion of women with the breast cancer polygenic risk score (PRS) above the 90th percentile in each region is estimated with respect to the PRS distribution of the whole country. The PALB2 and CHEK2 maps show across different regions the proportion of women carrying at least one risk allele for the variants. The areas represent region of birth obtained from Statistics Finland. The national breast cancer incidence in women was obtained from the Finnish Cancer Registry (publicly available at https://cancerregistry.fi/statistics/) with diagnosis C50 (International Classification of Diseases for Oncology, 3rd edn, ICD-O-3). The incidence represents the mean of 5-year age-standardised incidences (based on the 2014 Finnish population, calculated for each hospital district over 1998–2007). The mean and standard deviation were calculated over the different regions. Variants: rs180177102 (c.1592delT) for PALB2 and rs555607708 (c.1100delC) for CHEK2. CHEK2 and polygenic risk score plots are based on 122,978 women, and PALB2 on 109,371 women. Colour contrasts were chosen approximately based on the standard deviation for each map.
Fig. 2
Fig. 2. The impact of polygenic risk in PALB2 and CHEK2 mutation carriers.
Adjusted survival curves showing how the polygenic risk score (PRS) affects the breast cancer risk conferred by the PALB2 (panel A) and CHEK2 (panel B) frameshift mutations. Population level was defined as women with PRS between the 10th and 90th percentiles. The PALB2 analysis was done in 109,371 women and CHEK2 analysis in 122,978 women. Adjusted survival curves Cox proportional hazards model.
Fig. 3
Fig. 3. Impact of the polygenic risk score (PRS) in estimating the breast cancer risk of women with a first-degree relative diagnosed with breast cancer.
a Shows the impact of family history of early-onset breast cancer, and b the impact of family history of late-onset breast cancer. Adjusted survival curves based on Cox proportional hazards models. Risk estimated in 7715 mother–daughter pairs and 12,086 full sibling-pairs (sisters). The pairs of first-degree relatives were inferred with KING by a kinship coefficient ranging between 0.177 and 0.354 (inference based on 57 K unlinked variants). Due to the sample size, we were unable to assess impact of a low PRS (<10th percentile) with early-onset family history.

References

    1. Bray F, et al. Global cancer statistics 2018: GLOBOCAN estimates of incidence and mortality worldwide for 36 cancers in 185 countries. CA Cancer J. Clin. 2018;68:394–424. doi: 10.3322/caac.21492. - DOI - PubMed
    1. Economopoulou P, Dimitriadis G, Psyrri A. Beyond BRCA: new hereditary breast cancer susceptibility genes. Cancer Treat. Rev. 2015;41:1–8. doi: 10.1016/j.ctrv.2014.10.008. - DOI - PubMed
    1. Vehmanen P, et al. Low proportion of BRCA1 and BRCA2 mutations in finnish breast cancer families: evidence for additional susceptibility genes. Hum. Mol. Genet. 1997;6:2309–2315. doi: 10.1093/hmg/6.13.2309. - DOI - PubMed
    1. Ducy M, et al. The tumor suppressor PALB2: Inside out. Trends Biochem. Sci. 2019;44:226–240. doi: 10.1016/j.tibs.2018.10.008. - DOI - PubMed
    1. Nevanlinna H, Bartek J. The CHEK2 gene and inherited breast cancer susceptibility. Oncogene. 2006;25:5912–5919. doi: 10.1038/sj.onc.1209877. - DOI - PubMed

Publication types

MeSH terms

Substances