

Global trends in antimicrobial use in aquaculture
- PMID: 33318576
- PMCID: PMC7736322
- DOI: 10.1038/s41598-020-78849-3
Global trends in antimicrobial use in aquaculture
Abstract
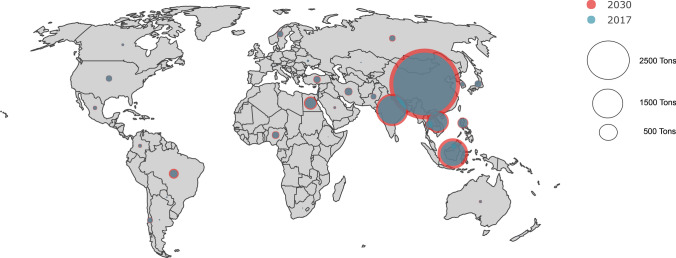
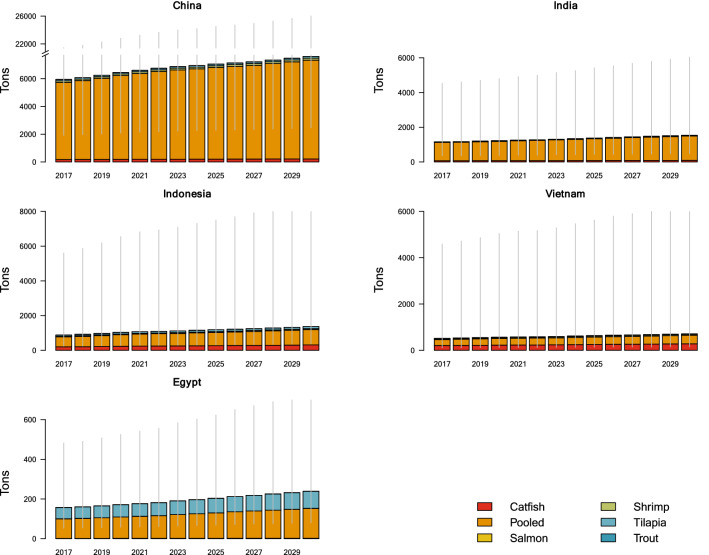
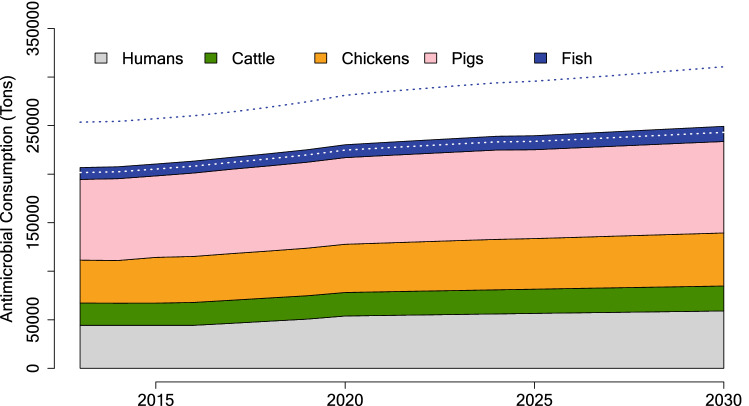
Globally aquaculture contributes 8% of animal protein intake to the human diet, and per capita consumption is increasing faster than meat and dairy consumption. Reports have documented antimicrobial use in the rapidly expanding aquaculture industry, which may contribute to the rise of antimicrobial resistance, carrying potential consequences for animal-, human-, and ecosystem-health. However, quantitative antimicrobial use across a highly diversified aquaculture industry is not well characterized. Here, we estimate global trends in antimicrobial use in aquaculture in 2017 and 2030 to help target future surveillance efforts and antimicrobial stewardship policies. We estimate antimicrobial use intensity (mg kg-1) for six species groups though a systematic review of point prevalence surveys, which identified 146 species-specific antimicrobial use rates. We project antimicrobial use in each country by combining mean antimicrobial use coefficients per species group with OECD/FAO Agricultural Outlook and FAO FishStat production volumes. We estimate global antimicrobial consumption in 2017 at 10,259 tons (95% uncertainty interval [UI] 3163-44,727 tons), increasing 33% to 13,600 tons in 2030 (UI 4193-59,295). The Asia-Pacific region represents the largest share (93.8%) of global consumption, with China alone contributing 57.9% of global consumption in 2017. Antimicrobial consumption intensity per species group was: catfish, 157 mg kg-1 (UI 9-2751); trout, 103 mg kg-1 (UI 5-1951); tilapia, 59 mg kg-1 (UI 21-169); shrimp, 46 mg kg-1 (UI 10-224); salmon, 27 mg kg-1 (UI 17-41) and a pooled species group, 208 mg kg-1, (UI 70-622). All antimicrobial classes identified in the review are classified as medically important. We estimate aggregate global human, terrestrial and aquatic food animal antimicrobial use in 2030 at 236,757 tons (95% UI 145,525-421,426), of which aquaculture constitutes 5.7% but carries the highest use intensity per kilogram of biomass (164.8 mg kg-1). This analysis calls for a substantial scale-up of surveillance capacities to monitor global trends in antimicrobial use. Current evidence, while subject to considerable uncertainties, suggests that for some species groups antimicrobial use intensity surpasses consumption levels in terrestrial animals and humans. Acknowledging the fast-growing nature of aquaculture as an important source of animal nutrition globally, our findings highlight the urgent need for enhanced antimicrobial stewardship in a high-growth industry with broad links to water and ecosystem health.
Conflict of interest statement
The authors declare no competing interests.
Figures
References
-
- FAO. 2018. The State of World Fisheries and Aquaculture 2018—Meeting the sustainable development goals. Rome. http://www.fao.org/3/i9540en/I9540EN.pdf (Accessed 30 July 2019).
-
- OECD/FAO. 2018. “OECD-FAO Agricultural Outlook”, OECD Agriculture statistics (database). 10.1787/agr-outl-data-en. (Accessed 30 July 2019).
-
- Steinfeld, H., Gerber, P., Wassenaar, T.D., Castel, V. & de Haan, C. 2006. Livestock’s long shadow: Environmental issues and options. FAO, Rome. http://www.fao.org/3/a0701e/a0701e.pdf. (Accessed 3 December 2019).
Publication types
MeSH terms
Substances
LinkOut - more resources
Full Text Sources
Medical
