. 2020 Dec 14;10(1):21844.
doi: 10.1038/s41598-020-79045-z.

Growth, ionic homeostasis, and physiological responses of cotton under different salt and alkali stresses

Affiliations

Growth, ionic homeostasis, and physiological responses of cotton under different salt and alkali stresses

Huijuan Guo et al. Sci Rep. .

Abstract

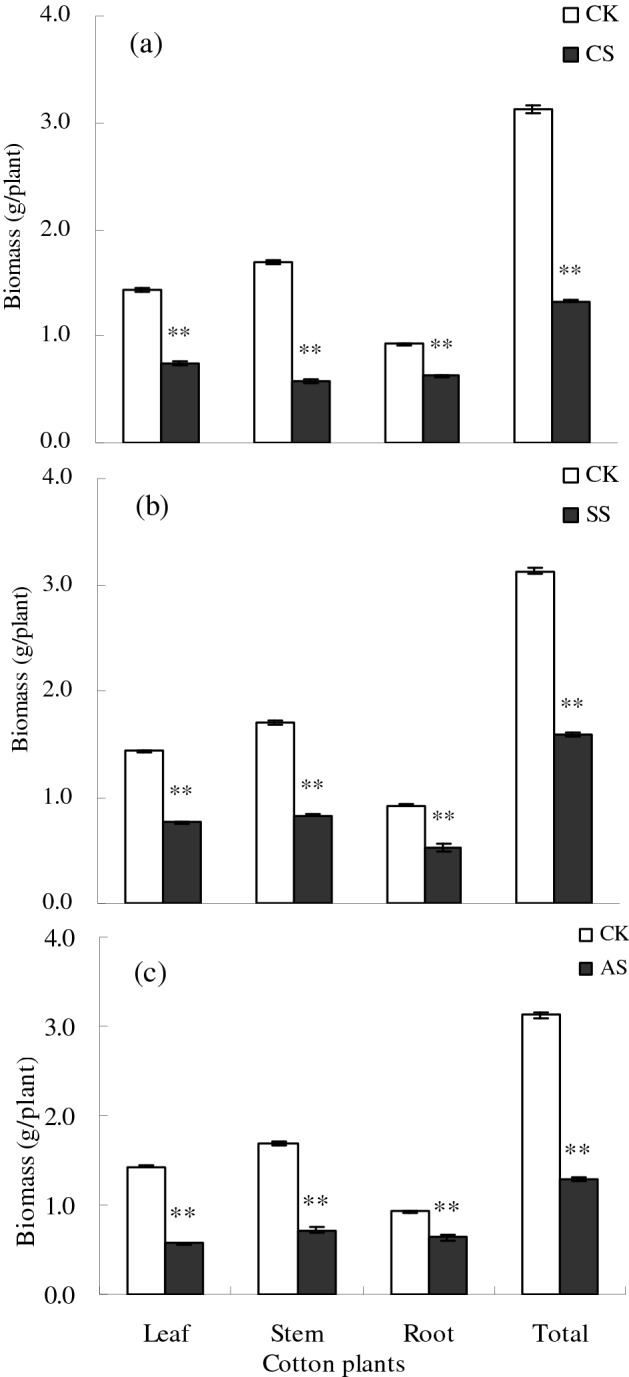
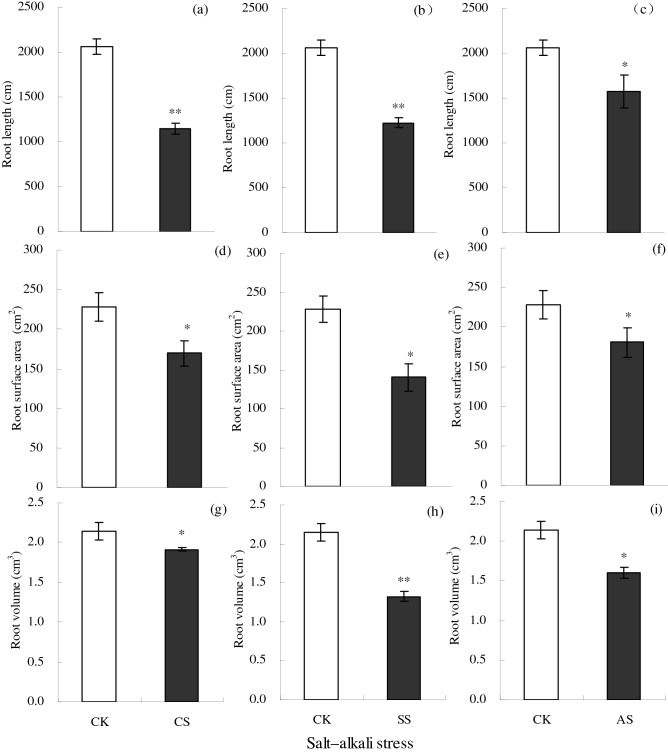
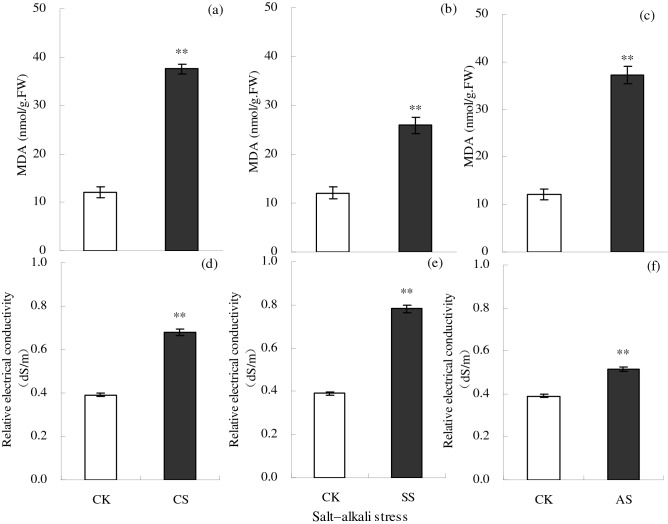
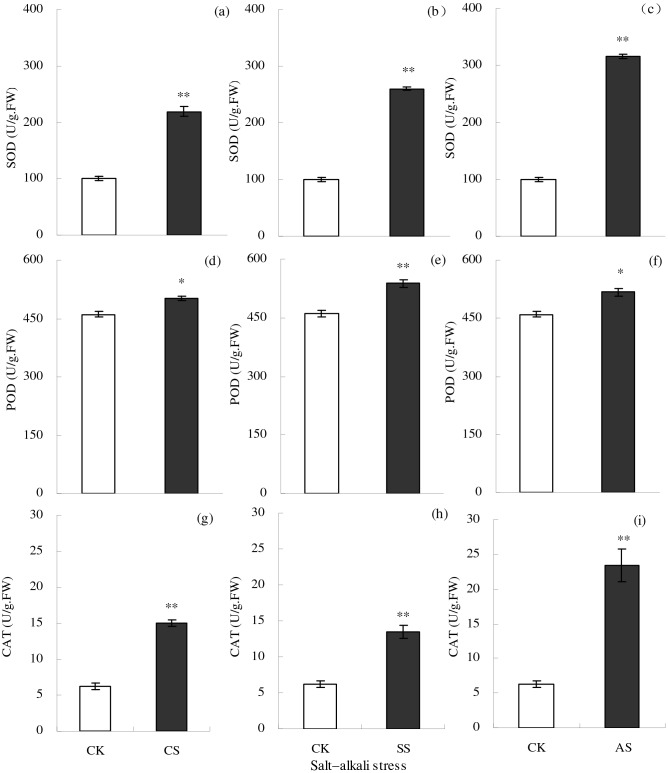
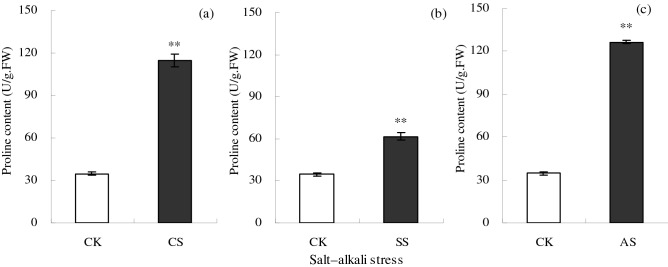
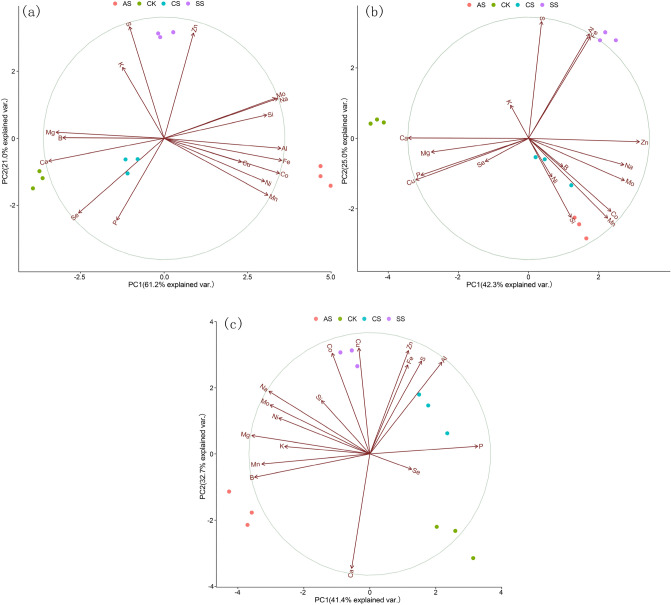
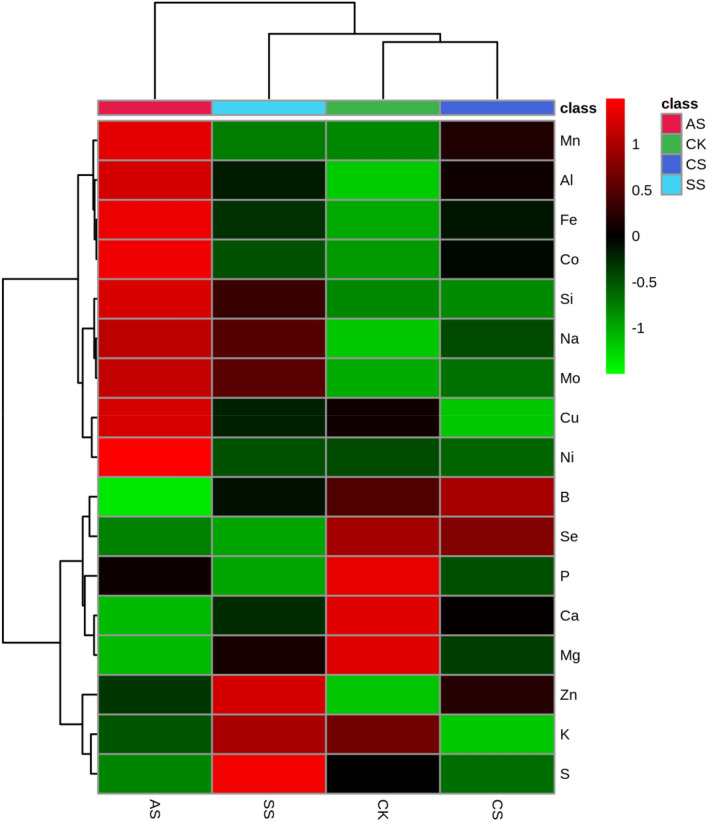
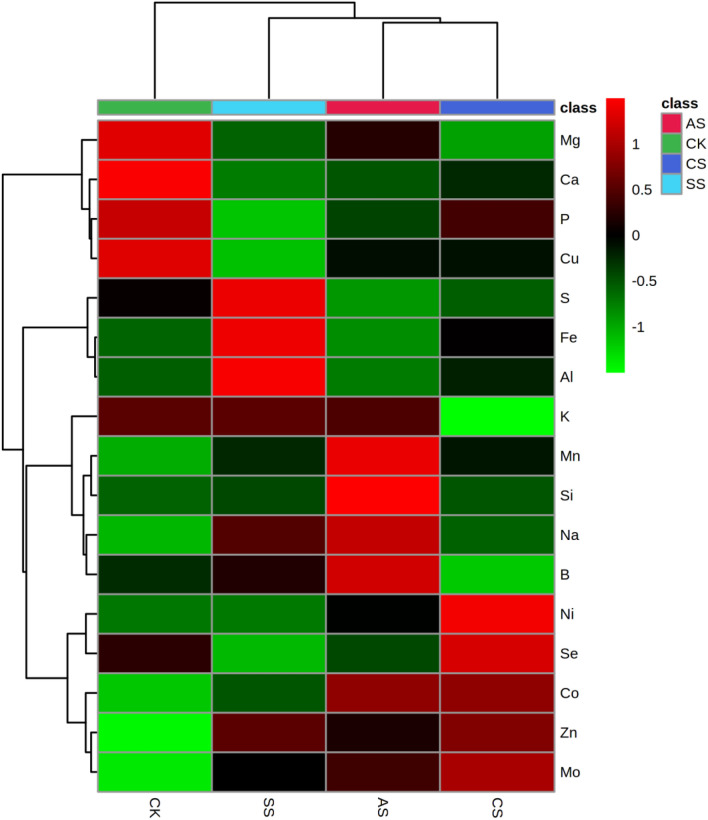
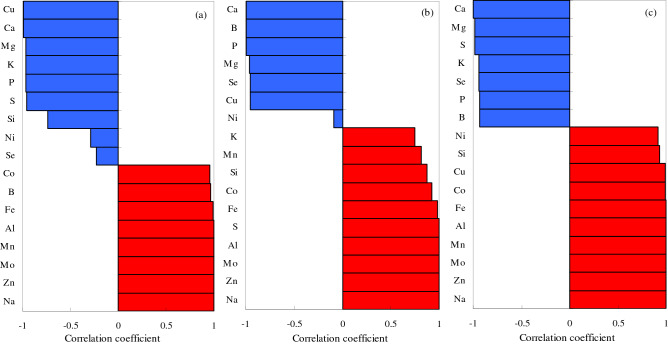
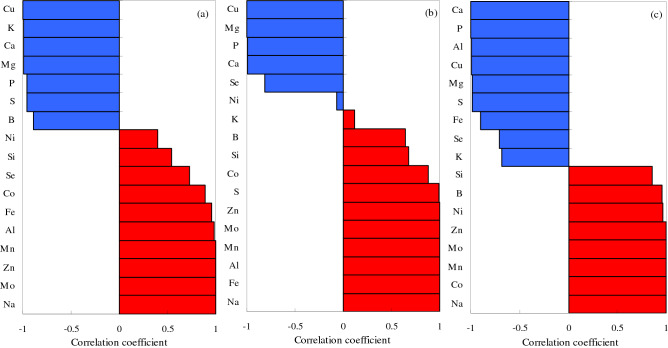
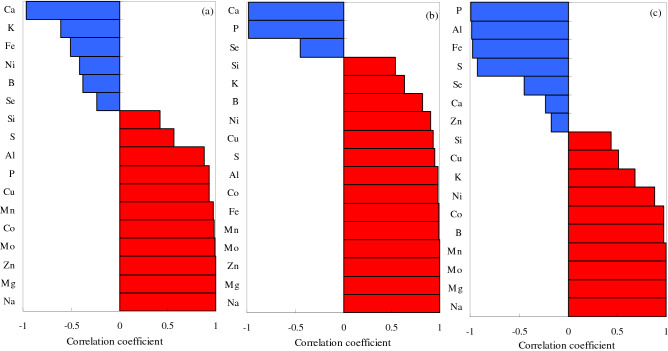
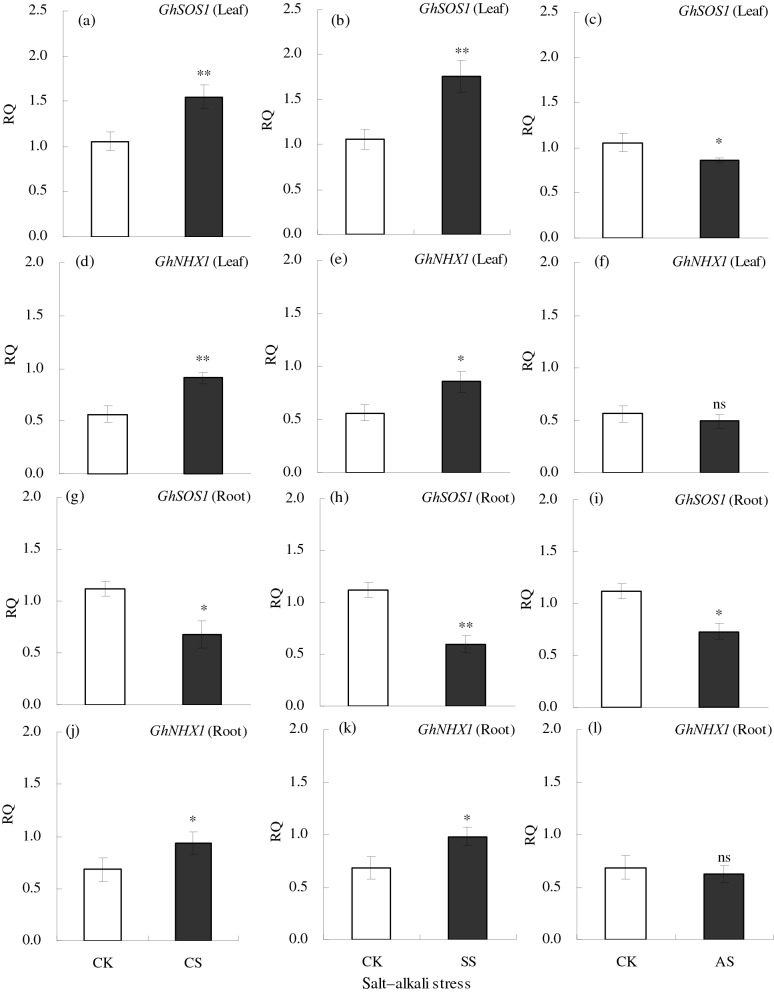
To better understand the mechanism of salt tolerance, we analyzed cotton growth and the ionomes in different tissues under different types of salt-alkali stress. Cotton was exposed to the soil salt and alkali stresses, NaCl, Na2SO4, and Na2CO3 + NaHCO3, in a pot study. Salt and alkali stress significantly inhibited cotton growth, significantly reduced root length, surface area, and volume, and significantly increased relative electrical conductivity (REC) and malondialdehyde (MDA) content but also significantly increased antioxidant enzyme activities, and proline (Pro) content. The REC in leaves was higher under salt stress than under alkali stress, but the effects on Pro were in the order Na2CO3 + NaHCO3 > NaCl > Na2SO4. Principal component analysis showed a significant difference in ion composition under the different types of salt-alkali stress. Under the three types of salt-alkali stress, concentrations of Na and Mo increased significantly in different organs of cotton plants. Under NaCl stress, the absorption of Ca was inhibited, the transport capacity of P, Mg, and Cu was reduced, and the ion balance was maintained by promoting the uptake and transport of Zn, Mn, Al, and Mo. Under Na2SO4 stress, the absorption of P and Ca was inhibited, the transport capacity of Mg, B, and Cu was reduced, and the ion balance was maintained by promoting the uptake and transport of S, Zn, Fe, Mo, Al, and Co. Under Na2CO3 + NaHCO3 stress, the absorption of P and S was inhibited, the transport capacity of Mg and B was reduced, but that of Al and Fe increased, and the ion balance was maintained by promoting the uptake and transport of Mn, Mo, Ni, and Co. The relative expression of GhSOS1 and GhNHX1 in leaves increased significantly under salt stress but decreased under alkali stress. These results suggest that cotton is well-adapted to salt-alkali stress via the antioxidant enzyme system, adjustment of osmotic substances, and reconstruction of ionic equilibrium; neutral salt stress primarily disrupts the ion balance, whereas alkali stress decreases the ability to regulate Na and inhibits the absorption of mineral elements, as well as disrupts the ion balance; and the changes in the expression of salt tolerance-related genes may partially explain the accumulation of Na ions in cotton under salt-alkali stress.


Conflict of interest statement

The authors declare no competing interests.

Figures

Figure 1
Figure 1
Leaf, stem, root, and total biomass (g/plant) of cotton plants under different types of salt–alkali stress: (a) NaCl (CS), (b) Na2SO4 (SS), and (c) Na2CO3 + NaHCO3 (AS). Columns with bars represent the mean ± standard error (n = 3). Asterisks indicate a significant difference between the control (CK) and the salt–alkali stress (**p < 0.01).
Figure 2
Figure 2
Root length (cm), surface area (cm2), and volume (cm3) of cotton plants under different types of salt–alkali stress (NaCl (CS), Na2SO4 (SS), and Na2CO3 + NaHCO3 (AS)). Columns with bars represent the mean ± standard error (n = 3). Asterisks indicate a significant difference between the control (CK) and the salt–alkali stress (*p < 0.05; **p < 0.01). (ac) indicate the root length in NaCl, Na2SO4, and Na2CO3 + NaHCO3 stress, respectively. (df) indicate the surface area in NaCl, Na2SO4, and Na2CO3 + NaHCO3 stress, respectively. (gi) indicate the root volume in NaCl, Na2SO4, and Na2CO3 + NaHCO3 stress, respectively.
Figure 3
Figure 3
Malondialdehyde (MDA) content (nmol/g fresh weight (FW)) and relative electrical conductivity (REC) (dS/m) in cotton leaves under different types of salt–alkali stress (NaCl (CS), Na2SO4 (SS), and Na2CO3 + NaHCO3 (AS)). Columns with bars represent the mean ± standard error (n = 3). Asterisks indicate a significant difference between the control (CK) and the salt–alkali stress (**p < 0.01). (ac) indicate the MDA content in cotton leaves under NaCl, Na2SO4, and Na2CO3 + NaHCO3 stress, respectively. (df) indicate the REC in cotton leaves under NaCl, Na2SO4, and Na2CO3 + NaHCO3 stress, respectively.
Figure 4
Figure 4
Activities (U/g fresh weight (FW)) of the antioxidant enzymes superoxide dismutase (SOD), peroxidase (POD), and catalase (CAT) in cotton leaves under different types of salt–alkali stress (NaCl (CS), Na2SO4 (SS), and Na2CO3 + NaHCO3 (AS)). Columns with bars represent the mean ± standard error (n = 3). Asterisks indicate a significant difference between the control (CK) and the salt–alkali stress (*p < 0.05; **p < 0.01). (ac) indicate the SOD in cotton leaves under NaCl, Na2SO4, and Na2CO3 + NaHCO3 stress, respectively. (df) indicate the POD in cotton leaves under NaCl, Na2SO4, and Na2CO3 + NaHCO3 stress, respectively. (gi) indicate the CAT in cotton leaves under NaCl, Na2SO4, and Na2CO3 + NaHCO3 stress, respectively.
Figure 5
Figure 5
Proline content (U/g fresh weight (FW)) in cotton leaves under different types of salt–alkali stress (NaCl (CS), Na2SO4 (SS), and Na2CO3 + NaHCO3 (AS)). Columns with bars represent the mean ± standard error (n = 3). Asterisks indicate a significant difference between the control (CK) and the salt–alkali stress (**p < 0.01). (ac) indicate the Proline content in cotton leaves under NaCl, Na2SO4, and Na2CO3 + NaHCO3 stress, respectively.
Figure 6
Figure 6
Principal component analysis (PCA) of tissue ionome variation in cotton under different types of salt–alkali stress (Control (CK), NaCl (CS), Na2SO4 (SS), and Na2CO3 + NaHCO3 (AS)), with the loadings of mineral elements to the PC1 and PC2. (a) Leaf ionome variation among samples and the loadings of elements to the PC1 and PC2; (b) Stem ionome variation among samples and the loadings of elements to the PC1 and PC2; (c) Root ionome variation among samples and the loadings of elements to the PC1 and PC2.
Figure 7
Figure 7
Hierarchical cluster analysis of the leaf ionomes in cotton plants under different types of salt–alkali stress (Control (CK), NaCl (CS), Na2SO4 (SS), and Na2CO3 + NaHCO3 (AS)). The relative values are indicated by color intensity in the legend in the upper right.
Figure 8
Figure 8
Hierarchical cluster analysis of the stem ionomes in cotton plants under different types of salt–alkali stress (Control (CK), NaCl (CS), Na2SO4 (SS), and Na2CO3 + NaHCO3 (AS)). The relative values are indicated by color intensity in the legend in the upper right.
Figure 9
Figure 9
Hierarchical cluster analysis of the root ionomes in cotton plants under different types of salt–alkali stress (Control (CK), NaCl (CS), Na2SO4 (SS), and Na2CO3 + NaHCO3 (AS)). The relative values are indicated by color intensity in the legend in the upper right.
Figure 10
Figure 10
Leaf, stem, and root K/Na ratios of cotton plants under different types of salt–alkali stress: (a) NaCl (CS), (b) Na2SO4 (SS), and (c) Na2CO3 + NaHCO3 (AS). Columns with bars represent the mean ± standard error (n = 3). Asterisks indicate a significant difference between the control (CK) and the salt–alkali stress (**p < 0.01).
Figure 11
Figure 11
Pearson’s coefficients of correlation between the element Na and other elements in cotton leaves under different types of salt–alkali stress. (a) NaCl; (b) Na2SO4; and (c) Na2CO3 + NaHCO3. Blue, negative correlation; red, positive correlation.
Figure 12
Figure 12
Pearson’s coefficients of correlation between the element Na and other elements in cotton stems under different types of salt–alkali stress. (a) NaCl; (b) Na2SO4; and (c) Na2CO3 + NaHCO3. Blue, negative correlation; red, positive correlation.
Figure 13
Figure 13
Pearson’s coefficients of correlation between the element Na and other elements in cotton roots under different types of salt–alkali stress. (a) NaCl; (b) Na2SO4; and (c) Na2CO3 + NaHCO3. Blue, negative correlation; red, positive correlation.
Figure 14
Figure 14
Relative expression (RQ) of the genes GhSOS1 and GhNHX1 in leaf and root of cotton under different types of salt–alkali stress (NaCl (CS), Na2SO4 (SS), and Na2CO3 + NaHCO3 (AS)). Columns with bars represent the mean ± standard error (n = 3). Asterisks indicate a significant difference between the control (CK) and the salt–alkali stress (*p < 0.05; **p < 0.01), and ns indicates no significant difference. (ac) indicate the GhSOS1 gene relative expression in cotton leaf under NaCl, Na2SO4, and Na2CO3 + NaHCO3 stress, respectively. (df) indicate the GhNHX1 gene relative expression in cotton leaf under NaCl, Na2SO4, and Na2CO3 + NaHCO3 stress, respectively. (gi) indicate the GhSOS1 gene relative expression in cotton root under NaCl, Na2SO4, and Na2CO3 + NaHCO3 stress, respectively. (jl) indicate the GhNHX1 gene relative expression in cotton root under NaCl, Na2SO4, and Na2CO3 + NaHCO3 stress, respectively.

References

    1. Liu J, Guo WQ, Shi DC. Seed germination, seedling survival, and physiological response of sunflowers under saline and alkaline conditions. Photosynthetica. 2010;48(2):278–286. doi: 10.1007/s11099-010-0034-3. - DOI
    1. Cheng C, et al. Co-expression of AtNHX1 and TsVP improves the salt tolerance of transgenic cotton and increases seed cotton yield in a saline field. Mol. Breed. 2018;38(2):19–33. doi: 10.1007/s11032-018-0774-5. - DOI
    1. Ahuja I, de Vos RC, Bones AM, Hall RD. Plant molecular stress responses face climate change. Trends Plant Sci. 2010;15(12):664–674. doi: 10.1016/j.tplants.2010.08.002. - DOI - PubMed
    1. Shi L, Ma S, Fang Y, Xu J. Crucial variations in growth and ion homeostasis of Glycine gracilis seedlings under two types of salt stresses. J. Soil Sci. Plant Nutr. 2015;15(4):1007–1023.
    1. Munns R. Comparative physiology of salt and water stress. Plant Cell Environ. 2002;25(2):239–250. doi: 10.1046/j.0016-8025.2001.00808.x. - DOI - PubMed

Publication types