

doi: 10.1038/s41593-020-00756-7.
Epub 2020 Dec 14.
Microglial Gi-dependent dynamics regulate brain network hyperexcitability
Affiliations
- PMID: 33318667
- PMCID: PMC8118167
- DOI: 10.1038/s41593-020-00756-7
Item in Clipboard
Microglial Gi-dependent dynamics regulate brain network hyperexcitability
Nat Neurosci.
2021 Jan.
Abstract
Microglial surveillance is a key feature of brain physiology and disease. Here, we found that Gi-dependent microglial dynamics prevent neuronal network hyperexcitability. By generating MgPTX mice to genetically inhibit Gi in microglia, we show that sustained reduction of microglia brain surveillance and directed process motility induced spontaneous seizures and increased hypersynchrony after physiologically evoked neuronal activity in awake adult mice. Thus, Gi-dependent microglia dynamics may prevent hyperexcitability in neurological diseases.
Figures
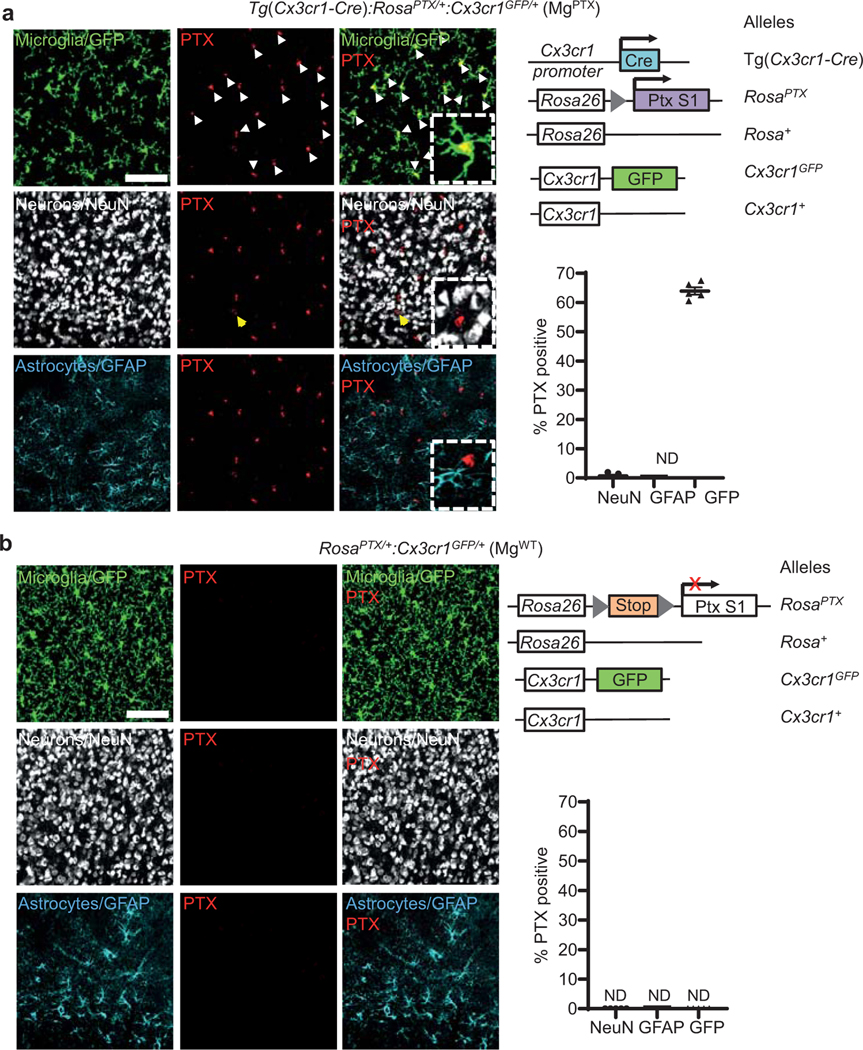
a, Confocal microscopy of PTX (red), neurons (white), microglia (green), and astrocytes (cyan) in cortex of MgPTX mice (left); right, schematic of MgPTX genetic background. PTX expressed in 63.9 ± 1.3% (mean ± s.e.m.) of GFP-positive microglia and 0.69 ± 0.43% (mean ± s.e.m.) of NeuN-positive neurons. Scale bar, 75 μm. n = 5 mice, 3 brain sections/mouse. ND, not detected. Quantification in an independent mouse cohort of n = 3 mice with similar results is shown in Fig. 1a. PTX expression in microglia (white arrows) and rare occasion of NeuN-positive cell co-localizing with PTX (yellow arrow). b, Confocal microscopy of PTX (red, not detected), neurons (white), microglia (green), and astrocytes (cyan) in cortex of MgWT mice (left); right, schematic of MgWT genetic background. Scale bar, 75 μm. n = 5 MgWT mice, 3 brain sections/mouse. ND, not detected.
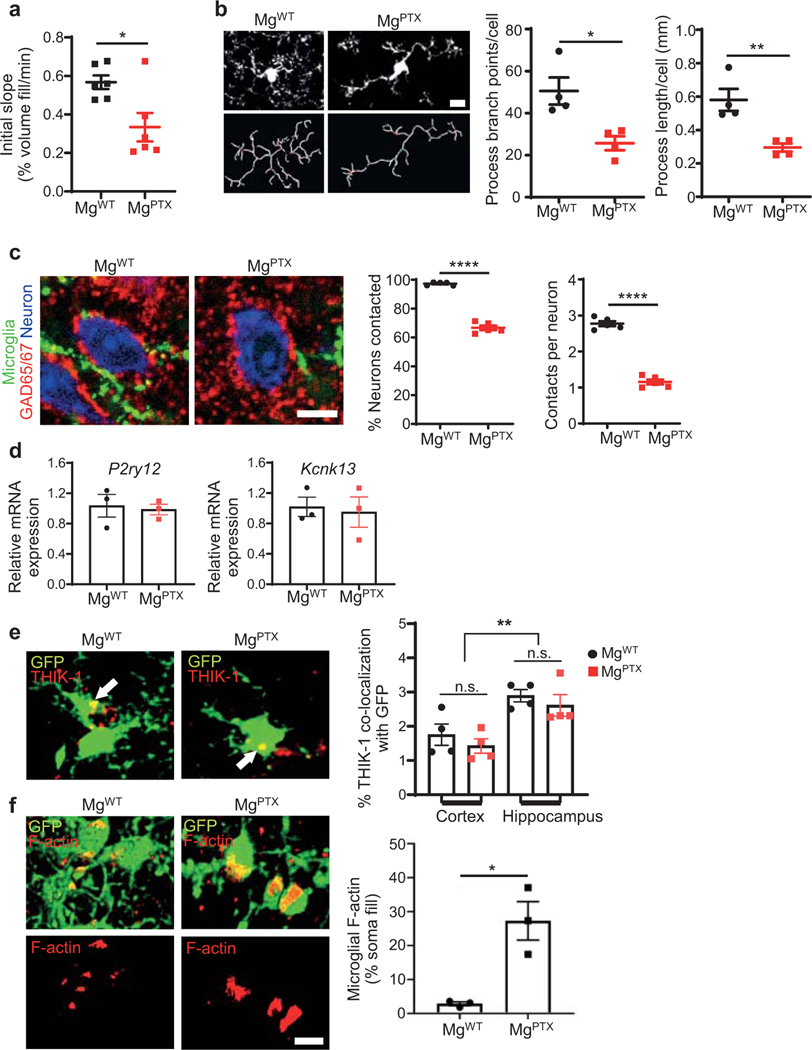
a, Initial slope of microglial surveillance (% volume fill/min) in MgPTX and MgWT mice. Data are mean ± s.e.m. n = 6 mice per genotype. * P = 0.0174 by unpaired two-sample t-test. b, Confocal images (top) and filament reconstruction (bottom) of GFP-expressing microglia in MgPTX and MgWT mice and quantification of total process branch points and total process length per cell. Scale bar, 10 μm. Data are mean ± s.e.m. n = 4 mice per genotype. * P = 0.0142 and ** P = 0.0067 by unpaired two-tailed t-test. c, Confocal images of GAD65/67 (red) in MgPTX and MgWT cortex with microglia contacts (GFP, green) onto neuronal somata (NeuN, blue) surrounded by GAD65/67 puncta. Scale bar, 10 μm. Data are mean ± s.e.m. n = 5 mice per genotype. **** P < 0.0001 by unpaired two-tailed t-test. d, Relative expression of P2ry12 and Kcnk13 normalized to Gapdh in FACS-sorted microglia from cortex and hippocampus of MgPTX and MgWT mice. Data are mean ± s.e.m. n = 3 mice per genotype. ns, not significant by unpaired two-tailed t-test. e, Confocal images of THIK-1 (red) and microglial GFP (green) co-localization (yellow, arrows) in MgWT and MgPTX hippocampus. Scale bar, 10 μm. Data are mean ± s.e.m. n = 4 mice per genotype, 3 brain sections/brain region/mouse. **P = 0.0053, ns, not significant by two-way ANOVA. f, In vivo 2P images of microglia (green) and F-actin (red) in MgWT and MgPTX mice. Scale bar, 15 μm. Data are mean ± s.e.m. n = 3 mice per genotype. 5–8 microglia quantified/mouse. * P = 0.0128 by unpaired two-tailed t-test.
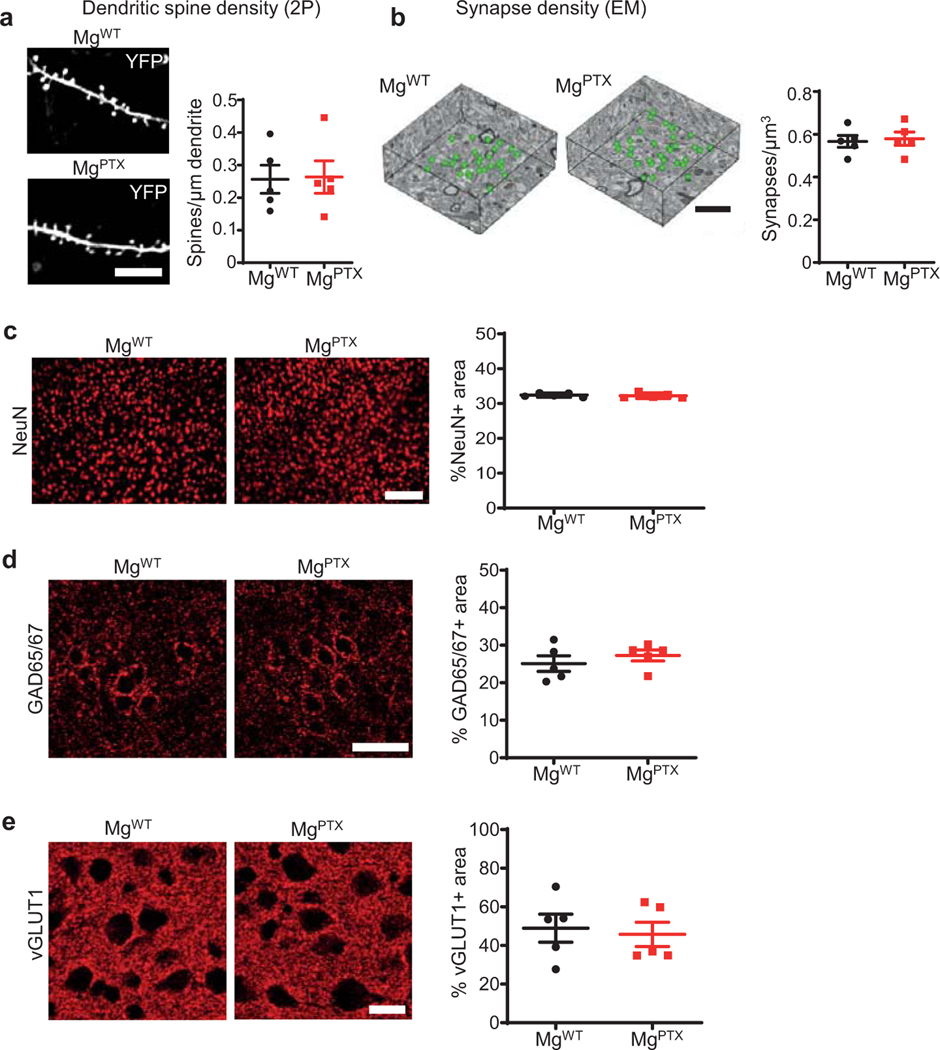
a, 2P in vivo images of cortical dendritic spines (YFP). Scale bar, 10 μm. Data are mean ± s.e.m. n = 5 mice per genotype. No significant difference by unpaired two-tailed t-test. b, 3D reconstruction of excitatory synapses (green spheres) in cortical volumes obtained by SBEM. Scale bar, 2 μm. Data are mean ± s.e.m. n = 5 mice per genotype. No significant difference by unpaired two-tailed t-test. c, Epifluorescent images of NeuN-positive neurons (red) in the cortex. Scale bar, 100 μm. Data are mean ± s.e.m. n = 5 mice per genotype. No significant difference by unpaired two-tailed t-test. d, Confocal images of cortical GAD65/67. Scale bar, 50 μm. Data are mean ± s.e.m. n = 5 mice per genotype. No significant difference by unpaired two-tailed t-test. e, Confocal images of cortical vGLUT1. Scale bar, 20 μm. Data are mean ± s.e.m. n = 5 mice per genotype. No significant difference by unpaired two-tailed t-test.
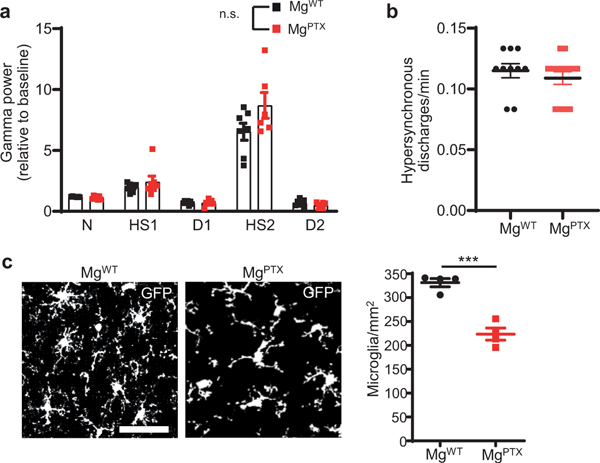
a, Gamma oscillatory power for the different EEG stages of pilocarpine-induced network hyper-synchronization in MgPTX and MgWT mice. Data are mean ± s.e.m. n = 7 mice per genotype. N, Normal; HS1, 1st hypersynchrony; D1, 1st depression; HS2, 2nd hypersynchrony; D2, 2nd depression. No significant difference (n.s.) between genotypes for each stage by two-stage linear step-up procedure of Benjamini, Krieger, and Yekutieli with Q = 1. b, Pre-pilocarpine in vivo baseline EEG recordings in MgWT and MgPTX mice. Data are mean ± s.e.m. n = 13 MgPTX and n = 10 MgWT mice. No significant difference by unpaired two-tailed t-test. c, Confocal images of GFP-positive microglia in MgPTX and MgWT cortex. Scale bar, 50 μm. Data are mean ± s.e.m. n = 4 MgPTX mice and n = 4 MgWT mice. *** P = 0.0004 by unpaired two-tailed t-test.
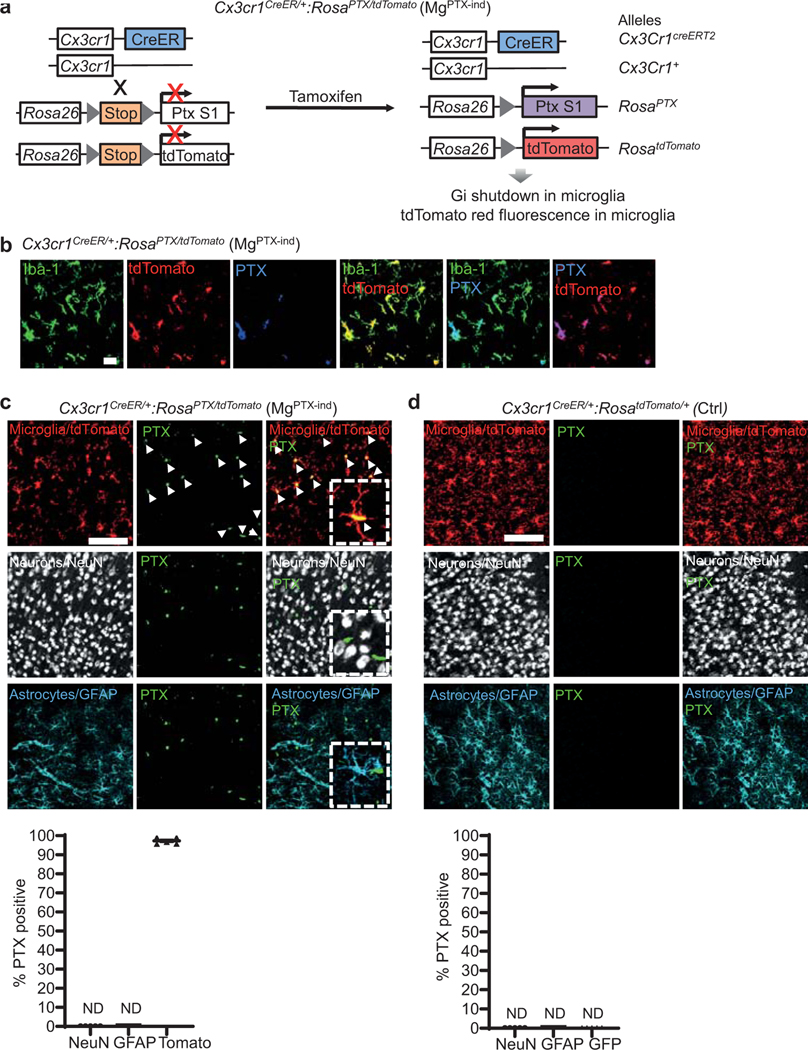
a, Schematic of Cx3cr1CreER/+:RosaPTX/tdTomato mice (MgPTX-ind) with inducible Gi shutdown and microglia-specific tdTomato expression. b, Confocal images of PTX (blue), Iba1 (green), tdTomato (red), and tdTomato-expressing microglia (yellow, co-localization) in cortex of MgPTX-ind mice 1.5 months after tamoxifen administration. Scale bar, 20 μm. Representative images are shown from n = 3 MgPTX-ind mice. c, Confocal microscopy of PTX (green), neurons (white), microglia (tamoxifen-induced tdTomato expression, red), and astrocytes (cyan) in cortex of MgPTX-ind mice. Exclusive expression of PTX in microglia (white arrows). PTX expressed in 97.3 ± 0.76% (mean ± s.e.m.) of tdTomato-positive microglia. Expression in neurons and astrocytes not detected (ND). Scale bar, 75 μm. Data are mean ± s.e.m. n = 5 mice, 3 brain sections/mouse. d, Confocal microscopy of PTX (green), neurons (white), microglia (tamoxifen-induced tdTomato expression, red), and astrocytes (cyan) in cortex of Ctrl mice. PTX expression not detected (ND). Scale bar, 75 μm. n = 5 mice, 3 brain sections/mouse.
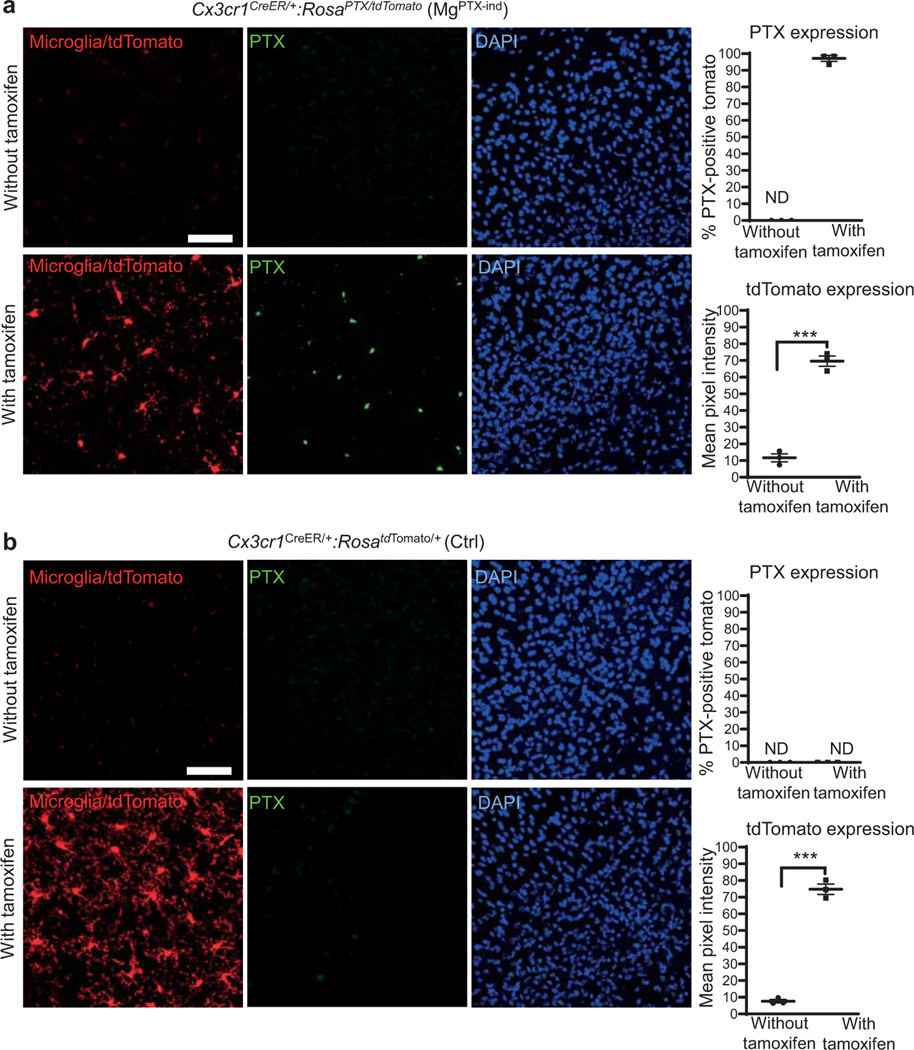
a, Confocal images of PTX (green) and nuclei (DAPI, blue) in cortex of MgPTX-ind mice with or without tamoxifen. PTX expression in 97.2 ± 0.62% (mean ± s.e.m.) of tdTomato-expressing microglia after tamoxifen; 69.6 ± 3% (mean ± s.e.m.) tdTomato-positive cells after tamoxifen and 11.67 ± 1.32% (mean ± s.e.m.) tdTomato-positive cells prior to tamoxifen. Scale bar, 75 μm. Data are mean ± s.e.m. n = 3 MgPTX-ind mice per condition, 3 brain sections/mouse. *** P = 0.0001 by unpaired two-tailed t-test. ND, not detected. b, Confocal images of PTX (green) and nuclei (DAPI, blue) in cortex of Ctrl mice with or without tamoxifen (left). PTX expression was not detected; 74.7 ± 1.72% (mean ± s.e.m. tdTomato expression after tamoxifen and 7.65 ± 0.35% (mean ± s.e.m.) tdTomato-positive cells prior to tamoxifen. Scale bar, 75 μm. Data are mean ± s.e.m. n = 3 Ctrl mice per condition, 3 brain sections/mouse. *** P < 0.0001 by unpaired two-tailed t-test. ND, not detected.
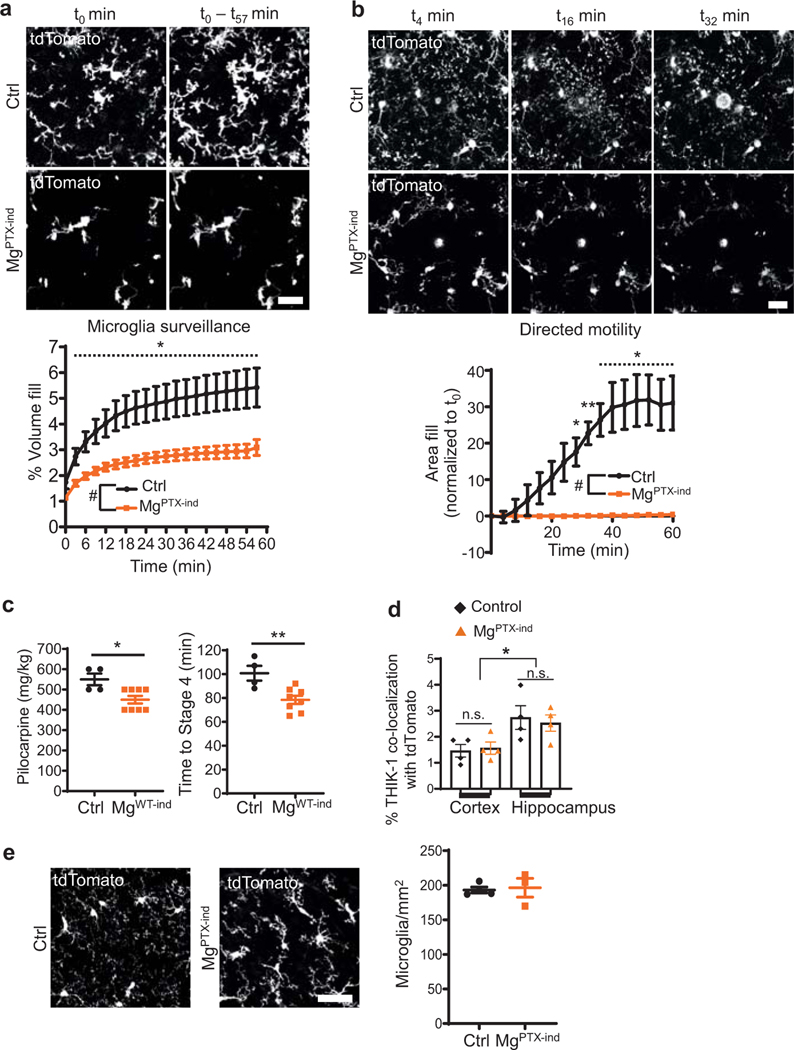
a, In vivo 2P time-lapse imaging of cumulative microglial surveillance in MgPTX-ind and Ctrl mice after tamoxifen induction. Scale bar, 20 μm. Data are mean ± s.e.m. n = 5 MgPTX-ind and n = 4 Ctrl mice. Overall genotype effect P-value = 0.04 by two-sample t-test of mean AUC. * P < 0.05 for comparison at individual time points by unpaired two-sample t-test. b, In vivo 2P time-lapse imaging of microglial directed process motility toward laser ablation in MgPTX-ind and Ctrl mice after tamoxifen induction. Scale bar, 20 μm. Data are mean ± s.e.m. n = 5 MgPTX-ind and n = 4 Ctrl mice. Overall genotype effect #
P = 0.005 by two-sample t-test of mean AUC. * P < 0.05, ** P < 0.01 for comparison at individual time points by two-sample t-test. c, Pilocarpine dose (left) and latency (right) to reach Stage 4 seizures. Data are mean ± s.e.m. n = 8 MgPTX-ind and n = 4 Ctrl mice. * P = 0.0138, ** P = 0.0061, respectively by unpaired two-tailed t-test. d, Percentage of THIK-1 co-localization with tdTomato-expressing microglia in MgPTX-ind and Ctrl mice. Data are mean ± s.e.m. n = 4 mice per genotype, 3 brain sections/brain region/mouse. *P = 0.0105. n.s., not significant by one-way ANOVA. e, Confocal images of cortical Tomato-positive microglia in MgPTX-ind and Ctrl mice 1–2 months after tamoxifen administration. Scale bar, 50 μm. Data are mean ± s.e.m. n = 3 MgPTX-ind mice and n = 4 Ctrl mice. Not significant by unpaired two-tailed t-test. sections/brain region/mouse. *P = 0.0105. n.s., not significant by one-way ANOVA. e, Confocal images of cortical Tomato-positive microglia in MgPTX-ind and Ctrl mice 1–2 months after tamoxifen administration. Scale bar, 50 μm. Data are mean ± s.e.m. n = 3 MgPTX-ind mice and n = 4 Ctrl mice. Not significant by unpaired two-tailed t-test.
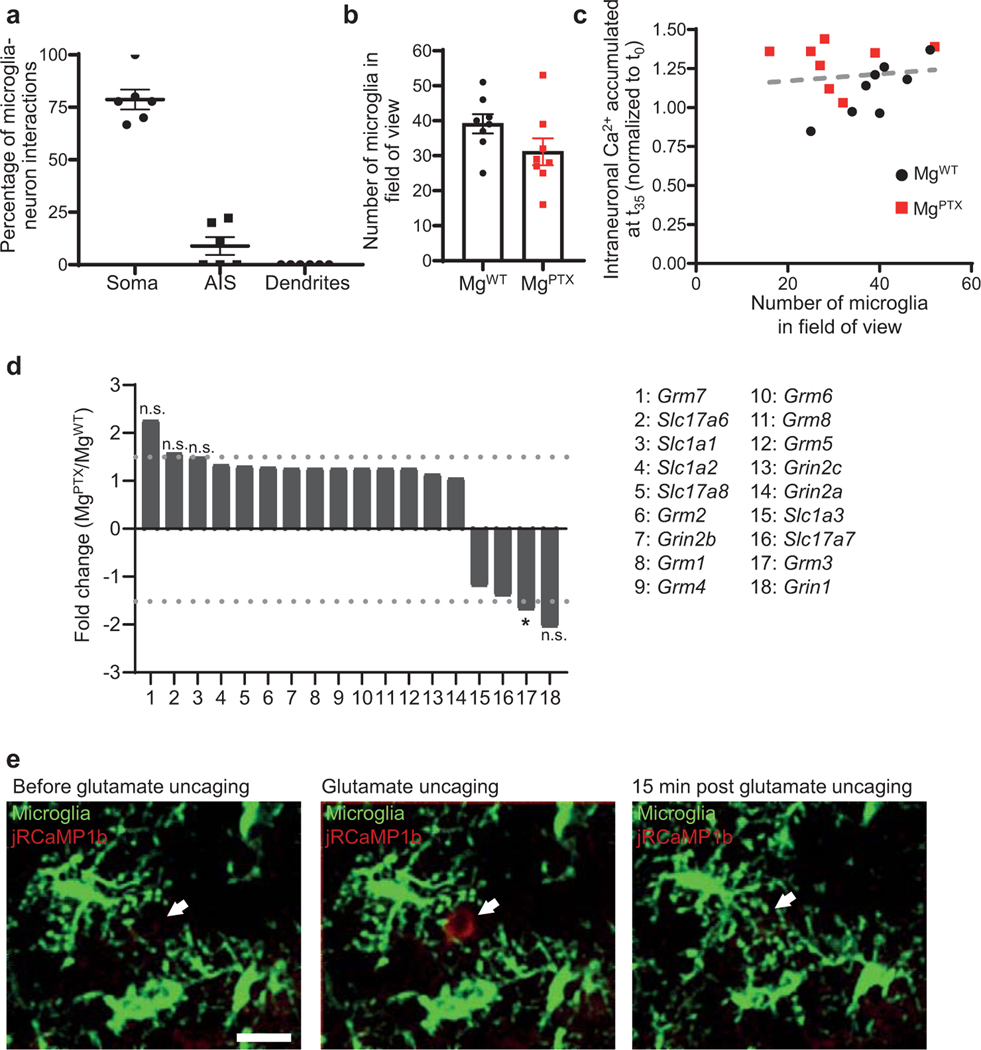
a, Location of microglia process contacts onto jRCaMP1b-expressing neurons in the whisker barrel cortex of MgWT mice (images shown in Fig. 2d). Each data point represents the average percentage of all microglia–neuron contacts quantified in an individual mouse. Data are mean ± s.e.m. n = 6 mice. AIS, axonal initial segment. b, Number of microglia in the FOV during in vivo 2P time-lapse imaging of microglial motilities and neuronal activity in awake MgWT and MgPTX mice. Data are mean ± s.e.m. n = 8 mice per genotype. Not significant, (P = 0.114) by two-tailed unpaired t-test. c, Correlation analysis of intraneuronal Ca2+ accumulation and number of microglia in awake MgWT and MgPTX mice. n = 8 mice per genotype. R2 = 0.0059; deviation from zero = not significant (P = 0.856) by linear regression analysis (dotted red line). d, Gene expression of metabotropic (Grm) and ionotropic (Grin) receptors and glutamate transporters (Slc) in MgPTX microglia compared to MgWT microglia. Data from microglia from n = 3 mice/genotype. Dotted lines indicate 1.5-fold change threshold levels. *P = 0.0245; n.s., not significant by unpaired two-tailed t-test. e, In vivo 2P time-lapse imaging of focal (arrows) glutamate uncaging-induced neuronal Ca2+ transients (jRCaMP1b, red) and directed microglia motilities (green) in the cortex of awake MgWT mice. Scale bar, 25 μm. Representative images are shown for n = 3 mice.
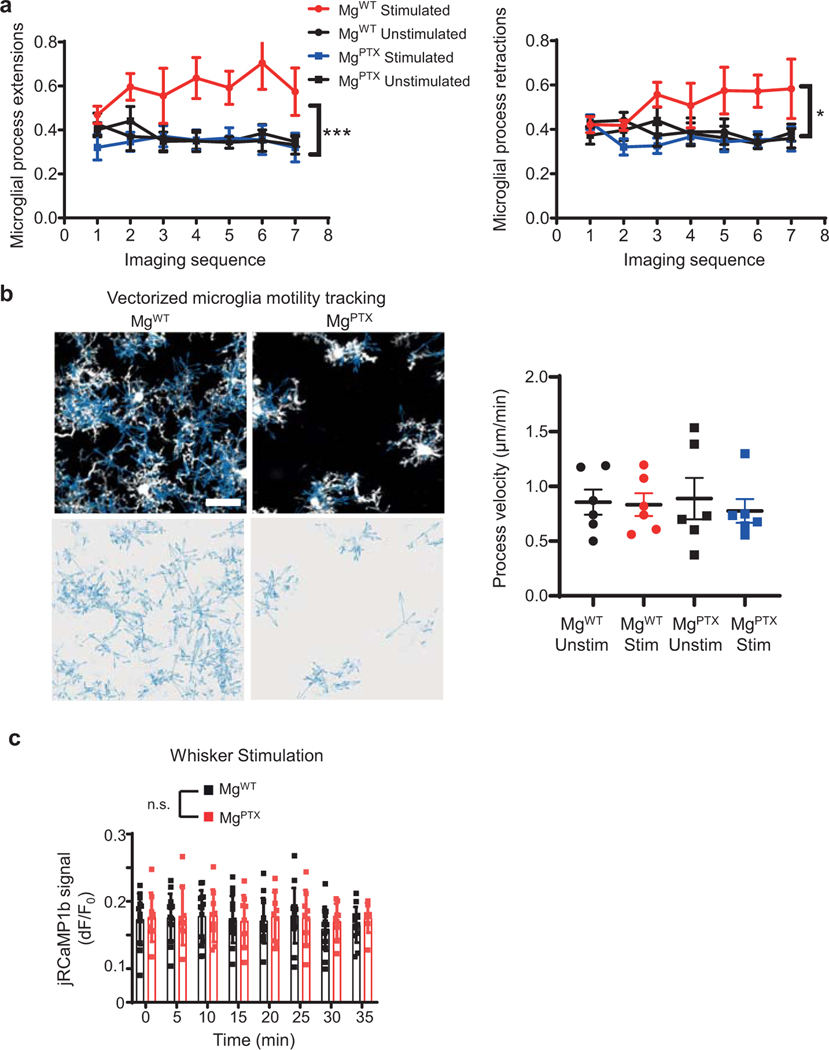
a, In vivo 2P time-lapse imaging of individual microglial process extensions and retractions in awake MgWT and MgPTX mice during whisker stimulation (“Stim”) and non-stimulation (“Unstim”) conditions. Data are mean ± s.e.m. n = 6 mice per genotype. *P = 0.018 (MgWT Stimulated vs. all other conditions) and ***P = 0.0083 (MgWT vs. MgPTX mice) by two-way ANOVA. b, Velocity (blue vectors) of individual microglia process dynamics (white) in MgWT and MgPTX mice. Scale bar, 25 μm. Data are mean ± s.e.m. n = 6 mice per genotype. No significant difference by two-way ANOVA with post hoc Tukey’s multiple comparison test. c, Ca2+ peak amplitudes of whisker stimulation-induced neuronal Ca2+ transients in MgPTX and MgWT mice. Data are mean ± s.e.m. n = 14 MgWT and n = 9 MgPTX mice. No significant difference by-two-sample t-test of mean AUC and Permutation test.
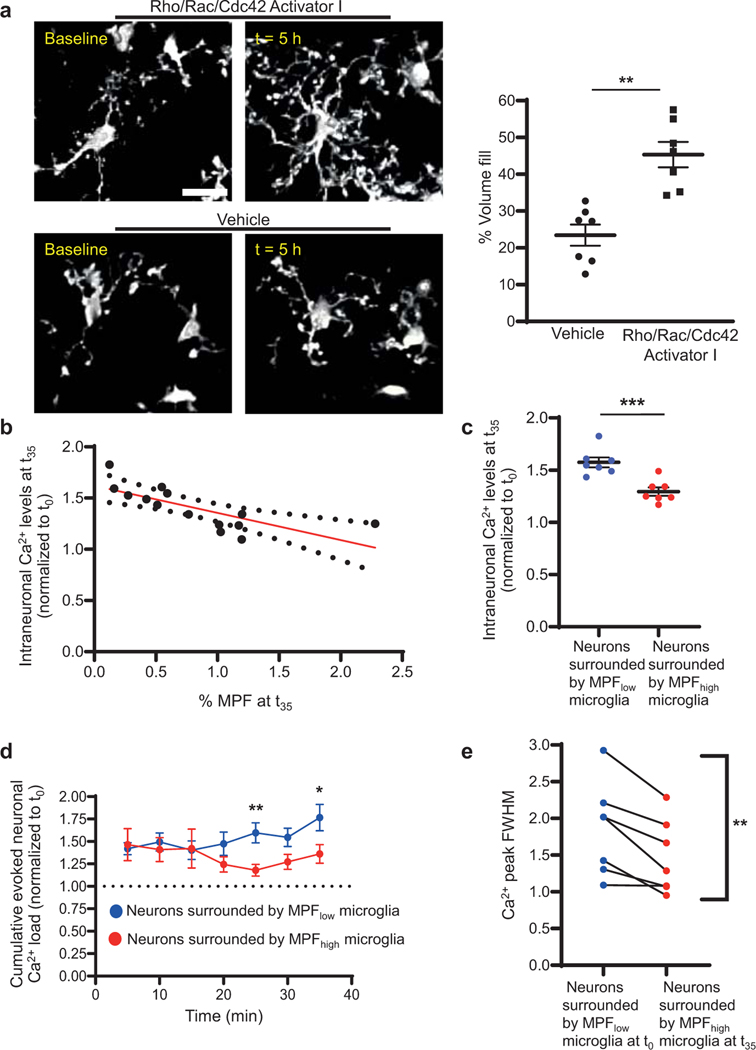
a, In vivo 2P images of microglial process extensions at baseline and after Rho/Rac/Cdc42 Activator I or vehicle (ACSF) in MgPTX mice. Scale bar, 25 μm. Data are mean ± s.e.m. n = 7 mice per condition, 5–10 microglia/mouse/condition. ** P = 0.0054 by paired two-tailed t test. b, Correlation between microglia process fill (MPF) and cumulative whisker stimulus-induced neuronal Ca2+ levels 5 h after Rho/Rac/Cdc42 Activator I administration. Data are mean ± s.e.m. n = 7 MgPTX mice. Deviation from zero = significant (P = 0.0023); R = 0.553 (linear regression analysis [red line]); 95% confidence intervals (dotted black lines). c, Cumulative Ca2+ levels in neurons surrounded by microglia with MPF increase at t35 compared to t0 of the whisker stimulation (MPFhigh microglia) 5 h after administration of Rho/Rac/Cdc42 Activator I. Data are mean ± s.e.m. n = 7 MgPTX mice. *** P = 0.0007 for overall treatment effect by unpaired two-tailed t test. d, Total Ca2+ signal in neurons surrounded by either MPFlow or MPFhigh microglia in the FOVs described in (b) and (c). Data are mean ± s.e.m. n = 7 MgPTX mice. * P = 0.01073 and ** P = 0.00672 at individual time points (multiple unpaired t tests, Holm-Sidak). e, Intraneuronal Ca2+ peak FWHM of neurons surrounded by MPFlow microglia at t0 and by MPFhigh microglia at t35. Data are mean ± s.e.m. n = 7 MgPTX mice. ** P = 0.0057 for overall treatment effect (paired two-tailed t test).
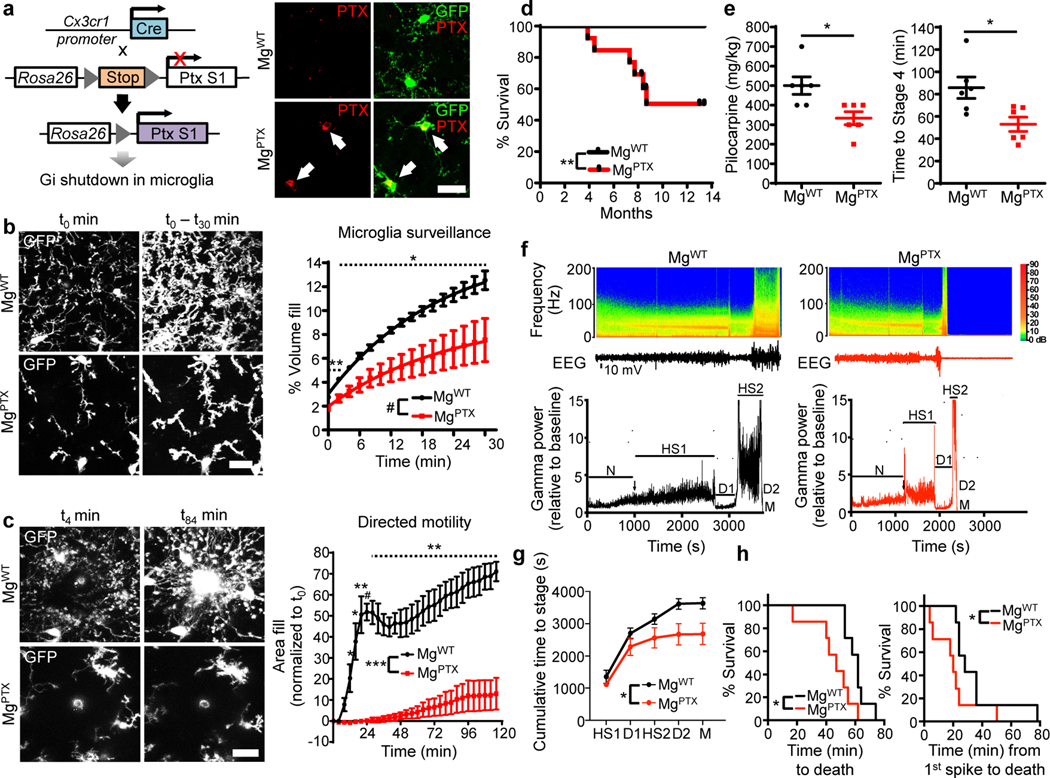
a, Generation of MgPTX mice (left); confocal microscopy in cortex of PTX (red) and microglia (green) in MgPTX and MgWT mice. Arrows indicate PTX-positive microglia. Scale bar, 50 μm. 60.5 ± 2.7% (mean ± s.e.m.) of cortical GFP-positive cells express PTX. n = 3 mice. b, In vivo 2P time-lapse imaging of cumulative microglial surveillance. Data are mean ± s.e.m. n = 6 mice per genotype. Overall genotype effect #
P = 0.024 by unpaired two-sample t-test of mean AUC. * P < 0.05, ** P < 0.01 at individual time points by permutation test. c, In vivo 2P time-lapse imaging of microglial directed process motility towards laser ablation. Scale bar, 20 μm. Data are mean ± s.e.m. n = 4 mice per genotype. Overall genotype effect *** P = 0.0004 by unpaired two-sample t-test of mean AUC. Dotted line indicates * P < 0.05, ** P < 0.01, #
P < 0.001 at individual time points by unpaired two-sample t-test. d, Survival curves of MgPTX and MgWT mice. n = 13 mice per genotype. ** P = 0.0056 by Log-rank test. e, Pilocarpine dose (left) and latency (right) to reach Stage 4 seizures for MgPTX and MgWT mice. Data are mean ± s.e.m. n = 6 mice per genotype. * P = 0.014 and 0.017, respectively, by-unpaired two-tailed t-test. f, Spectrograms (top) and gamma oscillatory power traces (bottom) from EEG recordings during pilocarpine induced-seizures. EEG stages: N, normal; HS1, 1st hypersynchrony; D1, 1st depression; HS2, 2nd hypersynchrony; D2, 2nd depression; M, Mortality. Representative data from n = 7 mice per genotype with similar results. g, Cumulative time to each pilocarpine-induced seizure stage in MgPTX and MgWT mice. Data are mean ± s.e.m. n = 7 mice per genotype. * P = 0.032 for genotype effect by two-way repeated-measures ANOVA. h, Survival curves for pilocarpine-induced time to death (left) and from 1st epileptiform spike to death (right). n = 7 mice per genotype. * P = 0.0127 (time to death) and 0.0333 (time from 1st spike to death) by Gehan-Breslow-Wilcoxon test.
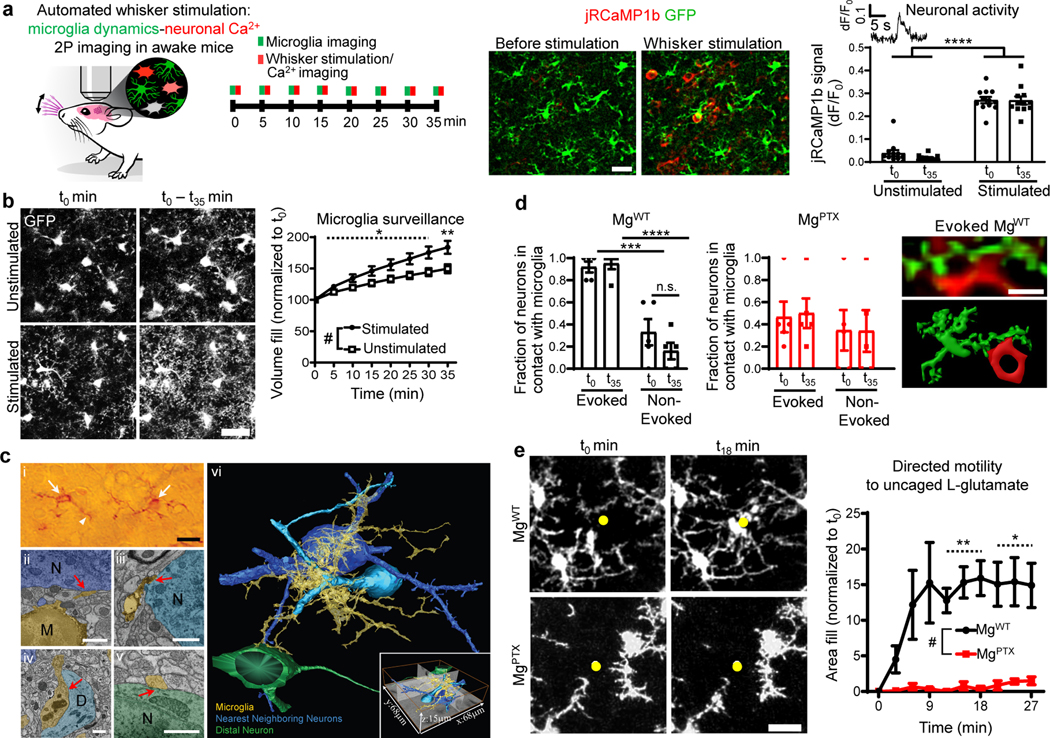
a, In vivo 2P imaging of microglia (GFP, green) and neuronal Ca2+ (jRCaMP1b, red) transients in the barrel cortex during whisker stimulation in awake Cx3cr1GFP/+ mice. Scale bar, 50 μm. Data are mean ± s.e.m. n = 12 mice. **** P < 0.0001 by two-way ANOVA. b, In vivo 2P images of cumulative microglial surveillance during whisker stimulation. Scale bar, 20 μm. Data are mean ± s.e.m. n = 12 mice per condition. Overall condition effect #
P = 0.021 by unpaired two-sample t-test of mean AUC. Dotted line indicates * P < 0.05 at individual time points by permutation test. c, SBEM and volumetric image analysis of microglial cell contacts with surrounding neurons. (i) Transmitted light microscopy of immunoperoxidase-labeled P2Y12R cell bodies (arrows) and processes (arrowheads). Scale bar, 20 μm. 2D electron micrographs of microglia (yellow) contact sites on nearest neighbor neuron somata (ii, iii; deep and light blue), a dendrite (iv, light blue), a distal neuron soma (v, green). Scale bars, 1 μm. (vi) 3D reconstruction of a microglia (yellow) contacting two nearest neurons (deep and light blues) and a distal neuron (green). SBEM volume dimensions (inset). Representative 3D reconstruction from 4 microglia from n = 3 MgWT mice. d, Evoked and non-evoked neuronal somata upon whisker stimulation in contact with microglia in MgWT and MgPTX mice. Data are mean ± s.e.m. n = 5 mice per genotype. *** P = 0.0003 and **** P < 0.0001 by two-way ANOVA and Tukey’s multiple comparisons test; Right, in vivo 2P image (top) and 3D reconstruction (bottom) of microglia (green) contacting a jRCaMP1b-expressing neuronal soma (red) in MgWT barrel cortex during whisker stimulation. Scale bar, 20 μm. e, In vivo 2P time-lapse of microglial directed motility in response to glutamate uncaging in somatosensory cortex (left); right, microglia area fill around uncaging site (yellow dot). Scale bar, 20 μm. Data are mean ± s.e.m. n = 5 MgPTX and n = 4 MgWT mice. Overall genotype effect #
P = 0.015 by unpaired two-sample t-test of mean AUC. * P < 0.05, ** P < 0.01 at individual time points by unpaired two-sample t-test.
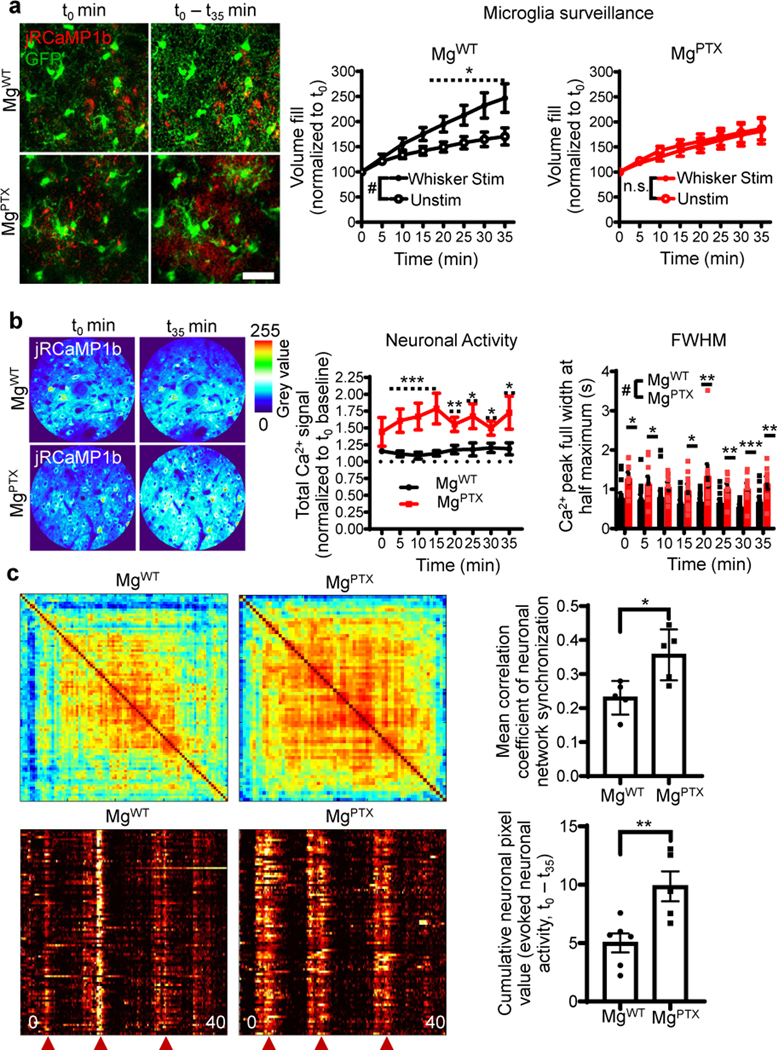
a, In vivo 2P imaging of cumulative microglia surveillance (green) and neuronal activity (red) in the barrel cortex upon whisker stimulation in awake MgWT and MgPTX mice. Scale bar, 20 μm. Data are mean ± s.e.m. n = 7 mice (unstimulated) and n = 8 mice (whisker stimulation). Overall stimulation effect #
P = 0.042 by unpaired two-sample t-test of mean AUC. * P < 0.05 at individual time points by permutation test. n.s., no significant difference for overall effect by-unpaired two-sample t-test of mean AUC. b, Heatmaps of cumulative evoked neuronal Ca2+ and quantification of neuronal activity and peak full width at half maximum (FWHM) during whisker stimulation in awake MgPTX and MgWT mice. Data are mean ± s.e.m. n = 9 MgPTX and n = 14 MgWT mice. Neuronal activity, overall genotype effect #
P = 0.016 by unpaired two-sample t-test of mean AUC. * P < 0.05, ** P < 0.01, *** P < 0.001 at individual time points by permutation test. FWHM, overall genotype effect #
P = 0.00009 by unpaired two-sample t-test of mean AUC and * P < 0.05, ** P < 0.01, *** P < 0.001 for individual time points by permutation test. c, Clustered correlation matrix of synchronized neuronal network firing (top) and raster plots of synchronized neuronal network burst activity (bottom) during whisker stimulation in MgWT and MgPTX mice. Red arrowheads indicate whisker stimulus. Data are mean ± s.e.m. n = 5 MgPTX and n = 6 MgWT mice. * P = 0.0139, ** P = 0.0092 by unpaired two-tailed t-test.
Comment in
-
Guardians of the Frequency: Neuronal Regulation by Microglia.Epilepsy Curr. 2021 Apr 5;21(3):15357597211004568. doi: 10.1177/15357597211004568. Online ahead of print. Epilepsy Curr. 2021. PMID: 33820468 Free PMC article.
References
-
- Davalos D, Grutzendler J, Yang G, Kim JV, Zuo Y. et al. ATP mediates rapid microglial response to local brain injury in vivo. Nat Neurosci 8, 752–758 (2005). - PubMed
-
- Nimmerjahn A, Kirchhoff F. & Helmchen F. Resting microglial cells are highly dynamic surveillants of brain parenchyma in vivo. Science 308, 1314–1318 (2005). - PubMed
Publication types
MeSH terms
Substances
Grants and funding
- K99 AG062776/AG/NIA NIH HHS/United States
- R35 NS097976/NS/NINDS NIH HHS/United States
- RF1 AG064926/AG/NIA NIH HHS/United States
- TL1 TR001871/TR/NCATS NIH HHS/United States
- F32 NS096920/NS/NINDS NIH HHS/United States
- R01 AG047313/AG/NIA NIH HHS/United States
- U24 NS120055/NS/NINDS NIH HHS/United States
- C06 RR018928/RR/NCRR NIH HHS/United States
- RF1 AG062234/AG/NIA NIH HHS/United States
- T32 AI007334/AI/NIAID NIH HHS/United States
- K02 NS110973/NS/NINDS NIH HHS/United States
- R24 GM137200/GM/NIGMS NIH HHS/United States
- S10 OD021784/OD/NIH HHS/United States
LinkOut - more resources
Full Text Sources
Molecular Biology Databases
