. 2020 Dec 15;11(1):6389.
doi: 10.1038/s41467-020-19929-w.

A collection of bacterial isolates from the pig intestine reveals functional and taxonomic diversity

Affiliations

A collection of bacterial isolates from the pig intestine reveals functional and taxonomic diversity

David Wylensek et al. Nat Commun. .

Abstract

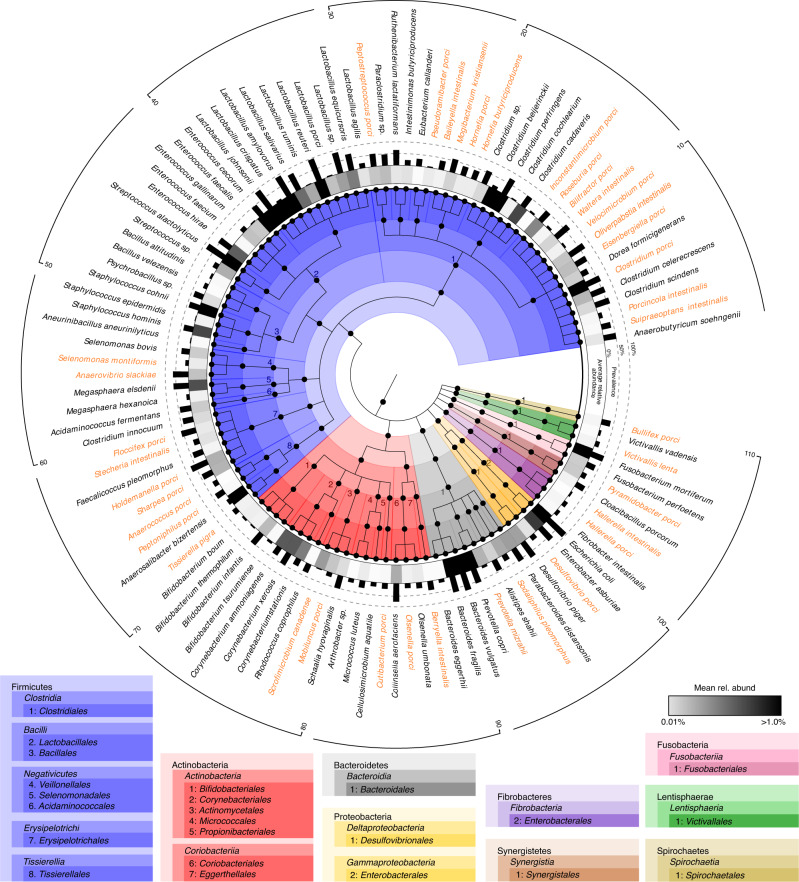
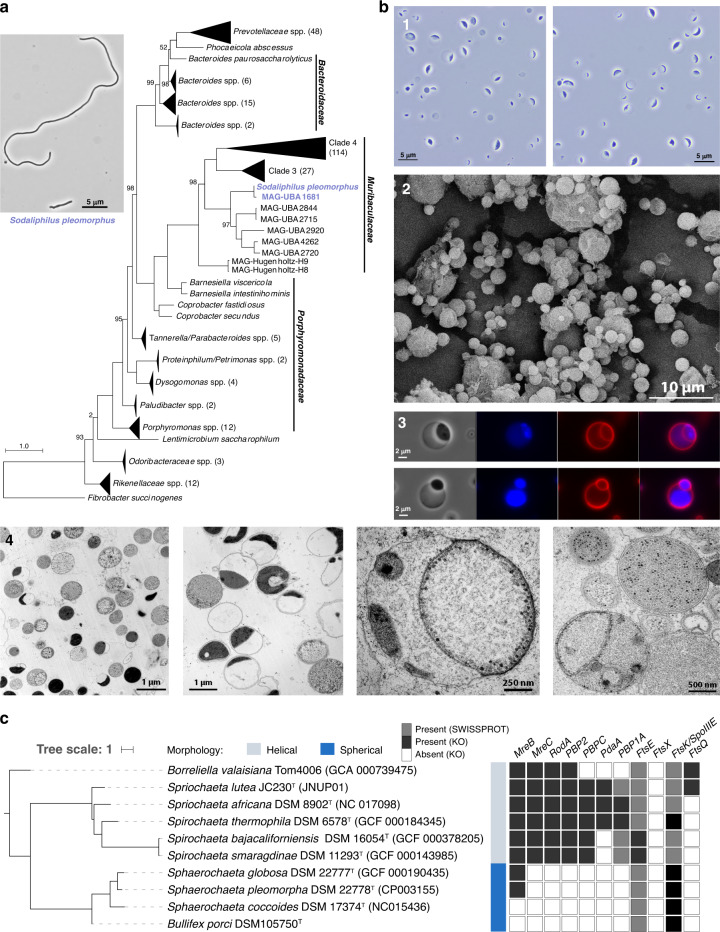
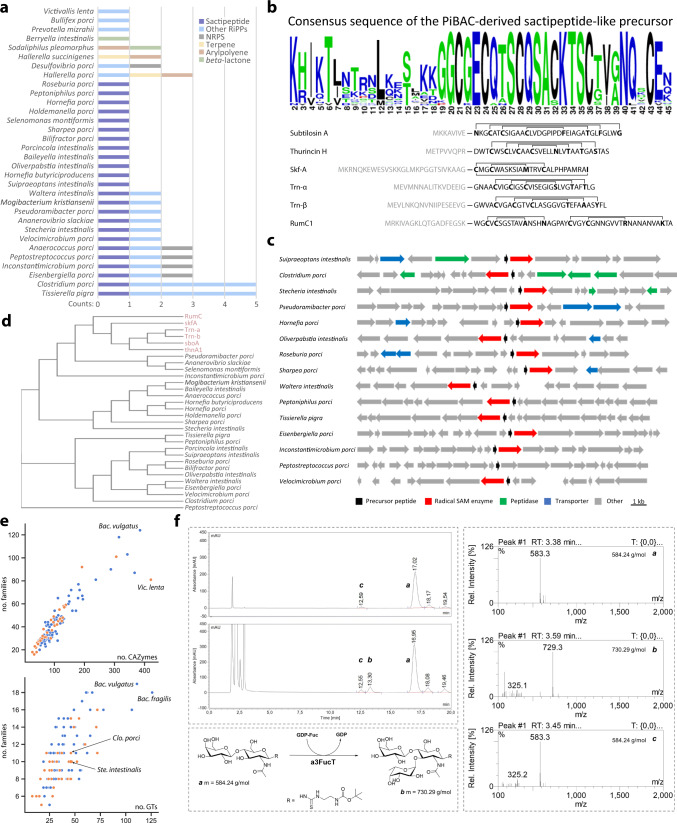
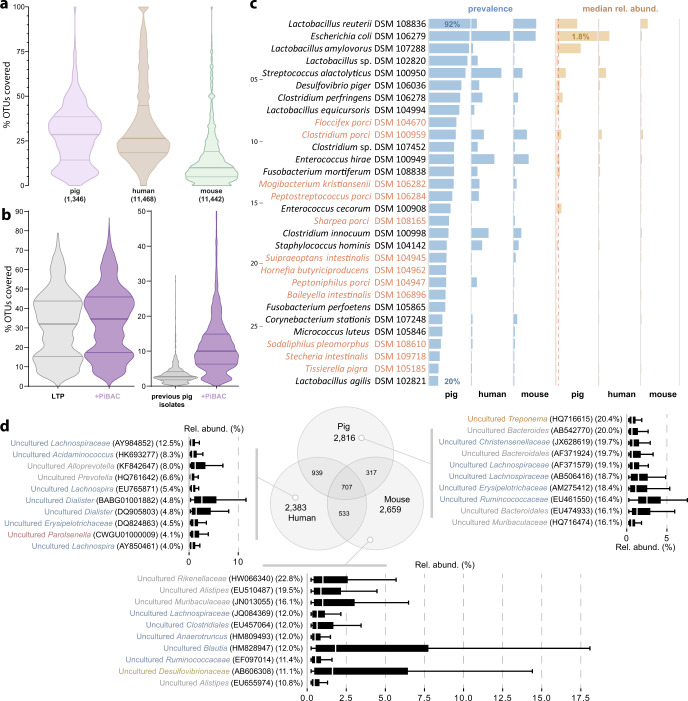
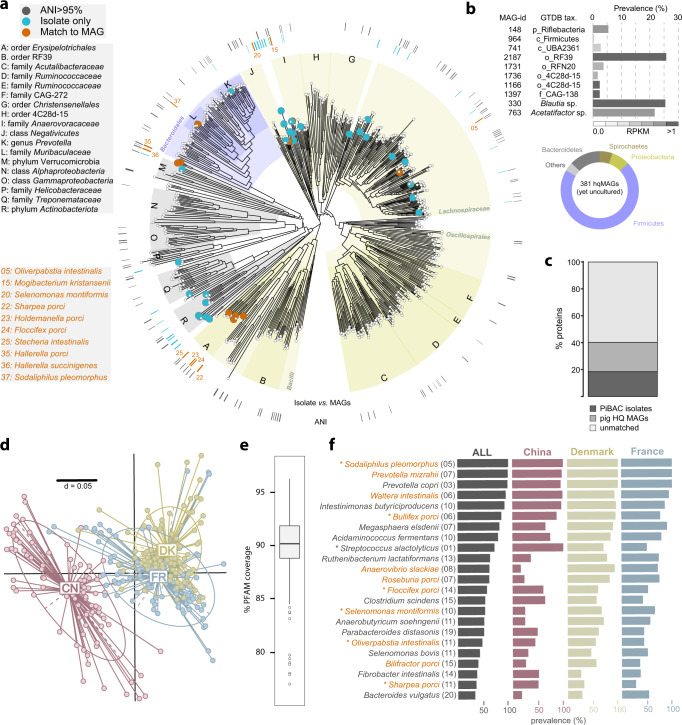
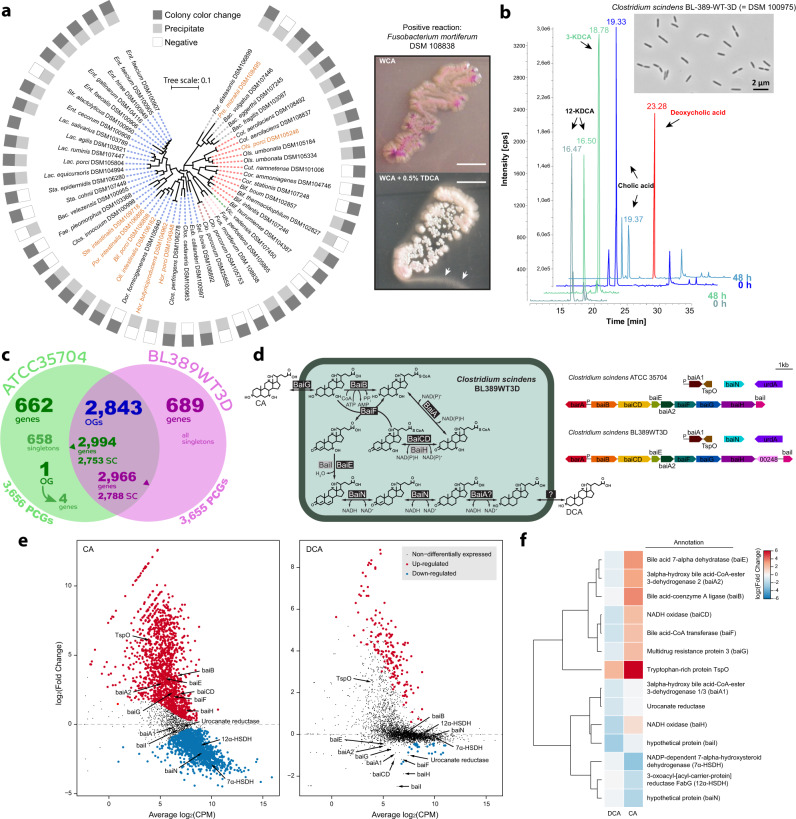
Our knowledge about the gut microbiota of pigs is still scarce, despite the importance of these animals for biomedical research and agriculture. Here, we present a collection of cultured bacteria from the pig gut, including 110 species across 40 families and nine phyla. We provide taxonomic descriptions for 22 novel species and 16 genera. Meta-analysis of 16S rRNA amplicon sequence data and metagenome-assembled genomes reveal prevalent and pig-specific species within Lactobacillus, Streptococcus, Clostridium, Desulfovibrio, Enterococcus, Fusobacterium, and several new genera described in this study. Potentially interesting functions discovered in these organisms include a fucosyltransferase encoded in the genome of the novel species Clostridium porci, and prevalent gene clusters for biosynthesis of sactipeptide-like peptides. Many strains deconjugate primary bile acids in in vitro assays, and a Clostridium scindens strain produces secondary bile acids via dehydroxylation. In addition, cells of the novel species Bullifex porci are coccoidal or spherical under the culture conditions tested, in contrast with the usual helical shape of other members of the family Spirochaetaceae. The strain collection, called 'Pig intestinal bacterial collection' (PiBAC), is publicly available at www.dsmz.de/pibac and opens new avenues for functional studies of the pig gut microbiota.


Conflict of interest statement

The authors declare no competing interests.

Figures

Fig. 1
Fig. 1. Species within the pig intestinal bacterial collection (PiBAC).
Cladogram depicting the taxonomic classification of all 110 species. The colour code is according to phyla and the lineage of bacteria is given in boxes below the cladogram. Novel taxa (their candidate names) appear in orange letters. The outer black bars represent the prevalence of each species as determined by 16S rRNA gene search against 1346 pig gut-derived amplicon datasets (see Methods). The grey gradient below indicates the mean relative abundances of each isolate in the samples that were positive for the given species.
Fig. 2
Fig. 2. Novel diversity within the collection.
a Phylogenomic tree of Sodaliphilus pleomorphus within members of the order Bacteroidales (phylum Bacteroidetes) together with a phase contrast micrograph of the strain grown on WCA agar with 5% sheep blood for 7 days at 37 °C under anaerobic conditions. b Microscopic investigations of Bullifex porci DSM 105750T. Picture 1 represent cells in their own growth medium observed immediately after removal from the anaerobic culture tube. The image was obtained using a N-Achroplan objective (100×/1,25 Oil Ph3 M27) mounted on an Axio Lab.A1 microscope equipped with an Axiocam 105 camera (Zeiss, Jena, Germany). Picture 2 is a scanning electron micrograph obtained as detailed in the methods section. Panel 3 shows cells stained with FM4-64 (red; membrane) and DAPI (blue; DNA) next to the same cells observed by phase contrast (left-hand side). Panel 4 shows cells imaged by transmission electron microscopy using 1.5% (first two pictures) or 0.2% (last two pictures) glutaraldehyde fixation. Multiple other images of B. porci obtained using a variety of sample preparations and microscopy techniques are available in Supplementary Figs. 8–10. c Phylogenomic tree showing the placement of B. porci among closest relatives within the family Spirochaetaceae (phylum Spirochaetes) together with the presence (black or grey boxes) or absence (white boxes) of genes involved in cell morphology and division, peptidoglycan synthesis, and cell wall formation (the entire set of genes tested is shown in Supplementary Fig. 2). Sphaerochaeta associata was not included in the analysis as no genome is yet available for this species. KO: KEGG orthology.
Fig. 3
Fig. 3. New bacterial functions.
a Number of biosynthetic gene clusters (BGCs) identified within the novel taxa. NRPS non-ribosomal peptide synthetase, RiPP ribosomally synthesized and post-translationally modified peptides. b Top: consensus amino acid sequence of the PiBAC-derived sactipeptide-like BGCs with high sequence similarity in the precursor peptide sequence. Bottom: amino acid sequences of currently known sactipeptide natural products. Grey letters indicate amino acids of the leader peptides cleaved off in final products. Lines between bold amino acid residues indicate cyclization in the mature peptide. c Comparison of genetic organizations flanking the putative sactipeptide-like BGCs exemplarily shown for 15 of the pig strains. d Phylogenetic tree comparing amino acid sequences of known sactipeptide precursors (top six entries in red) and those from the pig bacteria. e Number of single CAZymes against CAZymes familes (top) and glycosyltransferases (GT) against GT families (bottom) for each member of the collection (n = 117 genomes representing 110 species depicted as dots). All data are provided in Supplementary Data 1. Orange dots indicate the 38 novel taxa while blue dots represent known bacterial species. Bacterial names correspond to species with the highest numbers of single enzymes or enzyme families. The position of Clostridium porci and Stecheria intestinalis is also shown (bottom), as these species encoded a GT of family 10 (along with Bacteroides fragilis). f Reaction of the new FucT from C. porci with N-acetyllactosamine. Top left box: HPLC measurements of the reaction without (negative control; top chromatogram) or with the co-substrate GDP-fucose (bottom). Relevant peaks (compounds) are named with letters: a, substrate (LacNAc type 2); b, target product; c, unidentified product with the same mass as the substrate and proposed to be iso-LacNAc, an isomer of LacNAc with a different bond between galactose and GlcNAc leading to a shift in retention time; likely originates from remnant transglycosidase activity in the enzyme preparation as also observed in the negative control. Right box: mass spectra of the relevant HPLC peaks. Bottom left box: putative reaction pathway catalyzed by C. porci.
Fig. 4
Fig. 4. Host-specificity revealed by meta-analyses of 16S rRNA amplicons.
a Percentage of IMNGS-derived 16S rRNA amplicon reads from the pig, mouse, and human intestine (numbers of samples analysed indicated in brackets) covered by sequences from all isolates. Horizontal lines indicate the median (middle), 25% (bottom), and 75% (top) quantiles. b Coverage of the 1346 pig gut samples by the 16S rRNA gene sequences from 13,903 isolates available via the Living Tree Project (LTP) or from 31 strains isolated from the pig intestine and available from strain collections prior to the present work with (violet) or without (grey) addition of the 38 novel taxa in PiBAC. c List of the 30 isolates with significantly increased prevalence and relative abundances in the pig intestine. The number of samples considered were as in a. Novel taxa are written in orange letters. The dashed line indicates 0.1% median relative abundance. d Overlap of 16S rRNA amplicon-based molecular species between the three host species (pig, human, mouse). The number of samples considered are as in a. The Venn diagram shows OTU numbers common between or unique to the respective host. The box plots display the relative abundance of the respective top-10 prevalent, host-specific OTUs (their prevalence is in brackets; coloured according to phyla as in Fig. 1). The box plots indicate the median (middle line), 25% and 75% quantiles (bottom and top line, respectively), and 1.5 × inter-quantile range after Tukey. For analyses in c and d, mouse and human data were randomly sub-sampled to obtain a number comparable to pigs (n = 1346 samples).
Fig. 5
Fig. 5. Metagenome-based diversity and functional prediction.
a Phylogenomic tree of high-quality, bacterial metagenome-assembled genomes (MAGs) together with novel taxa within the collection. See text for tree construction and quality thresholds. The grey bars in the outer ring indicate genomes with a species-level match to MAGs archived in GTDB (ANI value >95%), no matter whether cultured or not. The colours in the inner ring indicate species-level match between the new PiBAC taxa and the MAGs catalogue. b Top: list of most-wanted taxa captured by metagenomics but without a cultured representative. Taxa were selected because they represent high taxonomic ranks and based on high prevalence or abundance. Bottom: coloured ring representing the phylum distribution of all 381 yet uncultured species represented by a high-quality (hq) MAG from the present study. c Contribution of the isolates and hqMAGs collected in the present study to the pig-derived metagenomic gene catalogue (7,685,872 proteins). d Jaccard similarity plot of PFAM-based metagenomic profiles of 284 pig faecal samples according to their country of origin: CN, China; Fr, France; DK, Denmark. e Functional coverage of the metagenomes in d (n = 284) by all species-level PiBAC genomes. The box plot indicates the median (middle line), 25% and 75% quantiles (bottom and top line, respectively), and 1.5 × inter-quantile range; outliers are indicated with dots. f List of the 23 species most often selected (>50% pigs in at least one country) within minimal communities (20 species on average) best matching the PFAM profiles of faecal pig metagenomes. The bar plots show the prevalence of each bacterial species across the entire cohort and in each country. The species marked with a star were identified as being enriched in pigs based on meta-amplicon or MAGs analysis (Figs. 4c and 5a). The numbers in bracket indicate the median selection rank of individual species across all minimal communities in which they were present. Novel taxa are written in orange letters.
Fig. 6
Fig. 6. Bile acids metabolism capacities and functional host-specific traits.
a Left: 16S rRNA gene-based phylogenetic tree showing the diversity of isolates able to deconjugate bile acids. Species (corresponding branches) are coloured according to phyla as in Fig. 1. Right: magnified pictures of a culture of Fusobacterium mortiferum grown on plates (WCA, Wilkins–Chalgren-Anaerobe medium) without (top) or with (bottom) addition of 0.5% (w/v) tauro-conjugated deoxycholic acid (TDCA). Two criteria were considered as indicative for positive reaction: (i) whitening of the colonies; (ii) formation of a halo surrounding colonies (solid medium; white arrows in the picture) or precipitates visible at the bottom of the wells and jellification of the medium when grown as liquid cultures (not shown). The scale bars represent 5 mm. b Chromatograms showing the conversion of cholic acid to deoxycholic acid by C. scindens DSM 100975. KDCA, ketodeoxycholci acid. The two chromatograms on top span the entire run time. The bottom ones are zoom-in sections (XIC:+MRM m/z 424.367/371.300 Da) until the indicated time to visualize the appearance of 3-KDCA. c Venn diagram of comparative genomic analysis between the human faecal isolate C. scindens ATCC 35704 and the pig isolate DSM 100975 (=BL-389-WT-3D). SC single-copy, PCG protein-coding genes, OG orthologous group. d Gene organization of the bile acid-inducible (bai) genes in the two strains and overview of the bile acid 7-alpha-dehydroxylation biochemical pathway. e Scatterplots of average log2(CPM) vs. log2(fold-change) from duplicate 0.1 mM cholic acid (CA) or deoxycholic acid (DCA) induced cultures of C. scindens DSM 100975. Genes involved in bile acid metabolism are labelled. f Heat map of bile acid-metabolizing genes from CA- and DCA-induced transcriptomes. Genes included in e and f were differentially expressed (+/−) 0.58 log2(FC) with false discovery rate (FDR) < 0.05.

References

    1. Engber D. What models eat. Nat. Med. 2018;24:692–695. doi: 10.1038/s41591-018-0055-1. - DOI - PubMed
    1. Gehrig JL, et al. Effects of microbiota-directed foods in gnotobiotic animals and undernourished children. Science. 2019;365:eaau4732. doi: 10.1126/science.aau4732. - DOI - PMC - PubMed
    1. Gonzalez LM, Moeser AJ, Blikslager AT. Porcine models of digestive disease: the future of large animal translational research. Transl. Res. 2015;166:12–27. doi: 10.1016/j.trsl.2015.01.004. - DOI - PMC - PubMed
    1. Flisikowska T, et al. A porcine model of familial adenomatous polyposis. Gastroenterology. 2012;143:1173–1175. doi: 10.1053/j.gastro.2012.07.110. - DOI - PubMed
    1. Blutke A, et al. The Munich MIDY Pig Biobank - a unique resource for studying organ crosstalk in diabetes. Mol. Metab. 2017;6:931–940. doi: 10.1016/j.molmet.2017.06.004. - DOI - PMC - PubMed

Publication types

MeSH terms

LinkOut - more resources