. 2020 Dec 15;10(1):21967.
doi: 10.1038/s41598-020-78955-2.

Differential metabolic responses in breast cancer cell lines to acidosis and lactic acidosis revealed by stable isotope assisted metabolomics

Affiliations

Differential metabolic responses in breast cancer cell lines to acidosis and lactic acidosis revealed by stable isotope assisted metabolomics

Jiayue Gao et al. Sci Rep. .

Abstract

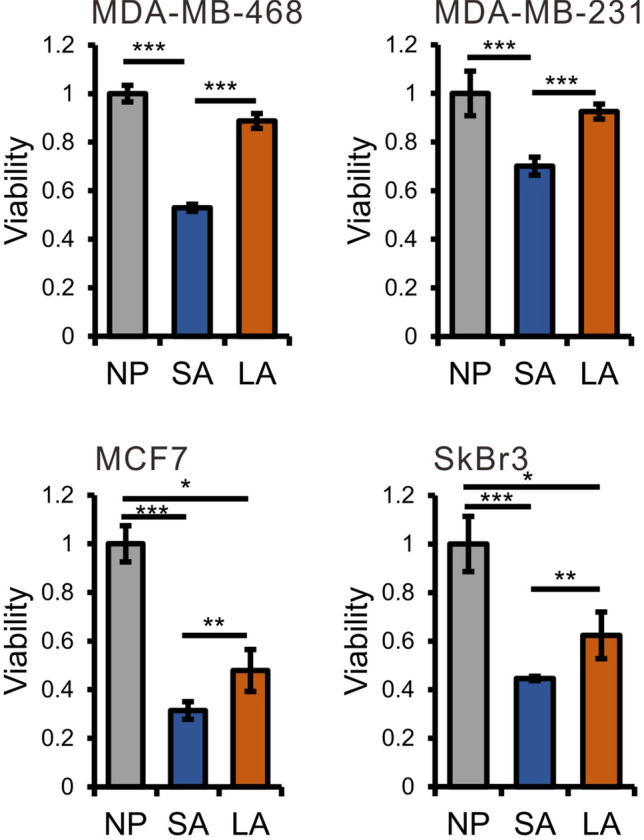
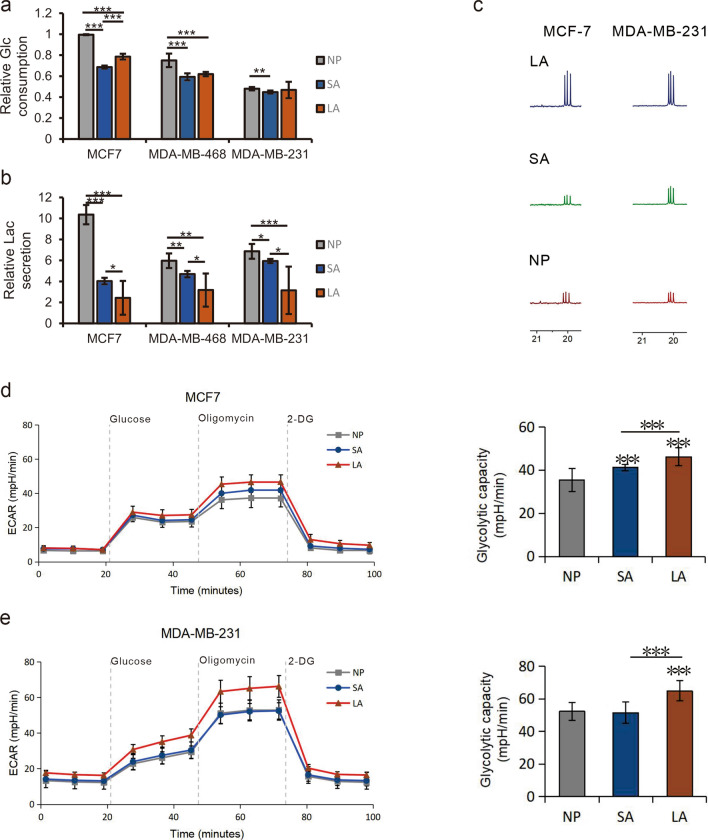
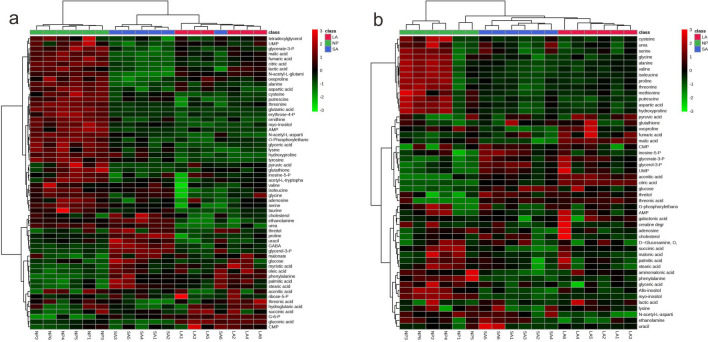
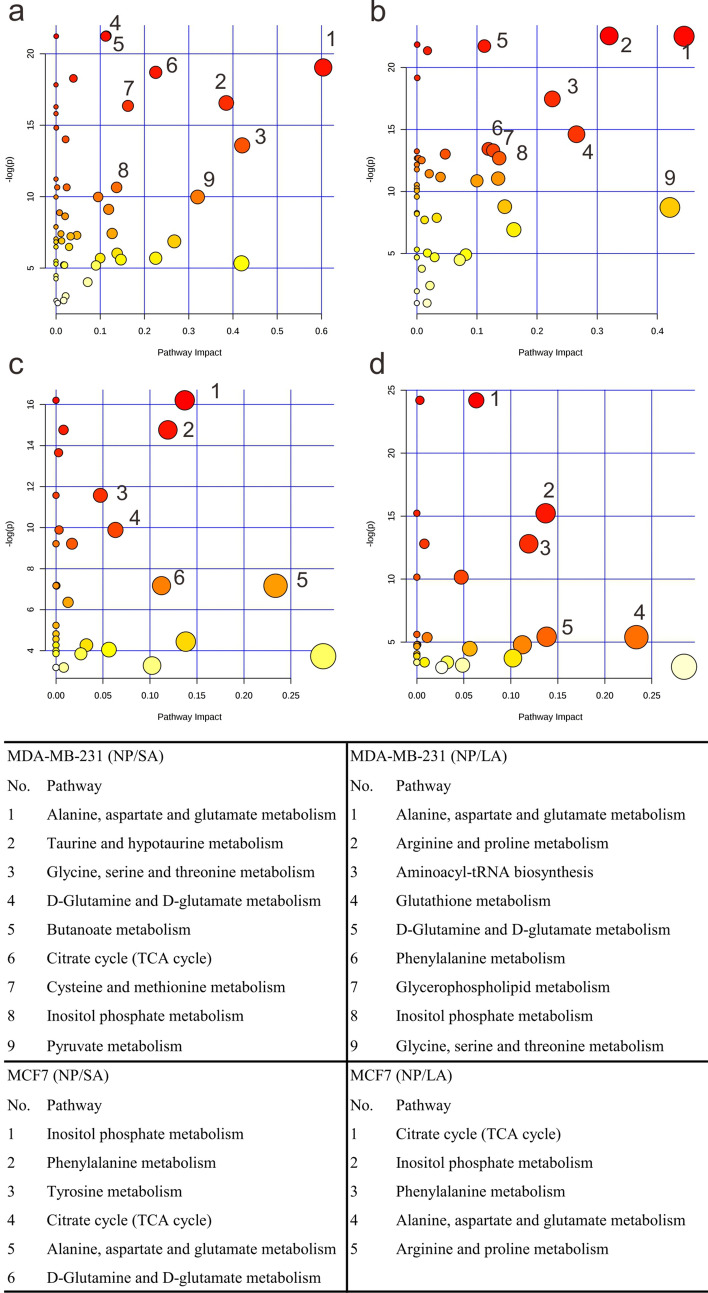
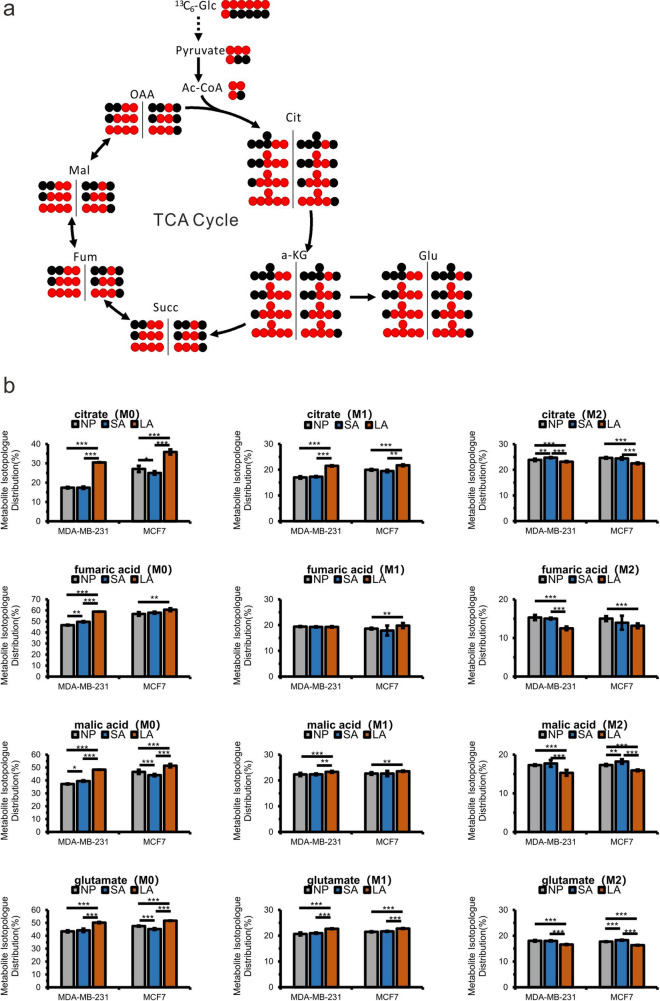
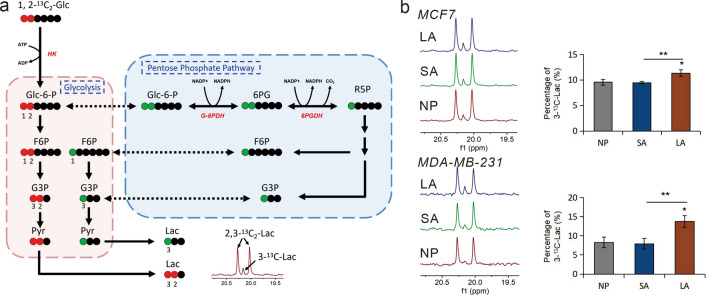
Extracellular acidosis is considered as a hallmark of most human tumors, which plays an important role in promoting tumor malignant and aggressive phenotype in tumorigenesis. Acidosis and lactic acidosis can induce different responses in tumors. Previous studies have associated the response to lactic acidosis of tumors with good survival outcomes. In this study, we investigated the metabolomic changes in triple negative and luminal subtype breast cancer cell lines in response to acidosis and lactic acidosis. Our results showed that acidosis results in the reduction of cell viability and glycolysis in breast cancer cells, which is reversely correlated with the malignancy of cell lines. Under lactic acidosis, this reduction is reversed slightly. Untargeted metabolomic profiling revealed that glutaminolysis and fatty acid synthesis in cancer cells under acidosis are increased, while TCA cycle and glycolysis are decreased. Under lactic acidosis, the pentose phosphate pathway and acetate release are increased in MDA-MB-231 cells. The current results uncovered the different metabolic responses of breast cancer cells to acidosis and lactic acidosis, demonstrating the power of combined untargeted and stable isotope assisted metabolomics in comprehensive metabolomic analysis.


Conflict of interest statement

The authors declare no competing interests.

Figures

Figure 1
Figure 1
Lactate acidosis can reverse the decrease in viability of breast cancer cells induced by acidosis (NP normal pH groups, SA acidosis groups, LA lactic acidosis groups). Values are expressed as mean ± SD. *P < 0.05, **P < 0.01, ***P < 0.001 by unpaired Student’s test, n = 6.
Figure 2
Figure 2
Acidosis can decrease the glycolysis in cancer cells. Glucose consumption (a) and lactate excretion (b) of breast cancer cells under different culture conditions. 13C NMR spectra of labeled lactic acid in MCF-7 and MDA-MB-231 cell lines (c). The MCF7 (d) and MDA-MB-231 (e) cells were detected for ECAR after treated for 48 h. Values are expressed as mean ± SD. *P < 0.05, **P < 0.01, ***P < 0.001 by unpaired Student’s test, n ≥ 6.
Figure 3
Figure 3
Heat maps of the identified metabolites in MDA-MB-231 (a) and MCF-7 (b).
Figure 4
Figure 4
Affected metabolic pathways in MDA-MB-231 (a,b) and MCF-7 (c,d) cells under acidosis (a,c) and lactic acidosis (b,d).
Figure 5
Figure 5
Changes in TCA cycle metabolism. (a) The labeling scheme showing 13C atom derived from U-13C6-glucose and 1-13C-glucose from glucose (red dots). The black dots represent 12C atoms. (b) Comparisons of mass isotopologue distributions (MIDs) of citrate, fumaric acid, malic acid and glutamate of MDA-MB-231 and MCF-7 cells.
Figure 6
Figure 6
Metabolism of 1,2-13C2 glucose through glycolysis and pentose phosphate pathway (PPP) with the labeling pattern of lactate. (a) The scheme shows the fate of individual carbons through glycolysis (red dots, 13C) and PPP (green dots, 13C), labeling in Glc-6-P, F6P, G3P, Pyr and Lac. Black dots represent 12C atoms. (b) 13C-NMR spectra (left) and the corresponding histogram (right) from MDA-MB-231 and MCF-7 media after cultured in NP, SA and LA. 3-13C-Lac (%) = [3-13C-Lac] / ([3-13C-Lac] + [2,3-13C2-Lac] ).

References

    1. Hulikova A, Harris AL, Vaughan-Jones RD, Swietach P. Regulation of intracellular pH in cancer cell lines under normoxia and hypoxia. J. Cell Physiol. 2013;228:743–752. doi: 10.1002/jcp.24221. - DOI - PubMed
    1. Koshiji M, et al. HIF-1alpha induces cell cycle arrest by functionally counteracting Myc. EMBO J. 2004;23:1949–1956. doi: 10.1038/sj.emboj.7600196. - DOI - PMC - PubMed
    1. Gordan JD, Bertout JA, Hu CJ, Diehl JA, Simon MC. HIF-2alpha promotes hypoxic cell proliferation by enhancing c-myc transcriptional activity. Cancer Cell. 2007;11:335–347. doi: 10.1016/j.ccr.2007.02.006. - DOI - PMC - PubMed
    1. Gao X, et al. Acetate functions as an epigenetic metabolite to promote lipid synthesis under hypoxia. Nat. Commun. 2016;7:11960. doi: 10.1038/ncomms11960. - DOI - PMC - PubMed
    1. Yuan Y. Spatial heterogeneity in the tumor microenvironment. Cold Spring Harb. Perspect Med.. 2016;6:a026583. doi: 10.1101/cshperspect.a026583. - DOI - PMC - PubMed

Publication types