Meta-Analysis
. 2021 Feb;298(2):E70-E80.
doi: 10.1148/radiol.2020203557. Epub 2020 Dec 15.

Pulmonary Embolism and Deep Vein Thrombosis in COVID-19: A Systematic Review and Meta-Analysis

Affiliations
Meta-Analysis

Pulmonary Embolism and Deep Vein Thrombosis in COVID-19: A Systematic Review and Meta-Analysis

Young Joo Suh et al. Radiology. 2021 Feb.

Abstract

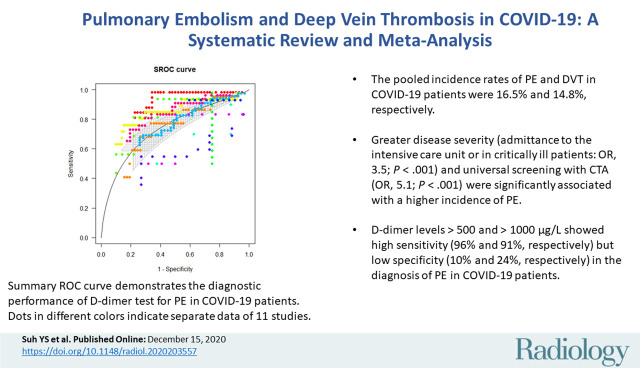
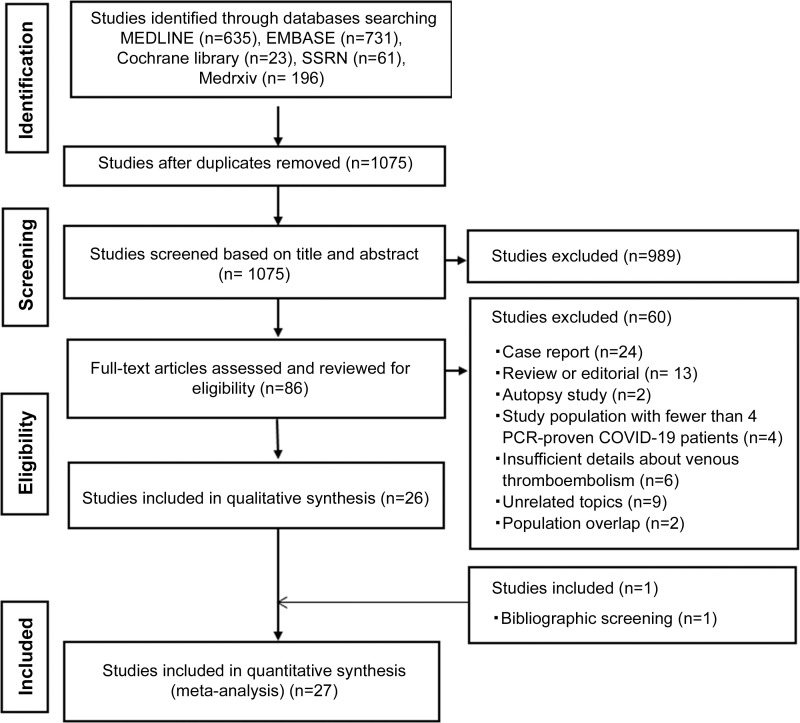
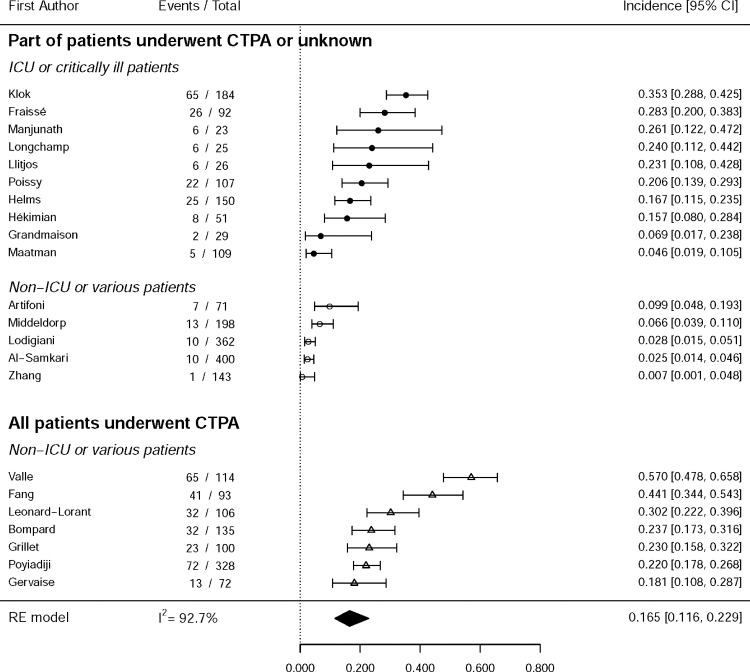
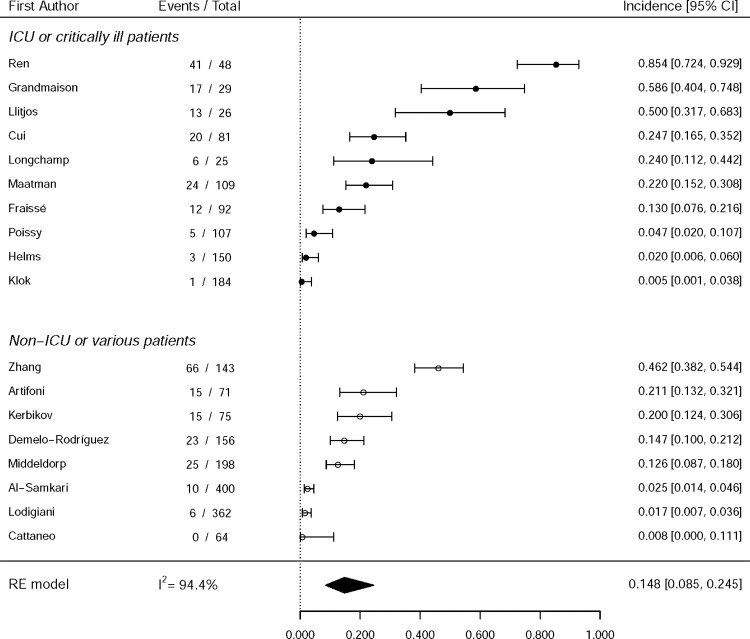
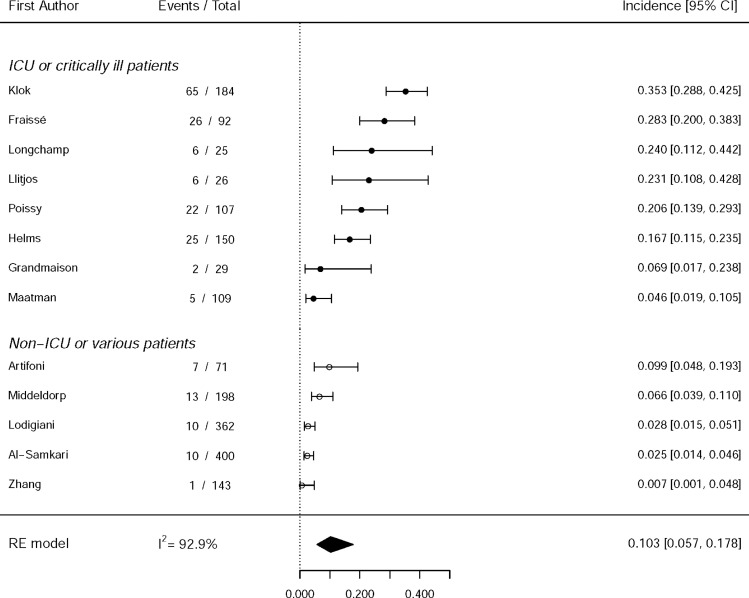
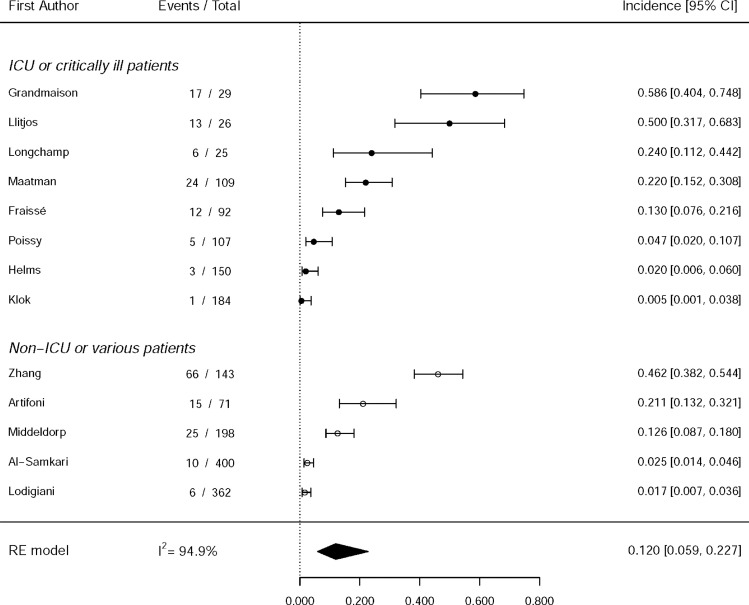
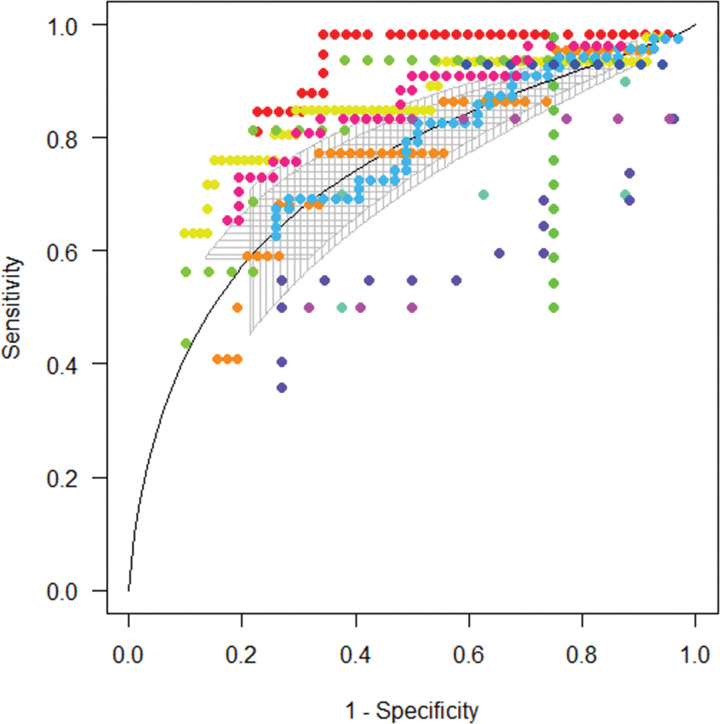
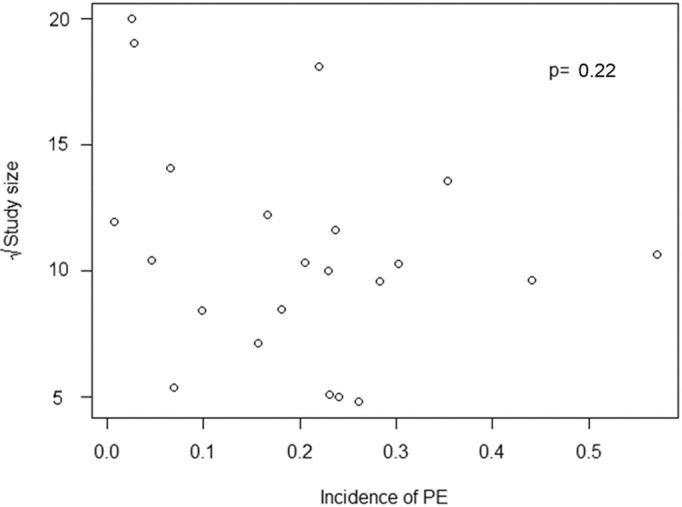
Background The association of pulmonary embolism (PE) with deep vein thrombosis (DVT) in patients with coronavirus disease 2019 (COVID-19) remains unclear, and the diagnostic accuracy of D-dimer tests for PE is unknown. Purpose To conduct meta-analysis of the study-level incidence of PE and DVT and to evaluate the diagnostic accuracy of D-dimer tests for PE from multicenter individual patient data. Materials and Methods A systematic literature search identified studies evaluating the incidence of PE or DVT in patients with COVID-19 from January 1, 2020, to June 15, 2020. These outcomes were pooled using a random-effects model and were further evaluated using metaregression analysis. The diagnostic accuracy of D-dimer tests for PE was estimated on the basis of individual patient data using the summary receiver operating characteristic curve. Results Twenty-seven studies with 3342 patients with COVID-19 were included in the analysis. The pooled incidence rates of PE and DVT were 16.5% (95% CI: 11.6, 22.9; I2 = 0.93) and 14.8% (95% CI: 8.5, 24.5; I2 = 0.94), respectively. PE was more frequently found in patients who were admitted to the intensive care unit (ICU) (24.7% [95% CI: 18.6, 32.1] vs 10.5% [95% CI: 5.1, 20.2] in those not admitted to the ICU) and in studies with universal screening using CT pulmonary angiography. DVT was present in 42.4% of patients with PE. D-dimer tests had an area under the receiver operating characteristic curve of 0.737 for PE, and D-dimer levels of 500 and 1000 μg/L showed high sensitivity (96% and 91%, respectively) but low specificity (10% and 24%, respectively). Conclusion Pulmonary embolism (PE) and deep vein thrombosis (DVT) occurred in 16.5% and 14.8% of patients with coronavirus disease 2019 (COVID-19), respectively, and more than half of patients with PE lacked DVT. The cutoffs of D-dimer levels used to exclude PE in preexisting guidelines seem applicable to patients with COVID-19. © RSNA, 2020 Supplemental material is available for this article. See also the editorial by Woodard in this issue.


Figures

None
Graphical abstract
Flowchart of the literature review process. COVID-19 = coronavirus disease 2019, PCR = polymerase chain reaction.
Figure 1:
Flowchart of the literature review process. COVID-19 = coronavirus disease 2019, PCR = polymerase chain reaction.
Forest plots show pooled incidence rates of (a) pulmonary embolism (PE) (n = 22) and (b) deep vein thrombosis (DVT) (n = 18) in patients with coronavirus disease 2019. The estimated overall incidence rates of PE and DVT were 16.5% (95% CI: 11.6, 22.9) and 14.8% (95% CI: 8.5, 24.5), respectively. Significant interstudy heterogeneity was seen in all groups. CTPA = CT pulmonary angiography, ICU = intensive care unit, RE = random effects. Forest plots show pooled incidence rates of (c, d) both pulmonary embolism (PE) and deep vein thrombosis (DVT) (n = 13) in patients with coronavirus disease 2019. In the 13 studies that reported both PE and DVT, the incidence rates were 10.3% (95% CI: 5.7, 17.8) and 12.0% (95% CI: 5.9, 22.7), respectively. Significant interstudy heterogeneity was seen in all groups. CTPA = CT pulmonary angiography, ICU = intensive care unit, RE = random effects.
Figure 2a:
Forest plots show pooled incidence rates of (a) pulmonary embolism (PE) (n = 22) and (b) deep vein thrombosis (DVT) (n = 18) in patients with coronavirus disease 2019. The estimated overall incidence rates of PE and DVT were 16.5% (95% CI: 11.6, 22.9) and 14.8% (95% CI: 8.5, 24.5), respectively. Significant interstudy heterogeneity was seen in all groups. CTPA = CT pulmonary angiography, ICU = intensive care unit, RE = random effects. Forest plots show pooled incidence rates of (c, d) both pulmonary embolism (PE) and deep vein thrombosis (DVT) (n = 13) in patients with coronavirus disease 2019. In the 13 studies that reported both PE and DVT, the incidence rates were 10.3% (95% CI: 5.7, 17.8) and 12.0% (95% CI: 5.9, 22.7), respectively. Significant interstudy heterogeneity was seen in all groups. CTPA = CT pulmonary angiography, ICU = intensive care unit, RE = random effects.
Figure 2b:
Forest plots show pooled incidence rates of (a) pulmonary embolism (PE) (n = 22) and (b) deep vein thrombosis (DVT) (n = 18) in patients with coronavirus disease 2019. The estimated overall incidence rates of PE and DVT were 16.5% (95% CI: 11.6, 22.9) and 14.8% (95% CI: 8.5, 24.5), respectively. Significant interstudy heterogeneity was seen in all groups. CTPA = CT pulmonary angiography, ICU = intensive care unit, RE = random effects. Forest plots show pooled incidence rates of (c, d) both pulmonary embolism (PE) and deep vein thrombosis (DVT) (n = 13) in patients with coronavirus disease 2019. In the 13 studies that reported both PE and DVT, the incidence rates were 10.3% (95% CI: 5.7, 17.8) and 12.0% (95% CI: 5.9, 22.7), respectively. Significant interstudy heterogeneity was seen in all groups. CTPA = CT pulmonary angiography, ICU = intensive care unit, RE = random effects.
Figure 2c:
Forest plots show pooled incidence rates of (a) pulmonary embolism (PE) (n = 22) and (b) deep vein thrombosis (DVT) (n = 18) in patients with coronavirus disease 2019. The estimated overall incidence rates of PE and DVT were 16.5% (95% CI: 11.6, 22.9) and 14.8% (95% CI: 8.5, 24.5), respectively. Significant interstudy heterogeneity was seen in all groups. CTPA = CT pulmonary angiography, ICU = intensive care unit, RE = random effects. Forest plots show pooled incidence rates of (c, d) both pulmonary embolism (PE) and deep vein thrombosis (DVT) (n = 13) in patients with coronavirus disease 2019. In the 13 studies that reported both PE and DVT, the incidence rates were 10.3% (95% CI: 5.7, 17.8) and 12.0% (95% CI: 5.9, 22.7), respectively. Significant interstudy heterogeneity was seen in all groups. CTPA = CT pulmonary angiography, ICU = intensive care unit, RE = random effects.
Figure 2d:
Forest plots show pooled incidence rates of (a) pulmonary embolism (PE) (n = 22) and (b) deep vein thrombosis (DVT) (n = 18) in patients with coronavirus disease 2019. The estimated overall incidence rates of PE and DVT were 16.5% (95% CI: 11.6, 22.9) and 14.8% (95% CI: 8.5, 24.5), respectively. Significant interstudy heterogeneity was seen in all groups. CTPA = CT pulmonary angiography, ICU = intensive care unit, RE = random effects. Forest plots show pooled incidence rates of (c, d) both pulmonary embolism (PE) and deep vein thrombosis (DVT) (n = 13) in patients with coronavirus disease 2019. In the 13 studies that reported both PE and DVT, the incidence rates were 10.3% (95% CI: 5.7, 17.8) and 12.0% (95% CI: 5.9, 22.7), respectively. Significant interstudy heterogeneity was seen in all groups. CTPA = CT pulmonary angiography, ICU = intensive care unit, RE = random effects.
Summary receiver operating characteristic curve shows the diagnostic performance of D-dimer tests for pulmonary embolism in patients with coronavirus disease 2019. Dots of different colors indicate separate data of 11 studies.
Figure 3:
Summary receiver operating characteristic curve shows the diagnostic performance of D-dimer tests for pulmonary embolism in patients with coronavirus disease 2019. Dots of different colors indicate separate data of 11 studies.
Funnel plots used to detect publication bias. Each circle represents a study included in the analysis. Probability values of asymmetry from the Egger test are shown. (a) Incidence of pulmonary embolism (PE). (b) Incidence of deep vein thrombosis (DVT).
Figure 4a:
Funnel plots used to detect publication bias. Each circle represents a study included in the analysis. Probability values of asymmetry from the Egger test are shown. (a) Incidence of pulmonary embolism (PE). (b) Incidence of deep vein thrombosis (DVT).
Figure 4b:
Funnel plots used to detect publication bias. Each circle represents a study included in the analysis. Probability values of asymmetry from the Egger test are shown. (a) Incidence of pulmonary embolism (PE). (b) Incidence of deep vein thrombosis (DVT).

Comment in

References

    1. World Health Organization . Coronavirus disease (COVID-19): situation report, 162. Geneva, Switzerland: World Health Organization, 2020.
    1. Yang X, Yu Y, Xu J, et al. Clinical course and outcomes of critically ill patients with SARS-CoV-2 pneumonia in Wuhan, China: a single-centered, retrospective, observational study. Lancet Respir Med 2020;8(5):475–481 [Published correction appears in Lancet Respir Med 2020;8(4):e26.]. - PMC - PubMed
    1. The Lancet Haematology . COVID-19 coagulopathy: an evolving story. Lancet Haematol 2020;7(6):e425. - PMC - PubMed
    1. Klok FA, Kruip MJHA, van der Meer NJM, et al. Incidence of thrombotic complications in critically ill ICU patients with COVID-19. Thromb Res 2020;191:145–147. - PMC - PubMed
    1. van Dam LF, Kroft LJM, van der Wal LI, et al. Clinical and computed tomography characteristics of COVID-19 associated acute pulmonary embolism: a different phenotype of thrombotic disease? Thromb Res 2020;193:86–89. - PMC - PubMed

MeSH terms

Substances