. 2021 Jun 1;23(6):999-1011.
doi: 10.1093/neuonc/noaa278.

Cell-surface antigen profiling of pediatric brain tumors: B7-H3 is consistently expressed and can be targeted via local or systemic CAR T-cell delivery

Affiliations

Cell-surface antigen profiling of pediatric brain tumors: B7-H3 is consistently expressed and can be targeted via local or systemic CAR T-cell delivery

Dalia Haydar et al. Neuro Oncol. .

Abstract

Background: Immunotherapy with chimeric antigen receptor (CAR) T cells is actively being explored for pediatric brain tumors in preclinical models and early phase clinical studies. At present, it is unclear which CAR target antigens are consistently expressed across different pediatric brain tumor types. In addition, the extent of HLA class I expression is unknown, which is critical for tumor recognition by conventional αβTCR T cells.

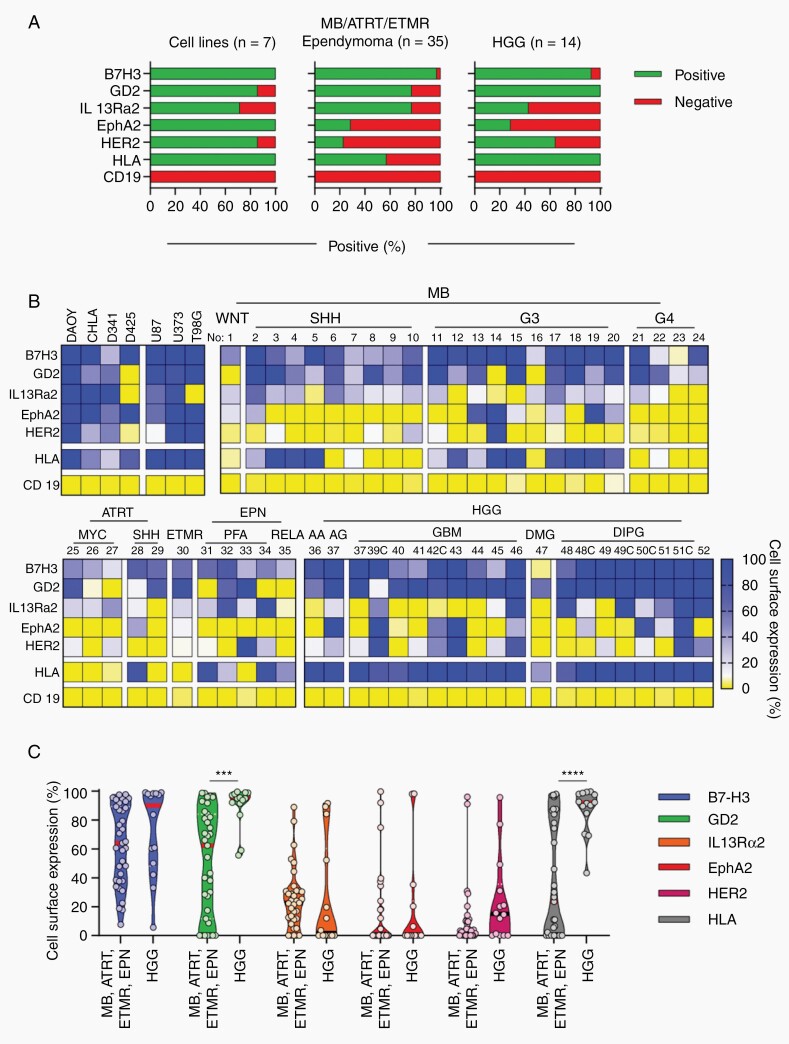
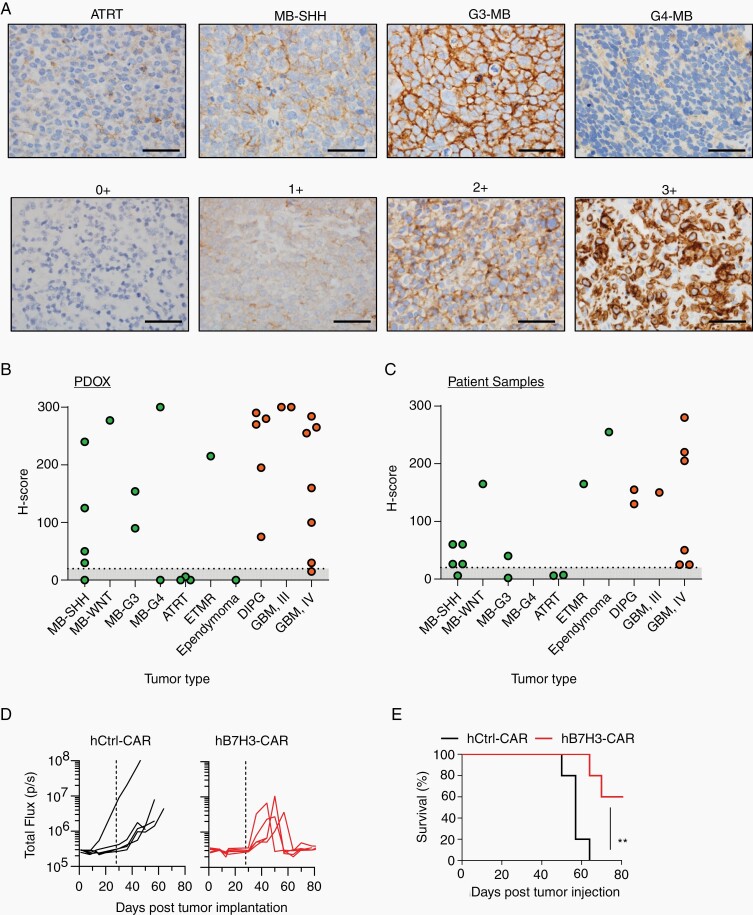
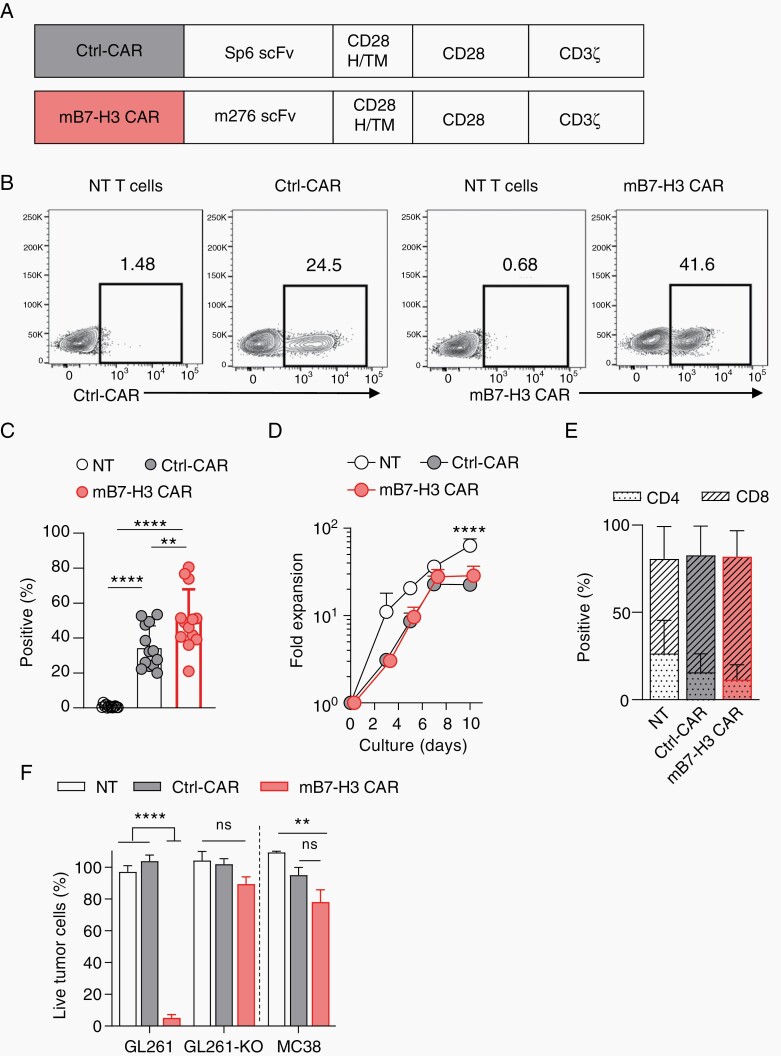
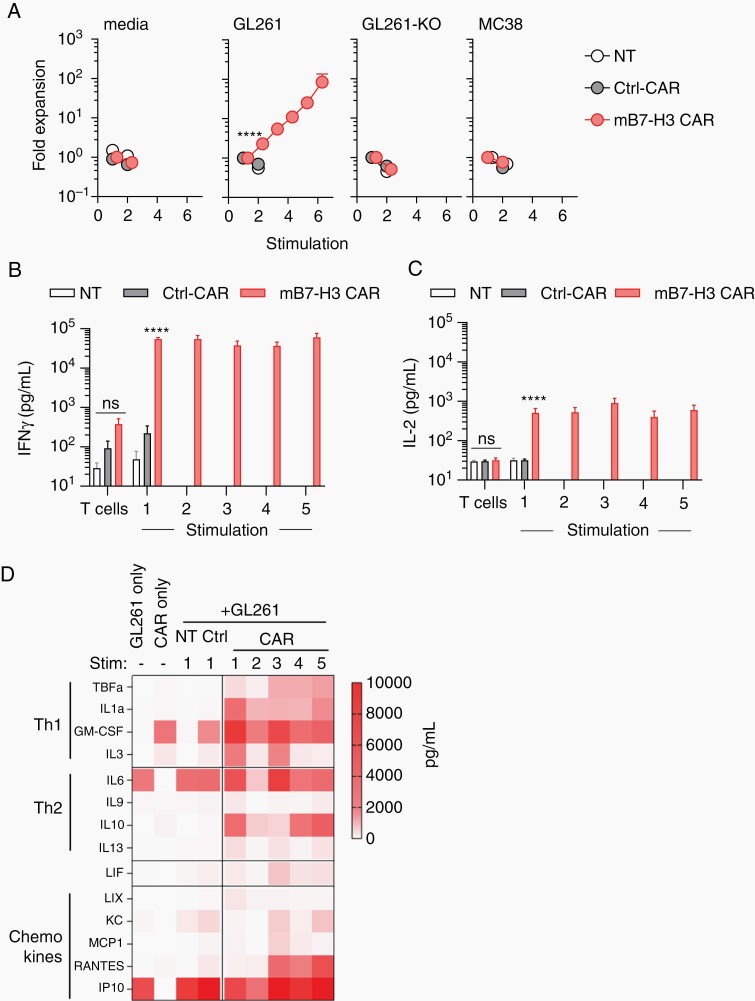
Methods: We profiled 49 low- and high-grade pediatric brain tumor patient-derived orthotopic xenografts (PDOX) by flow analysis for the expression of 5 CAR targets (B7-H3, GD2, IL-13Rα2, EphA2, and HER2), and HLA class I. In addition, we generated B7-H3-CAR T cells and evaluated their antitumor activity in vitro and in vivo.

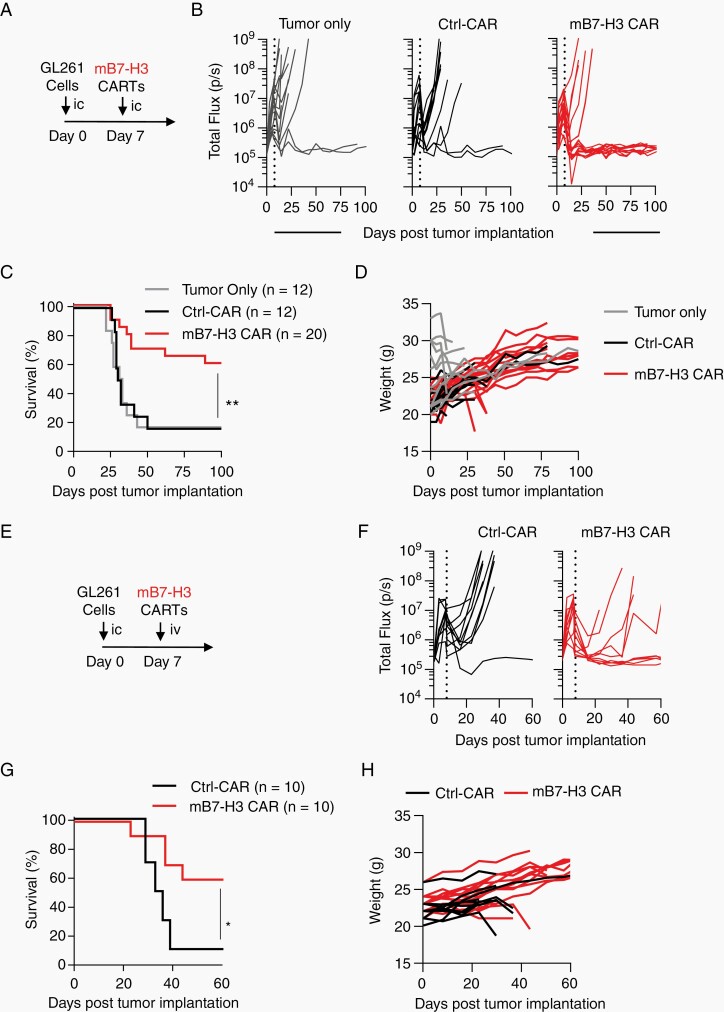
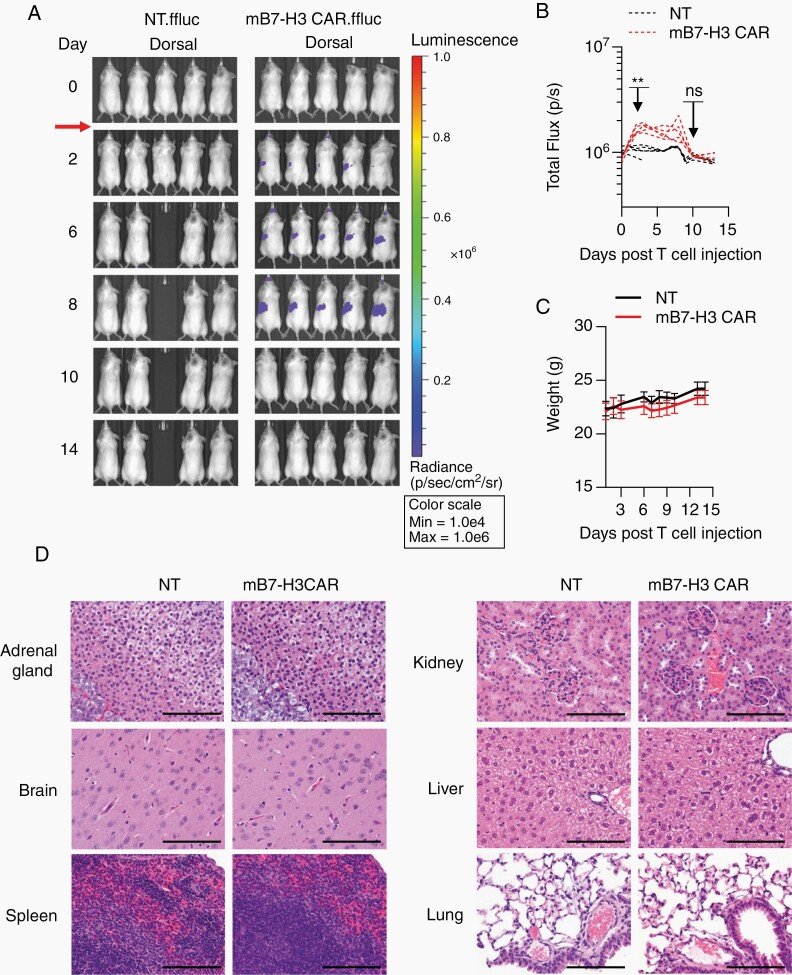
Results: We established an expression hierarchy for the analyzed antigens (B7-H3 = GD2 >> IL-13Rα2 > HER2 = EphA2) and demonstrated that antigen expression is heterogenous. All high-grade gliomas expressed HLA class I, but only 57.1% of other tumor subtypes had detectable expression. We then selected B7-H3 as a target for CAR T-cell therapy. B7-H3-CAR T cells recognized tumor cells in an antigen-dependent fashion. Local or systemic administration of B7-H3-CAR T cells induced tumor regression in PDOX and immunocompetent murine glioma models resulting in a significant survival advantage.

Conclusions: Our study highlights the importance of studying target antigen and HLA class I expression in PDOX samples for the future design of immunotherapies. In addition, our results support active preclinical and clinical exploration of B7-H3-targeted CAR T-cell therapies for a broad spectrum of pediatric brain tumors.

Keywords: B7-H3; CAR T-cell immunotherapy; GD2; HLA; immunocompetent and PDOX models; pediatric brain tumor.


Figures

Fig. 1
Fig. 1
Heterogeneous CAR target and HLA expression in pediatric brain tumors. PDOX samples were stained for B7-H3, EphA2, GD2, HER2, IL-13Rα2, HLA class I, and CD19. CHLA, CHLA-01-MED; MB, medulloblastoma; ATRT, atypical teratoid rhabdoid tumor; EPN, ependymoma; ETMR, embryonal tumor with multilayered rosettes; HGG, high-grade glioma; DIPG, diffuse intrinsic pontine glioma. A, Percentage of positive/negative cell lines and PDOXs. B, Double color gradient heatmap: 0%: yellow, 10%: white, 100%: blue gradient. WNT, MB wingless subgroup; SHH, MB sonic hedgehog subgroup; G3, MB subgroup 3; G4, MB subgroup 4; MYC, MYC ATRT subgroup; III, HGG WHO grade III; IV, HGG WHO grade IV; No, PDOX model number. Details related to each model are provided in Supplementary Tables 1 and 2. C, Violin plots showing percentage of cell surface expression of TAAs in different pediatric brain tumor subtypes and subgroups (2-way ANOVA with Sidak’s test for multiple comparisons; ***P < .001; ****P < .0001).
Fig. 2
Fig. 2
B7-H3 is expressed in pediatric brain tumors. PDOXs were evaluated for B7-H3 expression by IHC. A, Top panel: representative images for different tumor subtypes, including ATRT, MB-SHH, G3-MB, and G4-MB stained for B7-H3. Bottom panel: B7-H3 staining-intensity scale: 0+: no staining, 1+: weak positive, 2+: moderate positive, 3+: strong positive. Scare bar, 50 µm. B and C, H-scores of PDOXs and pediatric brain tumor sections (evaluated by pathologist blinded to tumor type and expression status). D, MB-SHH PDOX tumor cells (Model No. 5, SJMBSHH-13-5634) expressing YFP.ffLuc were implanted into the cortices of NSG mice followed by i.v. injection of 5 × 10⁶ hB7-H3− or hCtrl-CAR T cells on Day 28. Radiance (total flux) is shown. E, Kaplan-Meier survival analysis. Log-rank (Mantel-Cox) test; hCtrl− vs hB7-H3-CAR T cells; P = .0052).
Fig. 3
Fig. 3
Functional characterization of mB7-H3-CAR T cells. A, Scheme of retroviral vectors; H/TM: hinge/transmembrane domain. B, CAR expression evaluated using flow cytometry analysis at Days 3-5 post-transduction. Representative flow plots for NT, Ctrl-CAR, and mB7-H3-CAR expression in transduced murine T cells. C, Summary plot of %F(ab’)2-positive T cells (n = 13, mean ± SEM, 1-way ANOVA with Tukey’s test for multiple comparisons). D, T cells were expanded with IL-2 (50 U/mL) until Day 10 post-transduction. Fold expansion over time (n = 6, mean ± SEM, 2-way ANOVA with Tukey’s test for multiple comparisons). E, Summary plot depicts the proportion of CD4+ and CD8+ cells in NT, Ctrl-CAR, and mB7-H3-CAR T cells on Day 5 post-transduction (n = 10, mean ± SEM, multiple t tests for within-group analysis and 2-way ANOVA with Tukey’s test for multiple comparisons). F, MTS assay with B7-H3-positive (GL261) and B7-H3-negative (MC38, GL261-KO) targets at an effector to target (E:T) ratio of 0.25; n = 5 (GL261, GL261-KO), n = 3 (MC38), mean ± SEM, 2-way ANOVA with Tukey’s test for multiple comparisons).
Fig. 4
Fig. 4
mB7-H3-CAR T cells expand and secrete cytokines in repeat stimulation assay. CAR T cells were co-cultured with tumor cells at a 2:1 ratio without exogenous cytokines followed by enumeration and re-stimulation with fresh tumor cells every 3 days until T cells stopped expanding. A, Average fold expansion of T cells upon successive stimulations (x-axis: each stimulation is a 3-day co-culture with fresh tumor cells, n = 11 for media and GL261, n = 6 for GL261-KO, n = 5 for MC38, mean ± SEM, 2-way ANOVA with Tukey’s test for multiple comparisons). B-C, CAR T-cell production of IFN-γ and IL-2 cytokines 24 hours’ post-stimulation at 2:1 ratio against GL261 tumor cells (n = 11, mean ± SEM, multiple t tests). D, Heatmap of production of Th1 and Th2 cytokines, and chemokines post-repeat stimulations (n = 4, mean).
Fig. 5
Fig. 5
mB7-H3-CAR T cells have potent anti-glioma activity in immunocompetent GL261 model. A-D, 1 × 10⁵ GL261.eGFP.ffLuc cells were injected orthotopically into albino C57BL/6 mice, followed by intra-tumoral injection of media (tumor-only group), 2 × 10⁶ Ctrl-CAR, or 2 × 10⁶ mB7-H3-CAR T cells. A, Experimental scheme. B, Quantitative bioluminescent signal of tumor burden over time. C, Kaplan-Meier survival curve (log-rank Mantel-Cox test; n = 12 for tumor-only and Ctrl-CAR, n = 20 for mB7-H3-CAR, P = .006). D, Changes in mice body weight determined weekly. E-H, 1 × 10⁵ GL261.eGFP.ffLuc cells were injected orthotopically into albino C57BL/6 mice, followed by i.v. injection of 3 × 10⁶ Ctrl-CAR or 3 × 10⁶ CAR T cells. E, Experimental scheme. F, Quantitative bioluminescent signal of tumor burden over time. G, Kaplan-Meier survival curve (log-rank Mantel-Cox test; n = 10 for Ctrl-CAR, n = 15 for CAR, P = .0112). H, Changes in mice body weight determined weekly.
Fig. 6
Fig. 6
Systemic administration of mB7-H3-CAR T cells is safe. High dose (1 × 10⁷) of NT and mB7-H3-CAR T cells expressing GFP.ffluc were injected i.v. into tumor-free albino C57BL/6 mice. A. Representative dorsal bioluminescence images. B. Radiance signal (total flux) over time (n = 5, 2-way ANOVA with Sidak’s test for multiple comparisons; **P < .01; ns, nonsignificant). C. Change in murine body weight after T-cell injection. D. Representative images of H&E-stained sections for each treatment group are shown at 40× magnification, scale bar: 100 µm.

Comment in

References

    1. Ostrom QT, Gittleman H, Liao P, et al. . CBTRUS statistical report: primary brain and other central nervous system tumors diagnosed in the United States in 2010–2014. Neuro Oncol. 2017;19(suppl_5):v1–v88. - PMC - PubMed
    1. June CH, Sadelain M. Chimeric antigen receptor therapy. N Engl J Med. 2018;379(1):64–73. - PMC - PubMed
    1. Ahmed N, Brawley V, Hegde M, et al. . HER2-specific chimeric antigen receptor-modified virus-specific T cells for progressive glioblastoma: a phase 1 dose-escalation trial. JAMA Oncol. 2017;3(8):1094–1101. - PMC - PubMed
    1. Brown CE, Alizadeh D, Starr R, et al. . Regression of glioblastoma after chimeric antigen receptor T-cell therapy. N Engl J Med. 2016;375(26):2561–2569. - PMC - PubMed
    1. O’Rourke DM, Nasrallah MP, Desai A, et al. . A single dose of peripherally infused EGFRvIII-directed CAR T-cells mediates antigen loss and induces adaptive resistance in patients with recurrent glioblastoma. Sci Transl Med. 2017;9(399):eaaa0984. - PMC - PubMed

Publication types