. 2020 Dec 15;22(Suppl 1):S35-S44.
doi: 10.1093/ntr/ntaa174.

Electronic Cigarette Liquid Constituents Induce Nasal and Tracheal Sensory Irritation in Mice in Regionally Dependent Fashion

Affiliations

Electronic Cigarette Liquid Constituents Induce Nasal and Tracheal Sensory Irritation in Mice in Regionally Dependent Fashion

Fenge Ni et al. Nicotine Tob Res. .

Abstract

Introduction: Electronic cigarettes (e-cigs) are currently used by millions of adults and adolescents worldwide. Major respiratory symptoms, such as coughing reported by e-cig users, including patients with e-cig, or vaping, product use-associated lung injury (EVALI), indicate e-cig constituent-induced sensory irritation. However, e-cig constituent-induced nociceptive activity in nasal and tracheal respiratory epithelia (RE) and neuronal activation in the trigeminal ganglia and brainstem nuclei, which receive airway chemosensory inputs have not been examined and compared. Comparisons of physiological responses between freebase nicotine and nicotine salts are also missing.

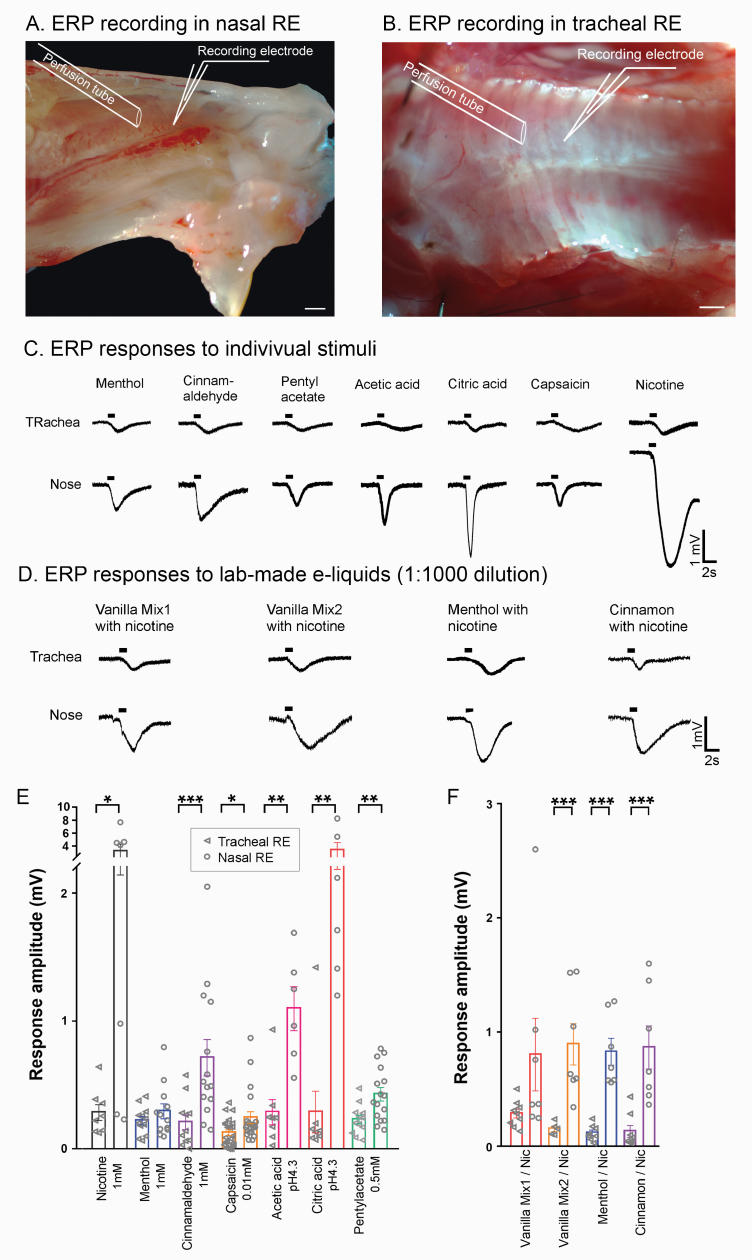
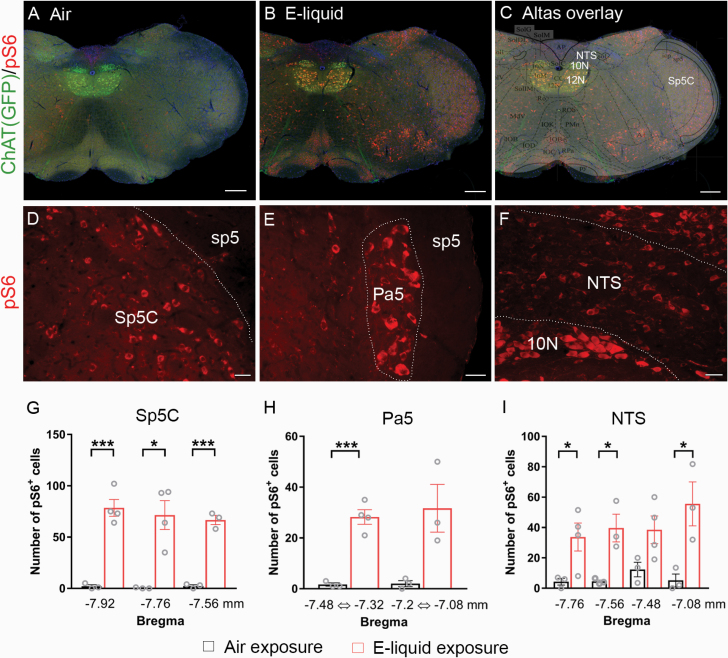
Aims and methods: Event-related potential (ERP) was recorded electrophysiologically to assess mouse nasal and tracheal RE chemosensory responses to various flavorings, nicotine, including freebase and nicotine salts, e-liquid mixtures, and tussigenic stimuli. Also, mice were subjected to inhalation exposure to aerosol of a vanilla-flavored e-liquid or air (control), and the activated-trigeminal nociceptive neurons and brainstem neurons were examined using immunohistochemistry.

Results: Individual constituents and mixtures of e-liquids, capsaicin, and citric and acetic acids evoked significantly larger ERP in the nose than in the trachea with the exception of menthol. ERP responses to freebase nicotine were significantly larger than protonated nicotine. Four nicotine salts (benzoate, lactate, levulinate, and salicylate) induced similar responses. Compared with air-exposed mice, e-liquid aerosol-exposed mice showed a significant increase in numbers of activated trigeminal nociceptive neurons and brainstem neurons in the spinal trigeminal nucleus, paratrigeminal nucleus, and nucleus tractus solitarius.

Conclusions: E-liquid constituents region-dependently stimulate airway nociceptive chemosensory systems, and freebase nicotine is more potent than protonated nicotine.

Implications: Neural abnormalities have been implicated in the development of nasal and respiratory illnesses. The higher sensitivity of the nasal nociceptive chemosensory system to nicotine and flavorings may indicate a health risk for e-liquid aerosol-induced upper airway illnesses via neurogenic alteration and warrants further investigation.


Figures

Figure. 1.
Figure. 1.
Responses to nicotine, flavorings, e-liquids, and noxious stimuli in tracheal and nasal respiratory epithelia (RE). (A,B) Microphotographs of the anterior hemi-nose and trachea and schematic positions of ERP recordings. Scale: 0.5 mm. (C,D) Representative ERP records measured from tracheal and nasal RE. (E) Average peak amplitudes of ERP responses to individual stimuli. The nasal ERP responses to nicotine, cinnamaldehyde, capsaicin, acetic acid, citric acid, and pentylacetate are significantly larger than tracheal responses (*p < .05, **p < .001, ***p < .001, t- or U-test, n = 6–22 mice/data point). (F) Average peak ERP response amplitudes evoked by four lab-made e-liquid mixtures. Nasal responses to three of the four e-liquid mixtures are larger than tracheal responses (*** p < .001, t- or U-test, n = 5–9). Triangles and circles in (E,F) indicate individual mouse responses from tracheal and nasal REs, respectively. Bar graphs: mean ± SEM.
Figure 2.
Figure 2.
Nasal ERP responses to protonated versus freebase nicotine at different pH and to nicotine salts. (A,B) Representative response traces and average response amplitudes to nicotine (0.5 mM) at different pH values from the same animals. Estimated percentages of freebase nicotine at the tested pH were indicated at x-axis. ERP response amplitude increases at higher pH values due to the increased freebase form of nicotine (*p < .05, *** p < .001, Friedman’s test for repeat measurement followed by Dunn’s multiple comparison tests. n = 8 animals). (C) Representative ERP traces to nicotine and nicotine salts. (D) Responses to different concentrations (50, 100, and 500 µM) of nicotine, nicotine benzoate, Na benzoate, and benzoic acid at pH 7.2 from the same animals. Note the strong concentration-dependent responses to nicotine alone and nicotine benzoate, which are significantly larger than those to Na benzoate and benzoic acid at 100 and 500 µM (*p < .05, **p < .01, Friedman’s test followed by Dunn’s multiple comparison, n=6 animals). Responses to nicotine alone and nicotine benzoate were not significantly different at the three concentrations tested (p = .502 – 0.823, Friedman’s test followed by Dunn’s multiple comparison, n = 6 animals). (E) Responses to four common nicotine salts (500 µM each, pH 7.2) made of benzoic, lactic, levulinic, and salicylic acids, respectively. Their response amplitudes are not significantly different (p = .528, one-way ANOVA, n = 6–14). Bar graphs: mean ± SEM.
Figure 3.
Figure 3.
Nociceptive trigeminal neuron activation induced by e-liquid aerosol exposure. (A,B) Schematic aerosol exposure setup and timeline. (C–E) and (F–H) Immunolabeling of pS6 (C,F, green), substance P (D,G, red), and overlay (E,H) from e-liquid aerosol-exposed and control mice, respectively. DAPI stained nuclei (blue). Arrows point to activated cells. Arrowheads point to nonactivated cells. Scale: 50 µm. (I) Percentage plot. Substance P-positive only and both pS6- and substance P-positive neurons were counted from 2 to 3 TG sections and summed per mouse. E-liquid aerosol exposure significantly increases the percentage of substance P-positive cells that express the activation marker pS6 compared with that of air-exposed group (***p = .0001, t-test, n = 4).
Figure 4.
Figure 4.
E-liquid aerosol activates brainstem nuclei receiving afferent input from the airway. (A,B) Images of pS6 immunolabeling (red) and ChAT (GFP; green) in brainstem sections from air- and aerosol-exposed mice, respectively. (C) Overlay of the image (B) and a schematic draw of brainstem from the mouse brain atlas (Bregma-7.56 mm). Note the expression of ChAT (eGFP) in motor neurons of vagal (10 N) and hypoglossal nuclei (12 N). (D–F) Higher magnification representative images showing pS6-immunoreactive neurons in Sp5C, Pa5 and NTS, respectively. Scale: A–C, 200 µm; D–F, 30 µm. (G–I) pS6-immunopositive cell counts in Sp5C, Pa5, and NTS at different brainstem regions from caudal to rostral (Bregma −7.92 mm to −7.08 mm). Aerosol exposed group showed a significantly higher numbers of pS6-immunolabeled neurons than the control group (***p < .001, *p < .05, t-test, n = 3–4 animals), indicating that these nuclei received nociceptive afferent inputs from the airway during e-liquid aerosol exposure.

Similar articles

Cited by

References

    1. Omaiye EE, McWhirter KJ, Luo W, Pankow JF, Talbot P. High-nicotine electronic cigarette products: toxicity of JUUL fluids and aerosols correlates strongly with nicotine and some flavor chemical concentrations. Chem Res Toxicol. 2019;32(6):1058–1069. - PMC - PubMed
    1. Tierney PA, Karpinski CD, Brown JE, Luo W, Pankow JF. Flavour chemicals in electronic cigarette fluids. Tob Control. 2016;25(e1):e10–e15. - PMC - PubMed
    1. Gerloff J, Sundar IK, Freter R, et al. . Inflammatory response and barrier dysfunction by different e-cigarette flavoring chemicals identified by gas chromatography-mass spectrometry in e-liquids and e-vapors on human lung epithelial cells and fibroblasts. Appl In Vitro Toxicol. 2017;3(1):28–40. - PMC - PubMed
    1. Logue JM, Sleiman M, Montesinos VN, et al. . Emissions from electronic cigarettes: assessing Vapers’ intake of toxic compounds, secondhand exposures, and the associated health impacts. Environ Sci Technol. 2017;51(16):9271–9279. - PubMed
    1. Chun LF, Moazed F, Calfee CS, Matthay MA, Gotts JE. Pulmonary toxicity of e-cigarettes. Am J Physiol Lung Cell Mol Physiol. 2017;313(2):L193–L206. - PMC - PubMed

Publication types