Review
. 2021 Mar;50(2):239-252.
doi: 10.1007/s00249-020-01479-0. Epub 2020 Dec 15.

In vitro single vesicle fusion assays based on pore-spanning membranes: merits and drawbacks

Affiliations
Review

In vitro single vesicle fusion assays based on pore-spanning membranes: merits and drawbacks

Peter Mühlenbrock et al. Eur Biophys J. 2021 Mar.

Abstract

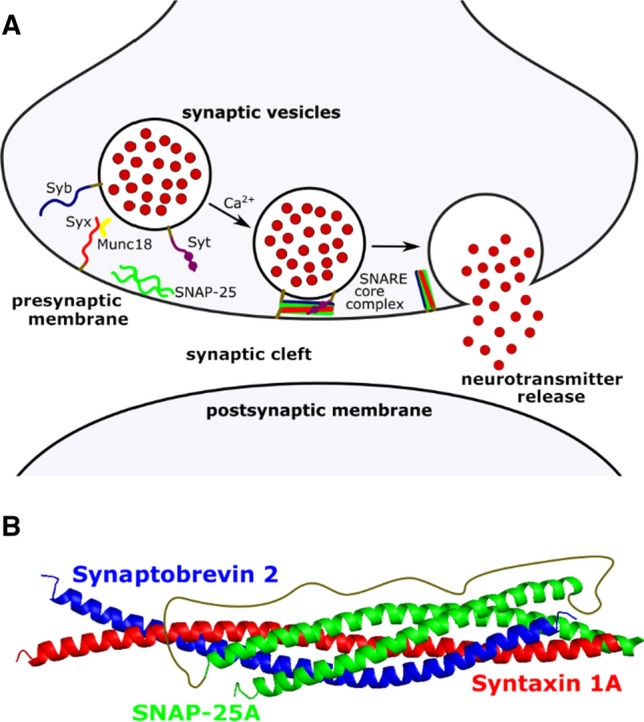
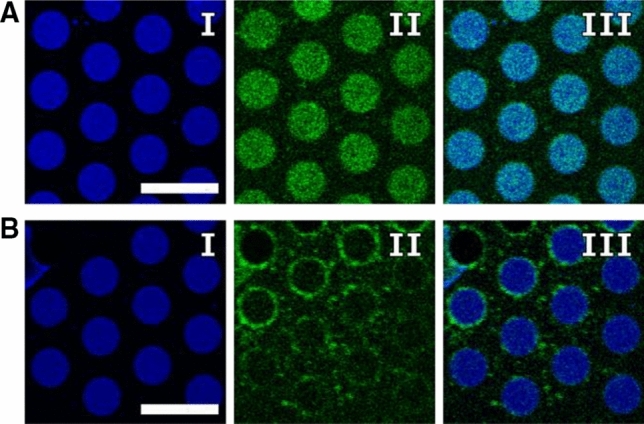
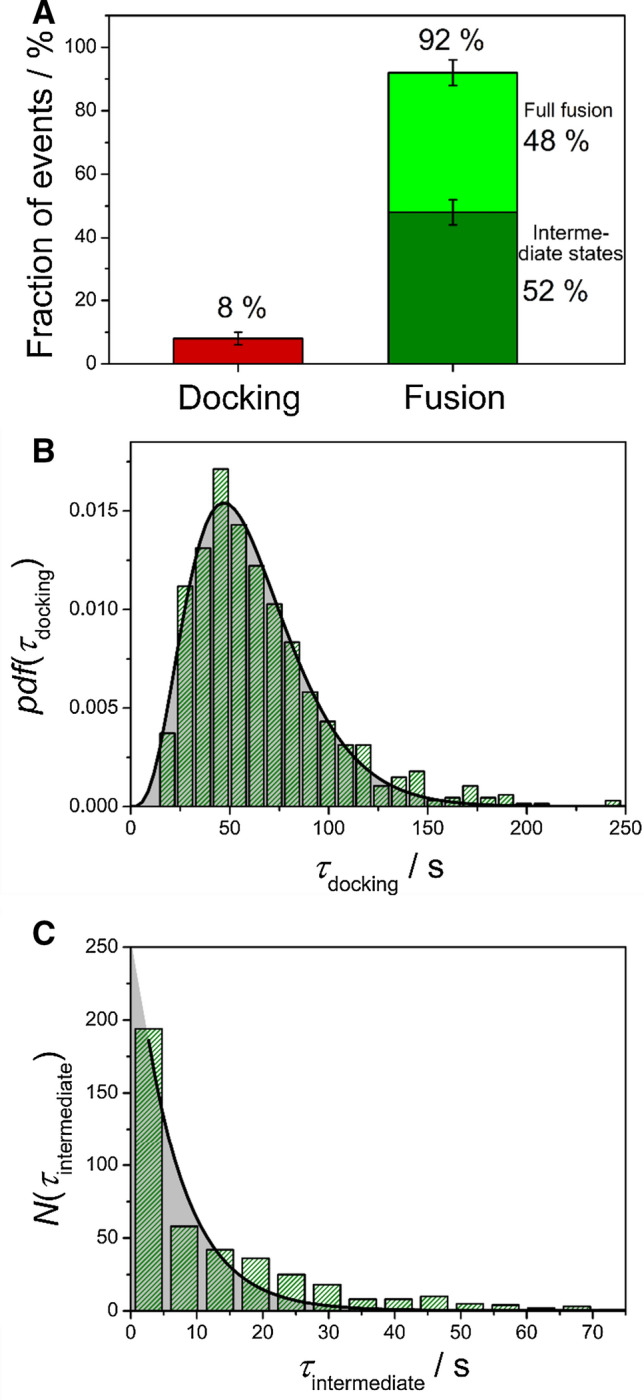
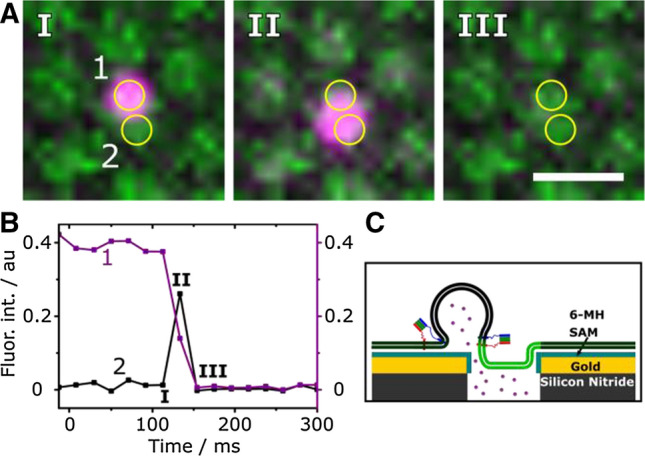
Neuronal fusion mediated by soluble N-ethylmaleimide-sensitive-factor attachment protein receptors (SNAREs) is a fundamental cellular process by which two initially distinct membranes merge resulting in one interconnected structure to release neurotransmitters into the presynaptic cleft. To get access to the different stages of the fusion process, several in vitro assays have been developed. In this review, we provide a short overview of the current in vitro single vesicle fusion assays. Among those assays, we developed a single vesicle assay based on pore-spanning membranes (PSMs) on micrometre-sized pores in silicon, which might overcome some of the drawbacks associated with the other membrane architectures used for investigating fusion processes. Prepared by spreading of giant unilamellar vesicles with reconstituted t-SNAREs, PSMs provide an alternative tool to supported lipid bilayers to measure single vesicle fusion events by means of fluorescence microscopy. Here, we discuss the diffusive behaviour of the reconstituted membrane components as well as that of the fusing synthetic vesicles with reconstituted synaptobrevin 2 (v-SNARE). We compare our results with those obtained if the synthetic vesicles are replaced by natural chromaffin granules under otherwise identical conditions. The fusion efficiency as well as the different fusion states observable in this assay by means of both lipid mixing and content release are illuminated.

Keywords: Content mixing; Fluorescence microscopy; Lipid mixing; Model membranes; SNAREs.


Conflict of interest statement

The authors declare no conflict of interest.

Figures

Fig. 1
Fig. 1
a Ca2+-triggered synaptic membrane fusion. To transmit the incoming electric signal to the next neuron, neurotransmitters have to be released into the synaptic cleft. Therefore, target-SNAREs (syntaxin 1A (Syx) and SNAP-25) and the vesicle-SNARE (synaptobrevin 2 (Syb)) form the SNARE core complex enabling the fusion of the synaptic vesicle containing the neurotransmitter with the presynaptic membrane. Other proteins that control the fusion processes are also involved such as synaptotagmin 1 (Syt) and Munc18. b SNARE core complex. The mainly hydrophobic interaction between the helices of the three SNAREs leads to a coiled coil structured complex with a main site of interaction termed the zero ionic layer (PDB:3HD7)
Fig. 2
Fig. 2
a Schematic drawing of the preparation procedure of a PSM on a gold/6-mercaptohexanol-functionalised porous silicon substrate. b Scanning electron micrograph of a porous silicon substrate with pore diameters of 1.2 μm. Scale bar: 1 μm. c Fluorescence micrograph of a PSM patch composed of DOPC/POPE/POPS/cholesterol (5:2:1:2) and doped with OregonGreen-DHPE. Scale bar: 20 μm. Adapted from (Schwenen et al. 2015)
Fig. 3
Fig. 3
a Schematic drawing of the fusion setup (not drawn to scale). b Three-dimensional representation of the PSM with reconstituted t-SNAREs to which lipid-labelled vesicles containing the v-SNAREs are docked (left). The fluorescence micrograph (right) shows a PSM composed of DOPC/POPE/POPS/cholesterol (5:2:1:2) labelled with Atto488-DPPE and doped with the ΔN49 complex to which vesicles with the same lipid composition but doped with TexasRed-DHPE and synaptobrevin 2 were docked, either to the f-PSM or the s-PSM. Scale bar: 5 µm. Adapted from (Kuhlmann et al. 2017)
Fig. 4
Fig. 4
Fluorescence micrographs of Atto390-DPPE labelled PSMs (a–b, I) and reconstituted ΔN49-Atto488 complex (ab, II) including the overlays of both channels (III). a Homogeneous fluorescence intensity of the protein is visible in the f-PSM. Scale bar: 10 μm. b The majority of protein fluorescence intensity is observed at the pore edges with some fluorescence spots in the s-PSM. Scale bar: 10 μm
Fig. 5
Fig. 5
a Time lapse fluorescence images of a single vesicle fusion event of a large unilamellar vesicle doped with full length synaptobrevin 2 (lower panel, 2) with a PSM containing the ∆N49 complex (upper panel, 1). The region of interest (ROI) used to read out fluorescence intensities is highlighted with a yellow circle while the white circle serves as a guide to the eye to identify the region in which the vesicle docks and fuses; scale bar: 5 µm. b Schematic cross section of the possible fusion pathway of the vesicle fusing with the s-PSM and (c) corresponding fluorescence intensity time trace of the PSM (1, green) and vesicular membrane (2, red). Dashed black lines highlight the baselines while dashed blue lines highlight the different levels of vesicle fluorescence intensity. Upon docking to the PSM the red fluorescence of the vesicle is detected in the ROI (I/II, red). Upon lipid mixing of the outer leaflets the red fluorescence (III, red) is increased due to a FRET between OregonGreen-DHPE and TexasRed-DHPE followed by a fast diffusion into the PSM (IV, red). Simultaneously, lipid molecules of the PSM diffuse into the 3D structure of the vesicle and are de-quenched (IV, green). Full fusion of the vesicle with the membrane results in a second decrease of vesicle fluorescence intensity to baseline level (V/VI, red). Concomitantly, the 3D structure of the vesicle collapses into the target membrane (V/VI, green). The time between docking of the vesicle and fusion of the presumably outer leaflets is defined as τdocking. The time span between outer and inner leaflet mixing is defined as τintermediate. Adapted from (Schwenen et al. 2015)
Fig. 6
Fig. 6
Statistical analysis of the fusion process of LUVs composed of DOPC/POPE/POPS/cholesterol/TexasRed-DHPE (50:19:10:20:1) and doped with synaptobrevin 2 (p/l 1:500) with PSMs composed of DOPC/POPE/POPS/PIP2/cholesterol/Atto488-DPPE (48:19:10:2:20:1) and doped with the ΔN49 complex (p/l 1:500). a Fusion efficiency. b Probability density function (pdf) of lifetimes of the docking state τdocking with the result of fitting Eq. 1 to the data (black line) with k1 = 0.074 ± 0.003 s−1 and N = 4.5 ± 0.2 resulting in an average docking lifetime of τdocking = 61 ± 5 s. c Histogram of the lifetimes of the intermediate states τintermediate. Fitting Eq. 2 to the data (black line) results in a rate constant of k2 = 0.15 ± 0.02 s−1. Taken from (Hubrich et al. 2019)
Fig. 7
Fig. 7
a Time lapse fluorescence micrographs of a fusing vesicle (magenta) that transfers its content across the PSM. Yellow circles highlight the ROI of the vesicle (1) and the neighbouring aqueous compartment underneath the f-PSM (2); scale bar: 2 μm. b Fluorescence intensity time traces obtained from ROI 1 + 2. The docked vesicle (I) fuses and transfers its content (II) across the PSM and into the second aqueous compartment, thus leading to an increase in fluorescence intensity visible in ROI 2. c Schematic illustration of the process shown in A and B. Adapted from (Mühlenbrock et al. 2020)
Fig. 8
Fig. 8
Different fusion pathways extracted from single vesicle fusion events with idealised fluorescence intensity time traces. Taken from (Mühlenbrock et al. 2020)
Fig. 9
Fig. 9
a Fluorescence micrograph of a f-PSM (green) together with the trajectory (white) of a mobile docked vesicle fusing with the f-PSM. b Fluorescence micrographs of the fusion process and respective fluorescence intensity time trace of the fusion event; scale bars: 1 µm. Adapted from (Kuhlmann et al. 2017)
Fig. 10
Fig. 10
Fluorescence micrographs of a CG diffusing on the PSMs crossing pore boundaries (a) before and (b) after the onset of lipid mixing. Diffusion trajectories are depicted as white or orange lines, respectively. Scale bars: 2 µm. Mean square displacements (MSD) of the trajectories of CG diffusion in the pre-lipid mixing state (black line) and post-lipid mixing state (orange). Adapted from (Hubrich et al. 2019)

References

    1. Acuna GP, Möller FM, Holzmeister P, Beater S, Lalkens B, Tinnefeld P. Fluorescence enhancement at docking sites of DNA-directed self-assembled nanoantennas. Science. 2012;338:506–510. doi: 10.1126/science.1228638. - DOI - PubMed
    1. Bacia K, Schuette CG, Kahya N, Jahn R, Schwille P. SNAREs prefer liquid-disordered over "raft" (liquid-ordered) domains when reconstituted into giant unilamellar vesicles. J Biol Chem. 2004;279:37951–37955. doi: 10.1074/jbc.M407020200. - DOI - PubMed
    1. Baumert M, Maycox PR, Navone F, de Camilli P, Jahn R. Synaptobrevin: an integral membrane protein of 18,000 daltons present in small synaptic vesicles of rat brain. EMBO J. 1989;8:379–384. doi: 10.1002/j.1460-2075.1989.tb03388.x. - DOI - PMC - PubMed
    1. Bennett MK, Calakos N, Scheller RH. Syntaxin: A synaptic protein implicated in docking of synaptic vesicles at presynaptic active zones. Science. 1992;257:255–259. doi: 10.1126/science.1321498. - DOI - PubMed
    1. Böcker M, Muschter S, Schmitt EK, Steinem C, Schäffer TE. Imaging and patterning of pore-suspending membranes with scanning ion conductance microscopy. Langmuir. 2009;25:3022–3028. doi: 10.1021/la8034227. - DOI - PubMed

LinkOut - more resources