. 2021 Jan 11;6(1):e140848.
doi: 10.1172/jci.insight.140848.

Vasopressin mediates fructose-induced metabolic syndrome by activating the V1b receptor

Affiliations

Vasopressin mediates fructose-induced metabolic syndrome by activating the V1b receptor

Ana Andres-Hernando et al. JCI Insight. .

Abstract

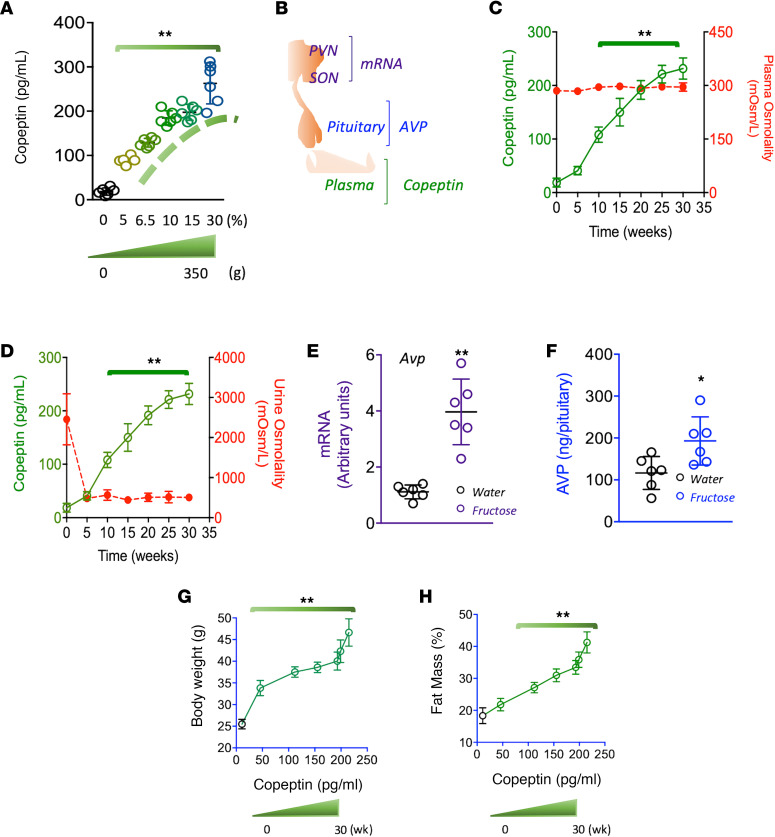
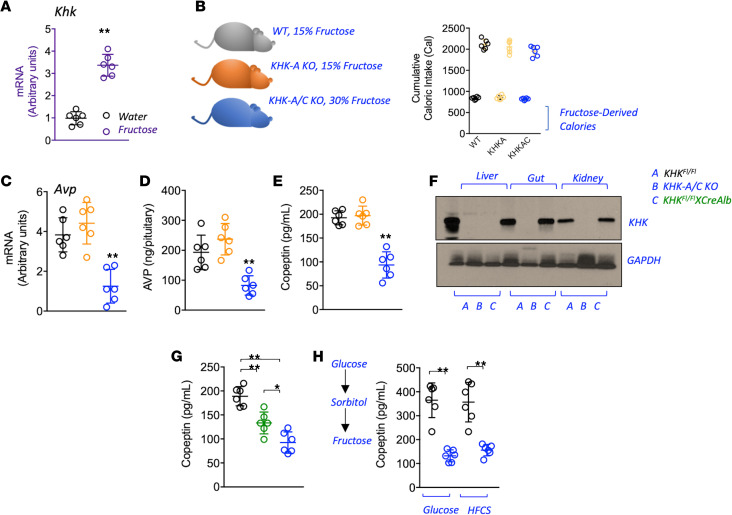
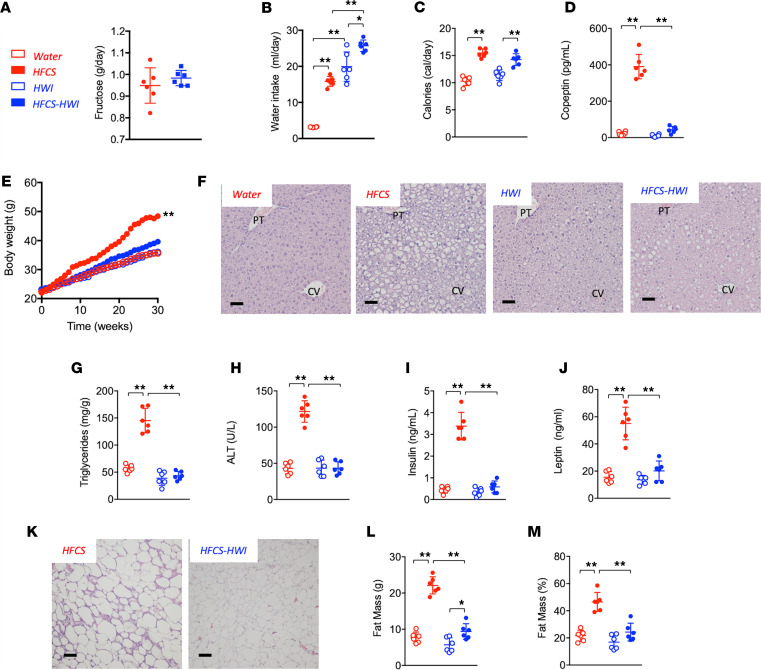
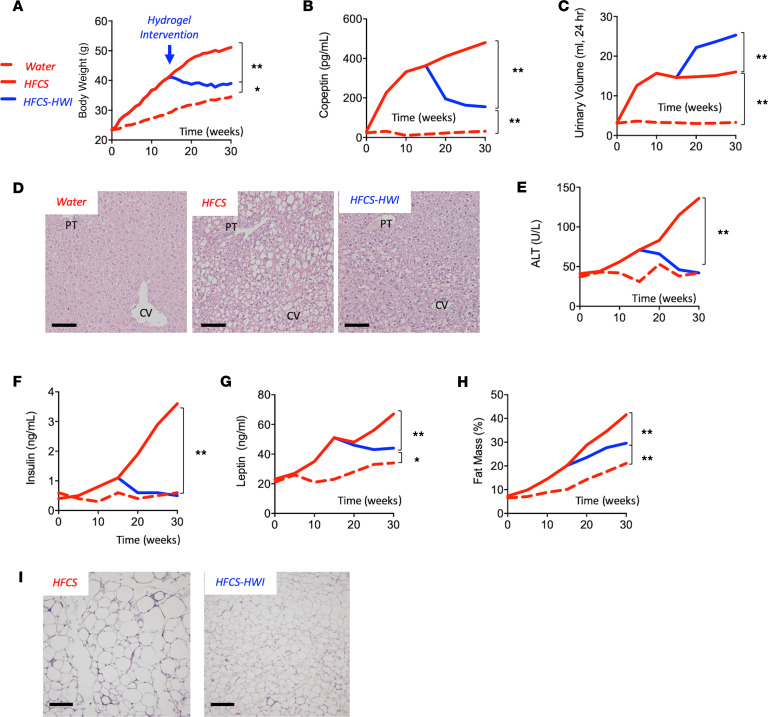
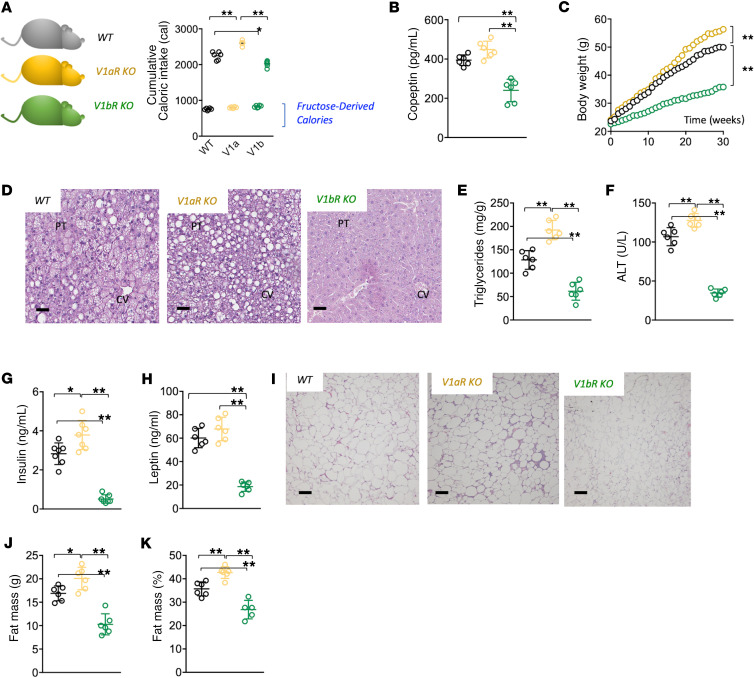
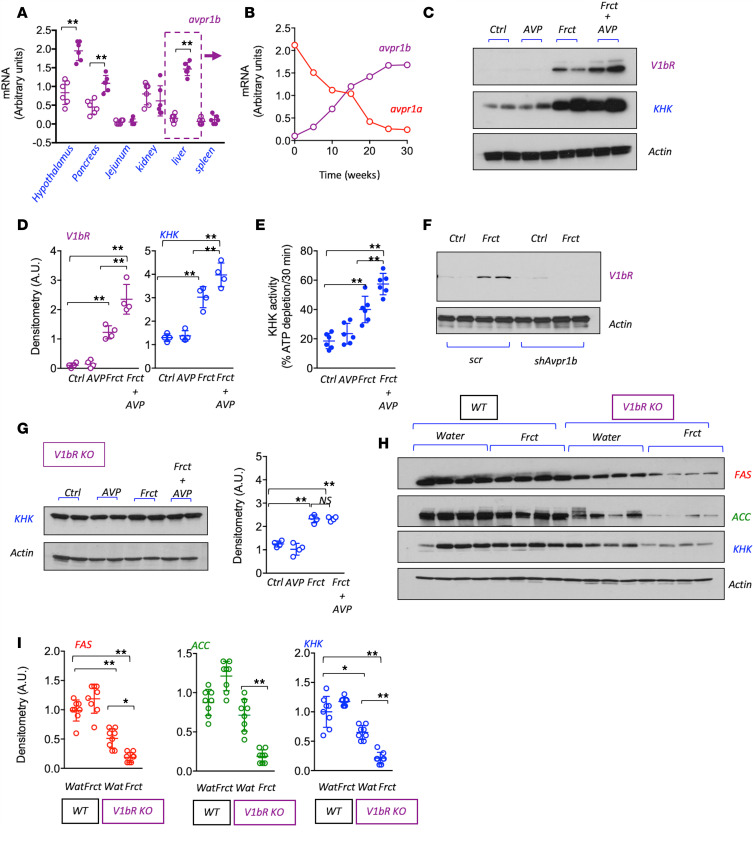
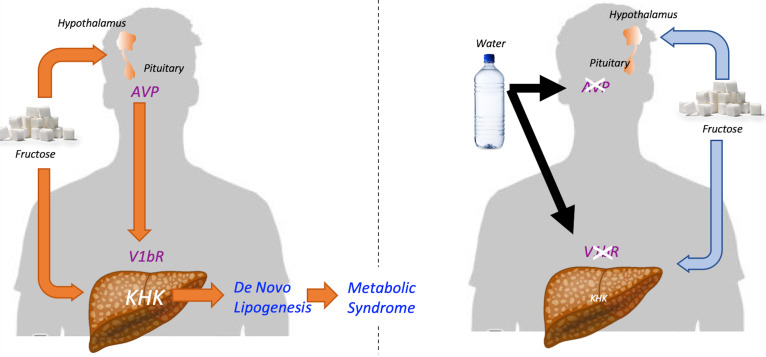
Subjects with obesity frequently have elevated serum vasopressin levels, noted by measuring the stable analog, copeptin. Vasopressin acts primarily to reabsorb water via urinary concentration. However, fat is also a source of metabolic water, raising the possibility that vasopressin might have a role in fat accumulation. Fructose has also been reported to stimulate vasopressin. Here, we tested the hypothesis that fructose-induced metabolic syndrome is mediated by vasopressin. Orally administered fructose, glucose, or high-fructose corn syrup increased vasopressin (copeptin) concentrations and was mediated by fructokinase, an enzyme specific for fructose metabolism. Suppressing vasopressin with hydration both prevented and ameliorated fructose-induced metabolic syndrome. The vasopressin effects were mediated by the vasopressin 1b receptor (V1bR), as V1bR-KO mice were completely protected, whereas V1a-KO mice paradoxically showed worse metabolic syndrome. The mechanism is likely mediated in part by de novo expression of V1bR in the liver that amplifies fructokinase expression in response to fructose. Thus, our studies document a role for vasopressin in water conservation via the accumulation of fat as a source of metabolic water. Clinically, they also suggest that increased water intake may be a beneficial way to both prevent or treat metabolic syndrome.

Keywords: Carbohydrate metabolism; Endocrinology; Metabolism; Obesity.


Conflict of interest statement

Conflict of interest: RJJ and MAL have patents and patent applications (62/473,005, “Indazole inhibitors of fructokinase (KHK) and methods of use in treating KHK-mediated disorders or diseases,” and 62/558,555, “Selective inhibition of V1B and/or stabilization or upregulation of V1A for treating fatty liver”) related to blocking fructose metabolism in the treatment of metabolic diseases and vasopressin. RJJ and MAL are also members of a startup company, Colorado Research Partners LLC, that is trying to develop inhibitors of fructose metabolism. RJJ also has some shares of XORTX Therapeutics, which is a startup company developing novel xanthine oxidase inhibitors. PB has acted as a consultant for Bayer, AstraZeneca, Bristol-Myers Squibb, Boehringer Ingelheim, Sanofi, Novo Nordisk, and Horizon Pharma. PB serves on advisory boards for Boehringer Ingelheim and XORTX Therapeutics.

Figures

Figure 1
Figure 1. Fructose promotes vasopressin production and secretion during the development of metabolic syndrome.
(A) Serum copeptin levels in mice receiving fructose solutions (from 0 to 30%) for 30 weeks. Cumulative fructose intakes varied from 0 to 350 g/mouse. (B) Schematic depicting the areas for vasopressin production (hypothalamic nuclei), accumulation (posterior pituitary), and secretion (serum). (C) Serum copeptin and osmolality levels in mice receiving a 10% fructose solution for 30 weeks. (D) Serum copeptin levels and urinary osmolality in mice receiving a 10% fructose solution for 30 weeks. (E) Hypothalamic mRNA levels of vasopressin in mice receiving water or a 10% fructose solution for 30 weeks. (F) Vasopressin levels in pituitary of mice receiving a 10% fructose solution for 30 weeks. (G) 5-week body weight/copeptin correlations in mice receiving a 10% fructose solution for 30 weeks. (H) Adiposity (% of fat mass) in mice receiving a 10% fructose solution for 30 weeks. The data in A and C–H are presented as the mean ± SD and analyzed by 1-way ANOVA with Tukey’s post hoc analysis. *P < 0.05, **P < 0.01. n = 6 mice per group. PVN, paraventricular nuclei; SON, supraoptic nuclei.
Figure 2
Figure 2. Fructose metabolism via fructokinase is necessary for vasopressin production and secretion.
(A) Hypothalamic mRNA levels of fructokinase (KHK) in mice receiving water or a 10% fructose solution for 30 weeks. (B) Cumulative total and fructose-derived caloric intake in WT (black), KHK-A–KO (orange), and KHK-A/C–KO (blue) mice receiving equal amounts of fructose for 30 weeks. (C) Hypothalamic mRNA levels of vasopressin in WT, KHK-A–KO, and KHK-A/C–KO mice receiving equal amounts of fructose for 30 weeks. (D) Vasopressin levels in pituitary of WT, KHK-A–KO, and KHK-A/C–KO mice receiving equal amounts of fructose for 30 weeks. (E) Serum copeptin levels in WT, KHK-A–KO, and KHK-A/C–KO mice receiving equal amounts of fructose for 30 weeks. (F) Representative Western blot (n = 3 total blots) for KHK and actin in liver, gut, and kidney tissues from WT (black), KHK-A/C–KO (blue), and liver-specific KHK-A/C–KO mice (KHKFl/FlXCreAlb, green). (G) Serum copeptin levels in WT, KHK-A/C–KO, and liver-specific KHK-A/C–KO mice receiving equal amounts of fructose for 30 weeks. (H) Serum copeptin levels in WT and KHK-A/C–KO mice receiving glucose (10%) or HFCS (10%) solutions for 30 weeks. The data in A–E and G and H are presented as the mean ± SD and analyzed by 1-way ANOVA with Tukey’s post hoc analysis. *P < 0.05, **P < 0.01. n = 6 mice per group. See also Supplemental Table 1 and Supplemental Table 2. KHK, ketohexokinase; KHK-A, A isoform of KHK; KHK-A/C, both A and C isoforms of KHK; HFCS, high-fructose corn syrup.
Figure 3
Figure 3. Lowering vasopressin protects against sugar-induced metabolic syndrome.
(A) Average daily fructose intake (g/day) in the drinking water in WT mice receiving HFCS (red) alone or in combination with hydrogels (HFCS-HWI, blue) for 30 weeks. (B) Average daily total water intake (mL/day) in WT mice control (water, red clear bars), receiving HFCS (red solid bars), hydrogels (HWI, blue clear bars), or HFCS in combination with hydrogels (HFCS-HWI, blue solid bars) for 30 weeks. (C) Average daily caloric intake water, HFCS, HWI, and HFCS-HWI groups. (D) Serum copeptin levels at 30 weeks in water, HFCS, HWI, and HFCS-HWI groups. (E) Weekly body weight gain in water, HFCS, HWI, and HFCS-HWI groups. (F) Representative H&E images from livers of mice (n > 10 images per animal) of the same groups as in B at 30 weeks. Size bars: 50 μM. (G) Liver triglycerides (normalized to protein levels) at 30 weeks in water, HFCS, HWI, and HFCS-HWI groups. (H) Serum ALT levels at 30 weeks in water, HFCS, HWI, and HFCS-HWI groups. (I) Serum insulin levels at 30 weeks in water, HFCS, HWI, and HFCS-HWI groups. (J) Serum leptin levels at 30 weeks in water, HFCS, HWI, and HFCS-HWI groups. (K) Representative H&E images from epididymal adipose tissue of mice (n > 10 images per animal) on HFCS or HFCS-HWI groups. Size bars: 50 μM. (L) Total fat mass (g) at 30 weeks in water, HFCS, HWI, and HFCS-HWI groups. (M) Fat mass to total body weight percentage at 30 weeks in water, HFCS, HWI, and HFCS-HWI groups. The data in A–E, G–J, and L and M are presented as the mean ± SD and analyzed by 1-way ANOVA with Tukey’s post hoc analysis except for A, which was analyzed by a 2-tailed t test. *P < 0.05, **P < 0.01. n = 6 mice per group. See also Supplemental Figure 1 and Supplemental Table 3. HFCS, high-fructose corn syrup; HWI, high water intake; PT, portal triad; CV, central vein; ALT, alanine aminotransferase.
Figure 4
Figure 4. Lowering vasopressin as a therapeutic intervention in mice with sugar-induced metabolic syndrome.
(A) Weekly body weight gain in mice receiving water (red-dashed line) or HFCS (red solid line) for 30 weeks. At week 15 a subgroup of HFCS started the intervention with hydrogels (HFCS-HWI, blue solid line). (B) 30-week serum copeptin levels in water, HFCS, and HFCS-HWI groups. (C) 30-week urinary volume excretion (mL urine/24 hour) in water, HFCS, and HFCS-HWI groups. (D) Representative H&E images from livers of mice (n > 10 images per animal) of the same groups as in A at 30 weeks. Size bars: 50 μM. (E) 30-week serum ALT levels in water, HFCS, and HFCS-HWI groups. (F) 30-week serum Insulin levels in water, HFCS, and HFCS-HWI groups. (G) 30-week serum leptin levels in water, HFCS, and HFCS-HWI groups. (H) 30-week fat mass to total body weight percentage in water, HFCS, and HFCS-HWI groups. (I) Representative H&E images from epididymal adipose tissue of mice (n > 10 images per animal) on HFCS or HFCS-HWI groups. Size bars: 50 μM. The data in A–C and E–H are presented as the mean and analyzed by 1-way ANOVA with Tukey’s post hoc. The data for A were collected and analyzed weekly, whereas the data for B and C and E–H were collected and analyzed every 5 weeks. *P < 0.05, **P < 0.01. n = 6 mice per group. See also Supplemental Figure 1 and Supplemental Table 4. HFCS, high-fructose corn syrup; HWI, high water intake; PT, portal triad; CV, central vein; ALT, alanine aminotransferase.
Figure 5
Figure 5. Opposing effects of vasopressin receptors in fructose-induced metabolic syndrome.
(A) 30-week cumulative total and fructose-derived caloric intake in WT (black), V1aR-KO (ochre), and V1bR-KO (green) mice on 10% fructose. (B) Serum copeptin levels in WT, V1aR-KO, and V1bR-KO mice receiving a 10% fructose solution for 30 weeks. (C) Weekly body weight gain in WT, V1aR-KO, and V1bR-KO mice receiving a 10% fructose solution for 30 weeks. (D) Representative H&E images from livers of mice (n > 10 images per animal) of the same groups as in A at 30 weeks. Size bars: 50 μM. (E) Liver triglycerides (normalized to protein levels) at 30 weeks in WT, V1aR-KO, and V1bR-KO mice receiving a 10% fructose solution. (F) Serum ALT levels at 30 weeks in WT, V1aR-KO, and V1bR-KO mice receiving a 10% fructose solution. (G) Serum insulin levels at 30 weeks in WT, V1aR-KO, and V1bR-KO mice receiving a 10% fructose solution. (H) Serum leptin levels at 30 weeks in WT, V1aR-KO, and V1bR-KO mice receiving a 10% fructose solution. (I) Representative H&E images from epididymal adipose tissue of mice (n > 10 images per animal) of the same groups as in A at 30 weeks. Size bars: 50 μM. (J) Total fat mass (g) at 30 weeks in WT, V1aR-KO, and V1bR-KO mice receiving a 10% fructose solution. (K) Fat mass to total body weight percentage at 30 weeks in WT, V1aR-KO, and V1bR-KO mice receiving a 10% fructose solution. The data in A–C, E–H, and J and K are presented as the mean ± SD and analyzed by 1-way ANOVA with Tukey’s post hoc analysis. *P < 0.05, **P < 0.01. n = 6 mice per group. See also Supplemental Table 5. V1aR, vasopressin 1a receptor; V1bR, vasopressin 1b receptor; PT, portal triad; CV, central vein; ALT, alanine aminotransferase.
Figure 6
Figure 6. Hepatic V1bR potentiates the lipogenic effects of fructose.
(A) Transcriptional levels of the avpr1b in hypothalamus, pancreas, jejunum, kidney, liver, and spleen of WT mice on water Ctrl (clear purple bars) or receiving a 10% Frct solution for 30 weeks (solid purple bars). (B) Transcriptional levels of the avpr1a (red line) and the avpr1b (purple line) in liver of WT mice receiving a 10% Frct solution for 30 weeks. (C and D) Representative Western blot and densitometry (n = 2 total blots) for the V1bR, fructokinase (KHK), and actin in human HepG2 cells Ctrl or exposed to AVP (250 nM), Frct (10 mM), or a combination of Frct plus AVP for 5 days. (E) KHK activity in HepG2 lysates from Ctrl, AVP, Frct, and Frct plus AVP cells. (F) Representative Western blot and densitometry (n = 2 total blots) for V1bR and actin in HepG2 transduced with noncodifying shRNA (scr) or shRNA against avpr1b (shAvpr1b) at baseline or a Frct (10 mM) exposure. (G) Representative Western blot and densitometry (n = 2 total blots) for KHK and actin in Ctrl, AVP, Frct, and Frct plus AVP HepG2 cells stably silenced for V1bR expression. (H and I) Representative Western blot (n = 2 total blots) and densitometry for KHK, actin, and lipogenic enzymes FAS and ACC in the liver of WT and V1bR-KO mice on water Ctrl or receiving a 10% Frct solution for 30 weeks. The data in A and C–E are presented as the mean ± SD and analyzed by 1-way ANOVA with Tukey’s post hoc analysis. *P < 0.05, **P < 0.01. For A and B and E, n = 6 mice per group. For CE, n = 2 independent cultured plates. V1bR, vasopressin 1b receptor; avpr1b, vasopressin 1b receptor gene; avpr1a, vasopressin 1a receptor gene; KHK, ketohexokinase; Ctrl, control; AVP, vasopressin; Frct, fructose; scr, scramble; FAS, fatty acid synthase; ACC, acetyl-CoA carboxylase.
Figure 7
Figure 7. Proposed mechanism for the interplay between fructose and vasopressin in metabolic syndrome.
(Left side, orange lines) Fructose stimulates both the expression of fructokinase (KHK) and the induction of the V1bR in the liver. Fructose metabolism in both liver and hypothalamus stimulates the production and secretion of AVP. The actions of AVP on hepatic V1bR potentiate the metabolic effects of fructose on the expression of KHK and lipogenic enzymes FAS and ACC. As a result, AVP and fructose promote fatty liver, adiposity, and body weight gain during the development and progression of metabolic syndrome. (Right side, blue lines) Hydration and other strategies directed to lower circulating AVP levels would decrease the hepatic expression of both V1bR and KHK in response to fructose. As a consequence, less fructose would be metabolized into fat, thus limiting the progression of metabolic syndrome. V1bR, vasopressin 1b receptor; AVP, vasopressin; KHK, ketohexokinase; FAS, fatty acid synthase; ACC, acetyl-CoA carboxylase.

Similar articles

Cited by

References

    1. Malik VS, et al. Sugar-sweetened beverages and risk of metabolic syndrome and type 2 diabetes: a meta-analysis. Diabetes Care. 2010;33(11):2477–2483. doi: 10.2337/dc10-1079. - DOI - PMC - PubMed
    1. Narain A, et al. Soft drink intake and the risk of metabolic syndrome: A systematic review and meta-analysis. Int J Clin Pract. 2017;71(2) - PubMed
    1. Malik VS, et al. Long-term consumption of sugar-sweetened and artificially sweetened beverages and risk of mortality in US adults. Circulation. 2019;139(18):2113–2125. doi: 10.1161/CIRCULATIONAHA.118.037401. - DOI - PMC - PubMed
    1. Yang Q, et al. Added sugar intake and cardiovascular diseases mortality among US adults. JAMA Intern Med. 2014;174(4):516–524. doi: 10.1001/jamainternmed.2013.13563. - DOI - PMC - PubMed
    1. Schwimmer JB, et al. Effect of a low free sugar diet vs usual diet on nonalcoholic fatty liver disease in adolescent boys: a randomized clinical trial. JAMA. 2019;321(3):256–265. doi: 10.1001/jama.2018.20579. - DOI - PMC - PubMed

Publication types

MeSH terms