. 2021 Feb 15;131(4):e140333.
doi: 10.1172/JCI140333.

Active bacterial modification of the host environment through RNA polymerase II inhibition

Affiliations

Active bacterial modification of the host environment through RNA polymerase II inhibition

Inès Ambite et al. J Clin Invest. .

Abstract

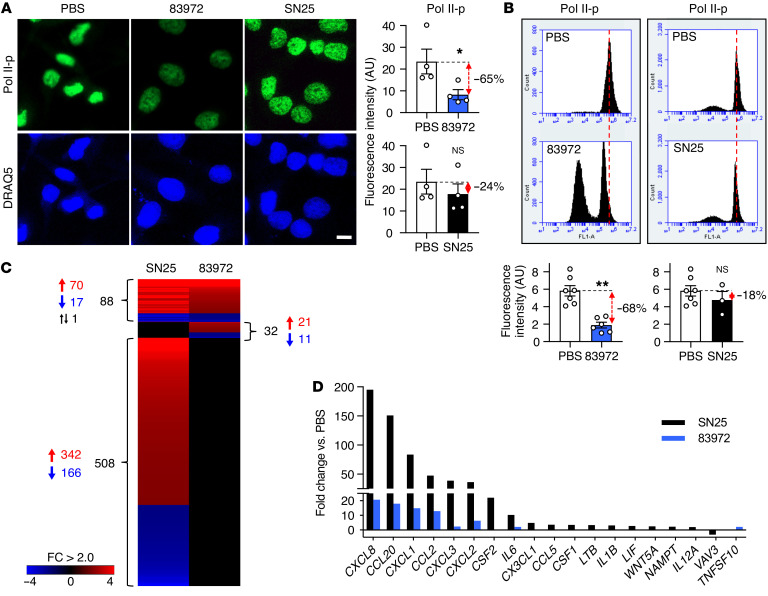
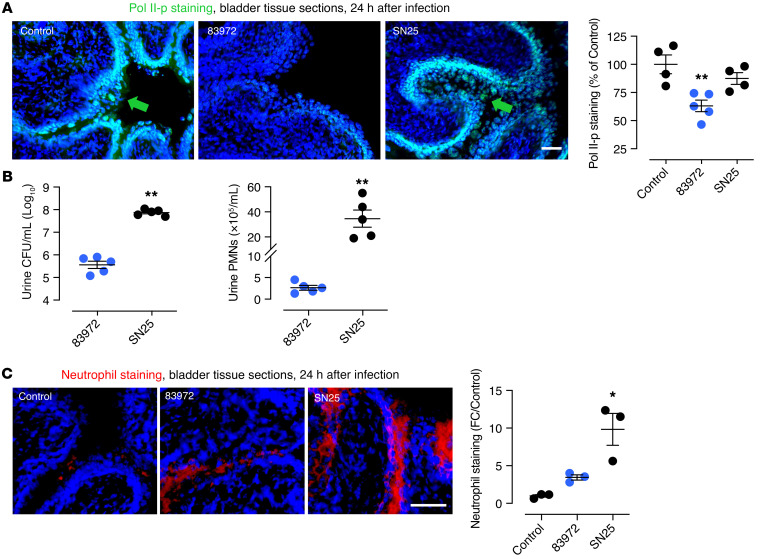
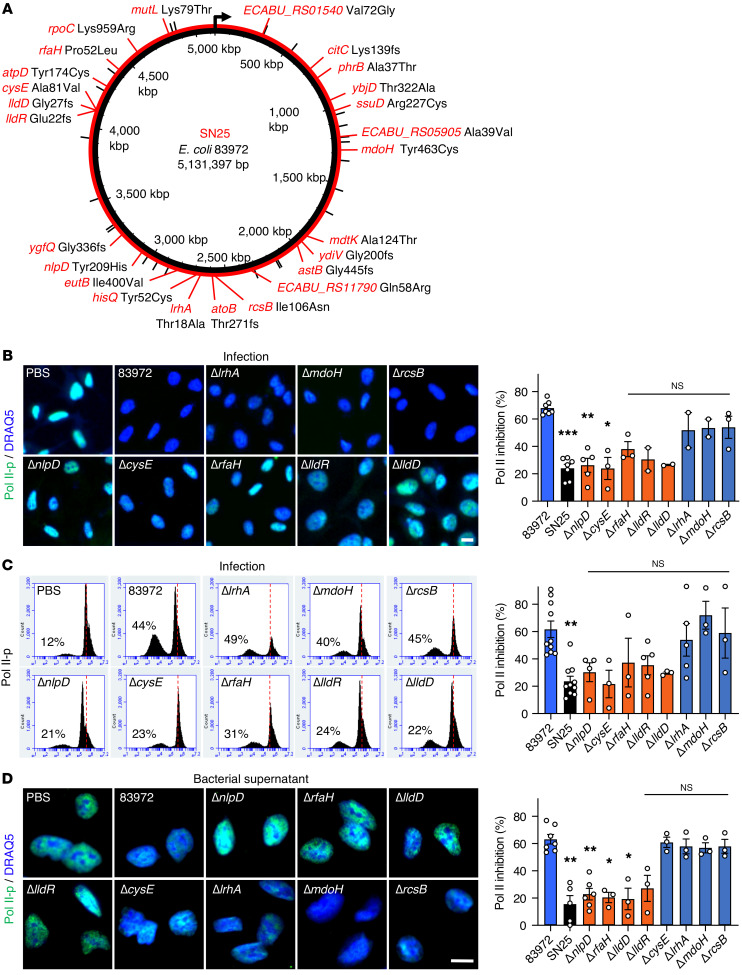
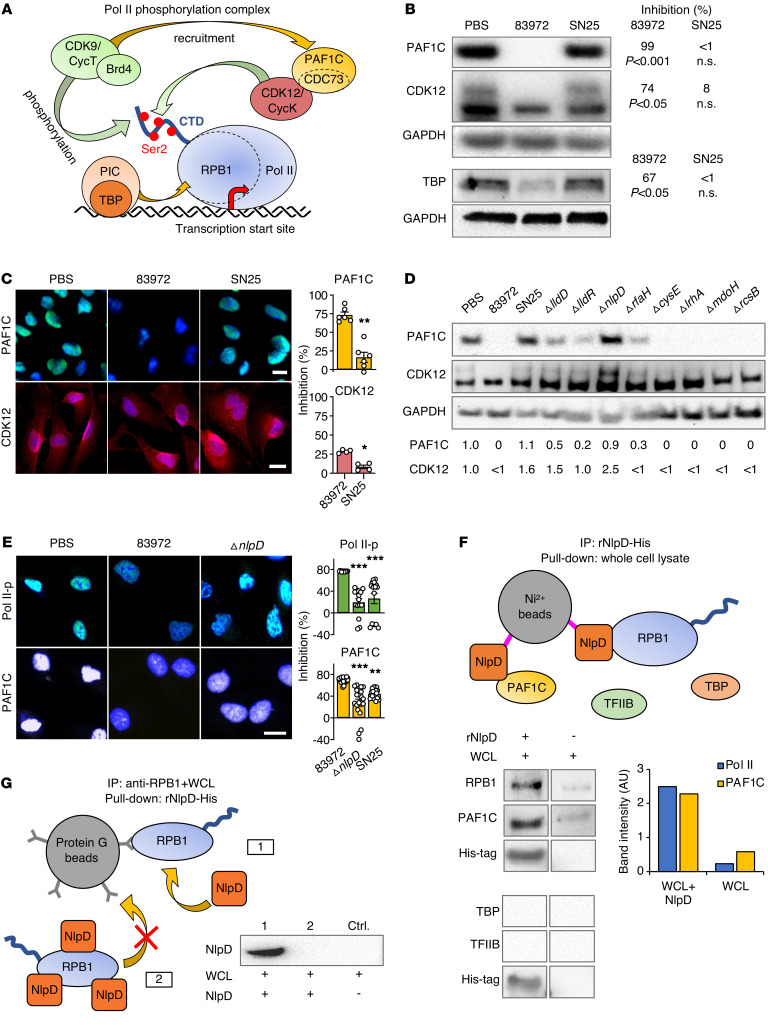
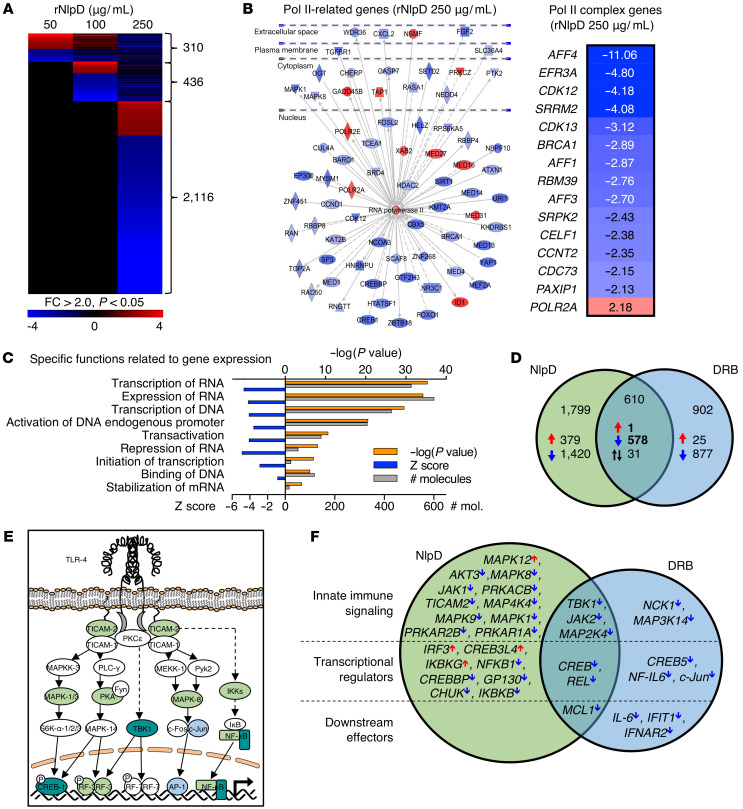
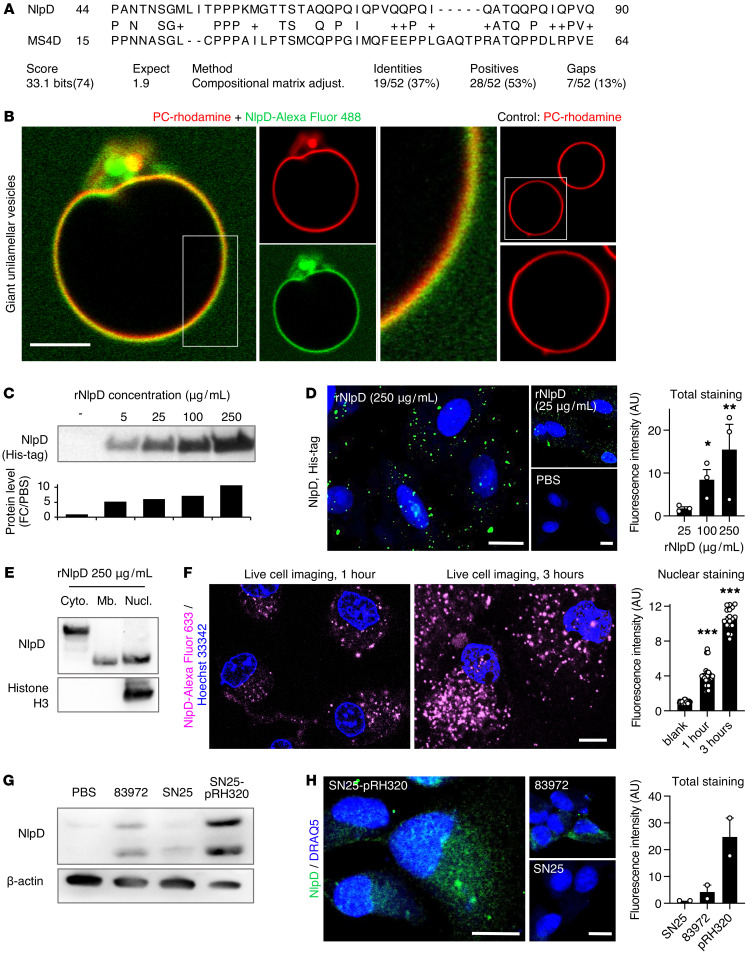
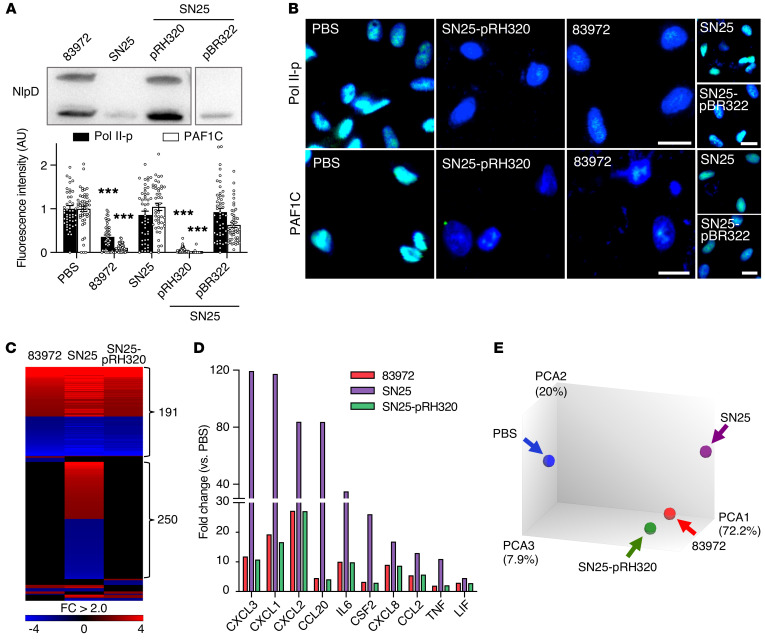
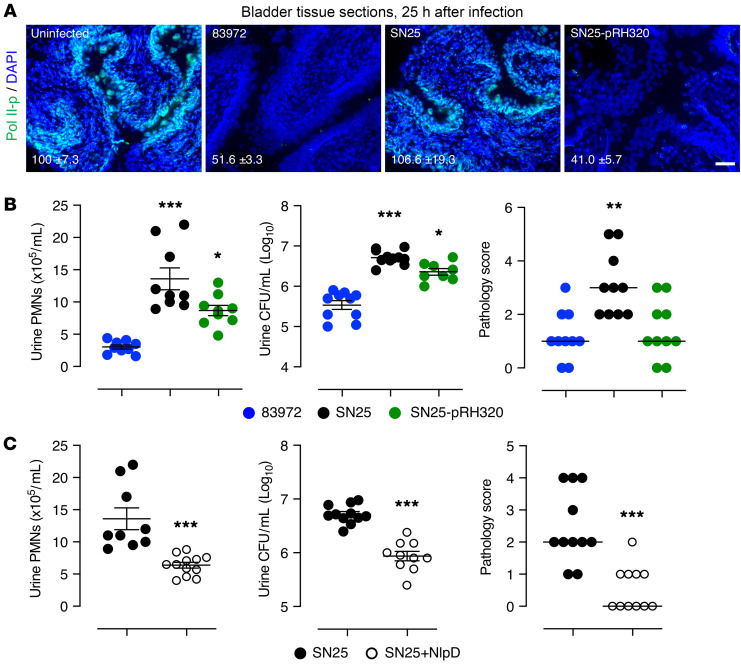
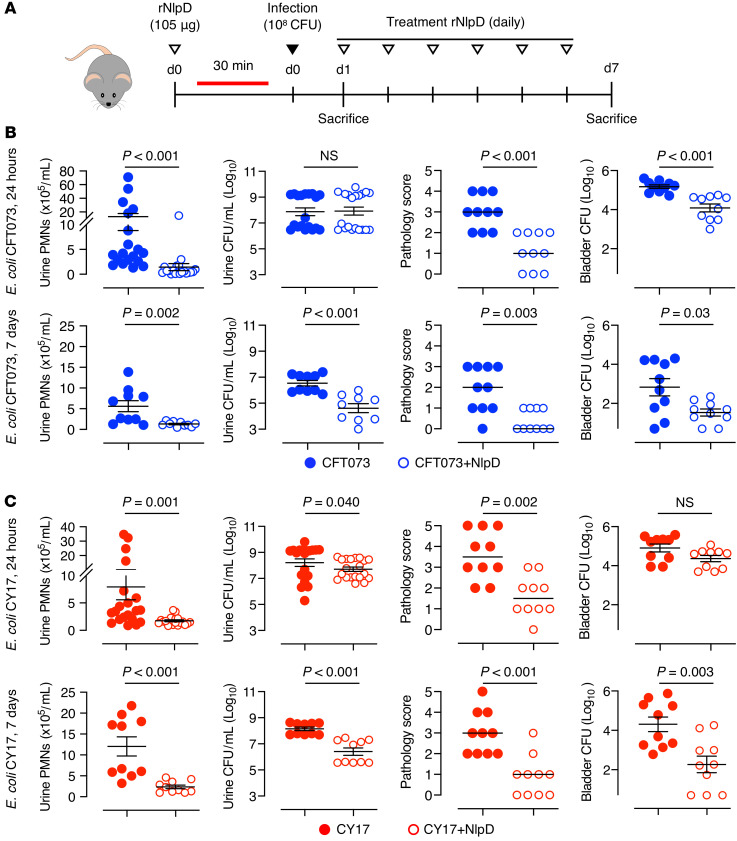
Unlike pathogens, which attack the host, commensal bacteria create a state of friendly coexistence. Here, we identified a mechanism of bacterial adaptation to the host niche, where they reside. Asymptomatic carrier strains were shown to inhibit RNA polymerase II (Pol II) in host cells by targeting Ser2 phosphorylation, a step required for productive mRNA elongation. Assisted by a rare, spontaneous loss-of-function mutant from a human carrier, the bacterial NlpD protein was identified as a Pol II inhibitor. After internalization by host cells, NlpD was shown to target constituents of the Pol II phosphorylation complex (RPB1 and PAF1C), attenuating host gene expression. Therapeutic efficacy of a recombinant NlpD protein was demonstrated in a urinary tract infection model, by reduced tissue pathology, accelerated bacterial clearance, and attenuated Pol II-dependent gene expression. The findings suggest an intriguing, evolutionarily conserved mechanism for bacterial modulation of host gene expression, with a remarkable therapeutic potential.

Keywords: Immunotherapy; Inflammation; Microbiology; Transcription.


Conflict of interest statement

Conflict of interest: IA, NAF, and CS are inventors on patents related to the therapeutic use of NlpD (US 16/341,962, Europe 17797991.1, Australia 2017344453, India 20194718316, Singapore 11201903336U). IA, NAF, DSCB, THT, BW, and CS are shareholders of SelectImmune Pharma, a biotech startup company developing alternatives to antibiotics in UTI treatment and CS is chairman of the board.

Figures

Figure 1
Figure 1. Bacterial inhibition of Pol II phosphorylation.
(A and B) Identification of E. coli SN25 as a loss-of-function mutant. Pol II Ser2 phosphorylation was quantified in human kidney cells infected with the ABU strain E. coli 83972 or E. coli SN25, a re-isolate from a human carrier of E. coli 83972. (A) Confocal microscopy and (B) flow cytometry. Nuclei were counterstained with DRAQ5. Histograms show quantification of fluorescence intensity. Scale bar: 10 μm. Data are presented as mean ± SEM (n = 3–6 experiments). *P < 0.05, **P < 0.01 compared with PBS control by Kruskal-Wallis test with Dunn’s multiple-comparison test. (C and D) Comparative gene expression analysis of host cells infected with E. coli 83972 or SN25. (C) Heatmap: >500 genes were regulated exclusively in response to E. coli SN25. (D) E. coli SN25 activated innate immune response genes more efficiently than E. coli 83972. Data are representative of 2 independent experiments; fold change (FC) > 2.0 compared with PBS control.
Figure 2
Figure 2. In vivo response to urinary tract infection in C57BL/6 mice, comparing E. coli SN25 to 83972.
(A) Mucosal Pol II phosphorylation at Ser2 (Pol II-p) was inhibited by E. coli 83972 but not by E. coli SN25. Pol II-p staining is indicated by the arrows. (B) Urine bacterial counts and neutrophil numbers were higher in E. coli SN25–infected mice after 24 hours (PMNs, polymorphonuclear leukocytes; CFU, colony forming unit), as well as (C) tissue neutrophil staining. Data are representative of 2 independent experiments and are presented as mean ± SEM (n = 5 mice). Scale bars: 50 μm. *P < 0.05, **P < 0.01 compared with control by Kruskal-Wallis test with Dunn’s multiple-comparison test. See also Figure 8 and Supplemental Figure 1.
Figure 3
Figure 3. Inhibition of Pol II phosphorylation by E. coli 83972 single gene mutants.
(A) Schematic of genomic changes detected in the E. coli SN25 genome (red lines) compared with the ancestral strain E. coli 83972 (black lines) (n = 48). Genes with mutations leading to amino acid changes or frame shifts (fs) are indicated in red. (B and C) Pol II inhibition by E. coli 83972 single gene deletion mutants. Human kidney epithelial cells were infected for 4 hours, stained with antibodies against Pol II phosphorylated on Ser2 (Pol II-p), and analyzed by (B) confocal microscopy or (C) flow cytometry. The inhibitory phenotype of E. coli 83972 was attenuated after deletion of lldD, lldR, nlpD, rfaH, or cysE. (D) Pol II inhibition by supernatants from E. coli 83972 single gene deletion mutants. The ΔlldD, ΔlldR, ΔnlpD, or ΔrfaH deletions (red) attenuated Pol II inhibition, reproducing the E. coli SN25 phenotype. Scale bars: 10 μm. Data are presented as mean ± SEM (n = 2–10 experiments). *P < 0.05, **P < 0.01, ***P < 0.001 compared with E. coli 83972 by Kruskal-Wallis test with Dunn’s multiple-comparison test.
Figure 4
Figure 4. Effects on the Pol II phosphorylation machinery.
(A) Schematic of the Pol II phosphorylation machinery in eukaryotic cells (29). The Pol II phosphorylation complex binds to DNA at different eukaryotic promoters. CDK9 brings the PAF1C adaptor close to Pol II and the PAF1C subunit CDC73 recruits CDK12 to the complex. CDK9 and CDK12 then phosphorylate the Pol II subunit RPB1 CTD domain at Ser2. (B and C) PAF1C (CDC73) and CDK12 protein levels were markedly reduced by supernatants from E. coli 83972 but not E. coli SN25. (B) Western blot analysis of whole cell extracts, and (C) confocal imaging of human kidney cells. Histograms show quantification of fluorescence intensity. Data are presented as mean ± SEM (n = 4–5 experiments); Mann-Whitney U test. (D) Mutant screen for effects on PAF1C (CDC73) and CDK12 in human kidney cells. The ΔnlpD deletion mutant failed to inhibit PAF1C and CDK12. Western blot analysis of whole cell extracts. Band intensities were quantified (FC compared with PBS). (E) Loss of Pol II-p and PAF1C inhibition in E. coli SN25– and E. coli 83972 ΔnlpD–infected cells compared with those infected with E. coli 83972. Data are presented as mean ± SEM (n = 20 cells). Scale bars: 10 μm. *P < 0.05, **P < 0.01, ***P < 0.001 compared with E. coli 83972 by Kruskal-Wallis test with Dunn’s multiple-comparison test. (F) NlpD pull-down of RPB1 and PAF1C. Whole cell lysates (WCL) were exposed to Ni2+ beads coated with rNlpD-His and binding partners were identified by Western blot. TBP and TFIIB were not detected. (G) RPB1 binding to anti-RPB1–coated magnetic beads is inhibited by rNlpD (lane 2). Pull-down of RPB1 from whole cell lysates by the coated beads (lane 1) was competitively inhibited by rNlpD (lane 2). Data are representative of 3 independent experiments.
Figure 5
Figure 5. Effects of NlpD on host gene expression.
Genome-wide transcriptomic analysis of human kidney cells exposed to rNlpD (50–250 μg/mL, 4 hours). Cells treated with PBS served as controls. (A) Dose-dependent regulation of gene expression by rNlpD (n = 2,410 genes were regulated at the highest dose, 84% were inhibited). Heatmap of differentially regulated genes in human kidney cells. (B) An RNA Pol II–centric gene network with inhibited (blue) or activated (red) genes in cells exposed to rNlpD (250 μg/mL). Effects on members of the Pol II phosphorylation complex. CDC73/PAF1C, CCNT2, CDK12, and CDK13 were inhibited. (C) Gene expression was the most strongly regulated function in cells exposed to rNlpD. (D) Comparative analysis of NlpD and DRB, a chemical Pol II inhibitor; 578 of 610 genes regulated by both NlpD and DRB were inhibited. (E and F) Effects on innate immune signaling activated by uropathogenic E. coli (33, 50). NlpD (green) inhibited a large number of genes in this pathway as well as transcriptional regulators. DRB (blue) showed a partial effect. Both NlpD and DRB inhibited the genes at the intersection (dark turquoise). Fold change (FC) > 2.0 and P < 0.05 compared with PBS control.
Figure 6
Figure 6. Membrane interaction and transfer of rNlpD into host cells.
(A) Sequence alignment of NlpD and the human MS4D protein. (B) Membrane interaction of rNlpD (Alexa Fluor 488, green) with giant unilamellar vesicles, labeled with rhodamine (red). Membrane colocalization (yellow) was detected in 6 of 13 vesicles. PC, phosphatidyl choline. (CF) NlpD was detected in lysates and was internalized by human kidney cells exposed to rNlpD-His protein (0–250 μg/mL). (C) Western blot stained with anti-His antibodies. (D) Confocal imaging of cells stained with anti-His antibodies. Nuclei were counterstained with DRAQ5. Data are presented as mean ± SEM (n = 3 experiments). (E) NlpD was detected in the cytoplasm, membrane, and nuclei of treated cells. Western blot of cellular fractions stained with anti-NlpD antibodies. (F) NlpD internalization and nuclear translocation in cells exposed to Alexa Fluor 633–labeled rNlpD (magenta, 250 μg/mL) for 1 or 3 hours. Live-cell imaging: the nuclear plane of each image is shown. NlpD levels were quantified from 3 Z-stacks surrounding the nuclear plane. Nuclei were counterstained with Hoechst 33342. Data are presented as mean ± SEM (n = 18–24 cells). (G and H) Detection of NlpD in human kidney cells after infection with E. coli 83972 or the nlpD-reconstituted strain E. coli SN25-pRH320. (G) Western blot of whole cell lysates stained with anti-NlpD antibodies. Data are representative of 2 independent experiments. (H) NlpD uptake after infection. Staining was quantified by confocal imaging using anti-NlpD antibodies. E. coli SN25 served as a negative control. Scale bars: 10 μm. Data are presented as mean ± range (n = 2 experiments). *P < 0.05, **P < 0.01, ***P < 0.001 compared with 25 μg/mL (D) or compared with blank (F) by Kruskal-Wallis test with Dunn’s multiple-comparison test.
Figure 7
Figure 7. Complementation of nlpD and rpoS expression in E. coli SN25.
(A) NlpD levels in the supernatant of E. coli SN25-pRH320, complemented with the nlpD-rpoS operon from E. coli 83972. E. coli SN25-pBR322 carrying the empty vector served as a negative control (35, 36). (B) Inhibition by E. coli SN25-pRH320 of Pol II-p and PAF1C in infected cells. Nuclei were counterstained with DRAQ5. Fluorescence intensity was quantified by confocal microscopy, normalized against uninfected cells. Data are representative of 3 independent experiments and are presented as mean ± SEM (n = 50 cells). Scale bars: 20 μm. ***P < 0.001 compared with PBS by Kruskal-Wallis test with Dunn’s multiple-comparison test. (CE) Whole genome transcriptomic analysis of the cellular response to infection (1 × 10⁸ CFU/mL, 4 hours). (C) Reduced transcriptional activity in cells infected with E. coli SN25-pRH320. Heatmap: FC > 2.0 compared with uninfected cells. (D) Antiinflammatory effect of E. coli SN25-pRH320 defined by the inhibition of specific cytokine genes. (E) Principal component analysis of gene expression profiles in cells infected with E. coli SN25-pRH320 or E. coli 83972, compared with SN25 and uninfected controls.
Figure 8
Figure 8. In vivo validation of nlpD complementation and treatment.
Mice were infected with E. coli 83972, SN25, or SN25-pRH320 and sacrificed after 24 hours. (A) NlpD-rpoS reconstitution increased Pol II inhibition in vivo. Tissue sections were stained with anti–Pol II-p antibodies and the fluorescence intensity was quantified (mean ± SEM). Reduced Pol II-p staining in the bladder mucosa of mice infected with E. coli 83972 or E. coli SN25-pRH320 (P = 0.006) compared with E. coli SN25. (B) Neutrophil (left) and bacterial counts (middle) in urine, and bladder pathology scores (right) were reduced in mice infected with E. coli SN25-pRH320 compared with E. coli SN25 (PMNs, polymorphonuclear leukocytes; CFU, colony forming unit). *P < 0.05, **P < 0.01, ***P < 0.001 compared with E. coli 83972 by Kruskal-Wallis test with Dunn’s multiple-comparison test. (C) E. coli SN25–infected, NlpD-treated mice showed lower neutrophil counts (left), bacterial counts (middle), and bladder pathology scores (right) than untreated mice (24 hours). ***P < 0.001 by Mann-Whitney test. Urine PMNs and CFUs for SN25-infected mice are presented in B and C. Scale bar: 50 μm. Data are presented as mean ± SEM (n = 5 mice, 2 independent experiments).
Figure 9
Figure 9. Therapeutic efficacy of NlpD against pathogenic E. coli strains.
(A) NlpD treatment protocol in mice infected with the uropathogenic E. coli strain CFT073 or CY17. Mice were pretreated with rNlpD protein by intraperitoneal injection, 30 minutes before intravesical bacterial infection and daily, for 7 days. (B and C) The bladder pathology score, urine neutrophil counts, and bacterial counts in urine and bladder tissue were reduced by NlpD treatment (open circles) compared with untreated mice (dots) after (B) E. coli CFT073 (blue) or (C) E. coli CY17 (red) infection. PMNs, polymorphonuclear leukocytes; CFU, colony forming unit. Data are presented as mean ± SEM (n = 5 per time point, 2 independent experiments) and were analyzed by Mann-Whitney test.

Comment in

Similar articles

Cited by

References

    1. Ghosh AR. Appraisal of microbial evolution to commensalism and pathogenicity in humans. Clin Med Insights Gastroenterol. 2013;6:1–12. - PMC - PubMed
    1. Are A, et al. Enterococcus faecalis from newborn babies regulate endogenous PPARgamma activity and IL-10 levels in colonic epithelial cells. Proc Natl Acad Sci U S A. 2008;105(6):1943–1948. doi: 10.1073/pnas.0711734105. - DOI - PMC - PubMed
    1. Nepelska M, et al. Commensal gut bacteria modulate phosphorylation-dependent PPARgamma transcriptional activity in human intestinal epithelial cells. Sci Rep. 2017;7:43199. - PMC - PubMed
    1. Zdziarski J, et al. Molecular basis of commensalism in the urinary tract: low virulence or virulence attenuation? Infect Immun. 2008;76(2):695–703. doi: 10.1128/IAI.01215-07. - DOI - PMC - PubMed
    1. Lutay N, et al. Bacterial control of host gene expression through RNA polymerase II. J Clin Invest. 2013;123(6):2366–2379. doi: 10.1172/JCI66451. - DOI - PMC - PubMed

Publication types

MeSH terms