. 2021 Feb 1;131(3):e142823.
doi: 10.1172/JCI142823.

An unbiased approach to defining bona fide cancer neoepitopes that elicit immune-mediated cancer rejection

Affiliations

An unbiased approach to defining bona fide cancer neoepitopes that elicit immune-mediated cancer rejection

Cory A Brennick et al. J Clin Invest. .

Abstract

Identification of neoepitopes that are effective in cancer therapy is a major challenge in creating cancer vaccines. Here, using an entirely unbiased approach, we queried all possible neoepitopes in a mouse cancer model and asked which of those are effective in mediating tumor rejection and, independently, in eliciting a measurable CD8 response. This analysis uncovered a large trove of effective anticancer neoepitopes that have strikingly different properties from conventional epitopes and suggested an algorithm to predict them. It also revealed that our current methods of prediction discard the overwhelming majority of true anticancer neoepitopes. These results from a single mouse model were validated in another antigenically distinct mouse cancer model and are consistent with data reported in human studies. Structural modeling showed how the MHC I-presented neoepitopes had an altered conformation, higher stability, or increased exposure to T cell receptors as compared with the unmutated counterparts. T cells elicited by the active neoepitopes identified here demonstrated a stem-like early dysfunctional phenotype associated with effective responses against viruses and tumors of transgenic mice. These abundant anticancer neoepitopes, which have not been tested in human studies thus far, can be exploited for generation of personalized human cancer vaccines.

Keywords: Antigen; Bioinformatics; Cancer immunotherapy; Immunology; Oncology.


Conflict of interest statement

Conflict of interest: The authors have declared that no conflict of interest exists.

Figures

Figure 1
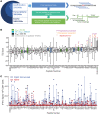
Figure 1. Unbiased identification of TRMNs.
(A) All experimentally confirmed SNVs of the MC38-FABF tumor, and screening strategy for tumor rejection. (B) Box-and-whisker plot representing the tumor control index (TCI) scores (9) for 58 of all 279 peptides, represented by numbers on the x axis. The remaining 221 peptides elicited no tumor control and are not shown. The negative control (extreme left) consists of mice immunized with unpulsed BMDCs. Peptides that elicited significant tumor control are marked by asterisks. P and T indicate activity in prophylaxis and therapy. Combination of 9 positive peptides (TRMNs) is on the extreme right. The IC50 values for peptide–MHC I (Kb/Db) were predicted using NetMHC 4.0; the values represent the highest predicted binder for each SNV or an experimentally verified precise neoepitope. Peptides are color coded by IC50 values as indicated in the box. n = 5–15 mice/group, except for the 9 active peptides (TRMNs), for which n = 20–50 mice per peptide. All peptides were tested at least 3 times; the 9 active peptides (TRMNs) were tested between 4 and 8 times each. (C) CD8+ (IFN-γ ELISpot) responses to peptides from B in MC38-FABF–immunized (blue bars) or naive mice (red bars) (n = 4 mice/group). To generate the box-and-whisker plots, data from every single mouse were entered. The box extends from the 25th to 75th percentiles, the middle line represents the median in each group, and the “+” represents the mean. The whiskers extend from the minimum to maximum value. Statistical analysis was conducted for peptides’ response against wells with no target. All peptides were tested at least 2 times. (B and C) Mean ± SD shown. *P < 0.05 by Student’s t test (B) or 2-way ANOVA (C).
Figure 2
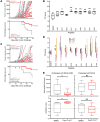
Figure 2. Characterization of the activity of TRMNs.
(A) Tumor growth curves (top) and percentage survival (bottom) of mice immunized prophylactically with FAM171bMUT (red) or unpulsed BMDCs (gray). Each line shows tumor volume for 1 mouse. The experiment was done 2 times (n = 10 and n = 5). (B) TCI scores of mice treated with each of the 9 TRMNs on days 0 and 7 after tumor challenge. n = 10 mice/group. The experiment was done twice. (C) Tumor growth curves (top) and percentage survival (bottom) of mice treated on days 10 and 17 after tumor challenge (indicated by arrows) with FAM171bMUT (red) or unpulsed BMDC (gray), n = 10 mice/group. The experiment was done twice. (D) TCI scores of mice immunized with the 9 TRMNs and depleted of CD8+ (purple) or CD4+ cells (orange) or treated with an isotype control antibody (αLTF2) (black). The experiment was done twice. n = 5 mice/group. (E) Mice (n = 15) were immunized with unpulsed or FAM171bMUT-pulsed BMDCs. Five days later, CD8+ cells were isolated from the inguinal and popliteal lymph nodes. Two million CD8+ T cells were adoptively transferred into 9 mice/group. Mice were challenged with MC38-FABF on the right flank and MC38 on the left flank. Tumor growth was monitored. Data represent area under the curve (top) and growth inhibition (bottom) in mice that received T cell transfers from unpulsed BMDC-immunized mice (gray) or FAM171bMUT-immunized mice (red). *P < 0.05; **P < 0.01 by log-rank (Mantel-Cox) test (survival plots in A and C), Student’s t test (B and E), or 2-way ANOVA with Tukey’s multiple-comparison test (D). Box-and-whisker plots were generated as in Figure 1.
Figure 3
Figure 3. Definition of precise peptides for FAM171b and COX6a2 and their interaction with cognate MHC I alleles.
(A) Sequences and binding affinities for Kb and Db of the putative precise peptides of the 9 TRMNs (left); TCI scores of mice immunized with precise TRMN peptides, n = 15 mice/group (right). *P < 0.05, **P < 0.01 by Student’s t test. (B) Geometric MFIs of Kb (top) and Db (bottom) of RMA-S cells pulsed with precise TRMN peptides. Data represent mean of triplicate values ± SD. *P < 0.05 by 2-way ANOVA. Each peptide was tested at least 2 times. (C) Structural models of binding of Kb with precise peptides of WT and mutant FAM171b, COX6a2. The WT is shown in green and the mutant in orange, with the MHC binding groove in gray. (D) MS/MS mirror plot displaying similarity of overall fragment ion coverage and relative abundances of identified fragment ions between a single-scan pulsed BMDC MS/MS (top pane) matched to sequence EVSGVHRFF and the single-scan MS/MS of the corresponding synthetic peptide (bottom pane). Fragment ions and neutral losses are labeled in both spectra, shared ions are shaded maroon, and singly charged (red arrows) and doubly charged ions (orange arrows) are annotated as observed for the pulsed BMDC peptide in the fragment ion coverage map. Ions represented by “•” denote those that fall within the prescribed isolation window. (E) Left: structural model of SH3RF1 bound to Kb. The color scheme is as in C. APBS electrostatic surface potentials of mutant Sh3rf1 (top right) and WT Sh3rf1 (bottom right). Surface potentials are on a scale of –4.000 (blue) to +4.000 (red) kBTec–1, or approximately 26.7 mV per 1.000 at 310 K. Box-and-whisker plots were generated as in Figure 1.
Figure 4
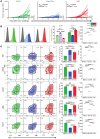
Figure 4. Phenotypes of CD8+ TILs from mice immunized with a TRMN and a non-TRMN.
Mice (n = 15 mice per group) were immunized with unpulsed BMDCs (green) or BMDCs pulsed with peptides FAM171bMUT (a TRMN, blue) or Cd9MUT (a non-TRMN, red) and challenged with MC38-FABF. Tumors were harvested on day 25 after tumor challenge and CD8+ TILs isolated. (A) Tumor growth of mice immunized with each group. IC50 values for cognate alleles and IFN-γ ELISpot response of CD8+ T cells from spleens of MC38-FABF–immunized mice are indicated for each peptide (0–50 spots/106 CD8+ cells = ++, >140 spots/106 CD8+ cells = ++++). (B) MFI of PD-1 in CD8+ TILs (left); bar graph representing percentage of PD-1lo and PD-1hi cells (middle; data represented as mean ± SD with individual points); quantification of MFI of PD-1 (right). n = 5 pooled mice per group, 3 technical replicates. (C) Flow cytometry contour plots with indicated markers in CD8+PD-1+ (low and high) TILs (left) with respective stacked bar graphs representing percentage of cells (middle) and quantification of MFI (right). Data represented as mean ± SD; n = 5 pooled mice per group, 3 technical replicates. *P < 0.05, **P < 0.01, ***P < 0.001, ****P < 0.0001 by ANOVA with Tukey’s multiple-comparison test (B and C). The data are representative of 3 independent experiments.
Figure 5
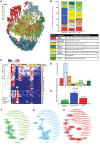
Figure 5. Single-cell RNA-Seq analysis of CD8+ PD-1+ TILs from mice immunized with a TRMN and a non-TRMN.
Mice (n = 3 per group) were immunized with unpulsed BMDCs or BMDCs pulsed with peptides FAM171bMUT (a TRMN) or Cd9MUT (a non-TRMN) and challenged with MC38-FABF. Tumors were harvested on day 25 after tumor challenge and live CD8+PD-1+ TILs isolated by FACS and sequenced by scRNA-Seq. Approximately 4400 CD8+PD-1+ TILs were analyzed in each library. (A) Three-dimensional t-SNE plot showing clustering based on top average TF-IDF genes. (B) Top: composition (distribution) plot showing percentage of cells in the 8 clusters along with respective annotations in unpulsed BMDCs, FAM171bMUT, and Cd9MUT libraries; bottom: table showing cluster annotation based on selected markers. (C) Summary heatmap of selected differentially expressed genes (threshold of differential expression as defined in Methods). (D and E) Percentage of Tcf7-expressing cells in each of the 8 clusters (D) or in each of the 3 libraries as indicated (E). (FH) Cluster results of applying GLIPH to the TCRs of each library as indicated. Each node is a TCR and each edge between the TCRs indicates the GLIPH-predicted shared specificity. Blue edges indicate shared local motif and orange edges indicate shared global similarity.
Figure 6
Figure 6. Defining TRMNs with novel characteristics.
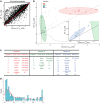
(A) Scatter plot of the normalized (scaled and centered) values (for every potential precise peptide for each SNV tested) of mutant IC50 (nM) on the x axis versus the WT IC50 (nM) on the y axis. The red diagonal represents equal IC50 values for mutant and WT or DAI value of 0 in scale. (B) Plot shows the bivariate scatter plot of the normalized reference and mutant IC50 values of all the peptides; the TRMNs group in 3 clusters: red circles in cluster 1 (7 peptides), green triangles in cluster 2 (5 peptides), and blue squares in cluster 3 (9 peptides). All non-TRMNs are in gray. Inset: zoomed-in illustration of cluster 3. (C) Table listing all TRMNs in the 3 clusters. (D) Plot showing the density of scaled mutant IC50 values of all TRMN and non-TRMN neoepitopes of MC38-FABF.

References

    1. Sette A, et al. The relationship between class I binding affinity and immunogenicity of potential cytotoxic T cell epitopes. J Immunol. 1994;153(12):5586–5592. - PubMed
    1. Keskin DB, et al. Neoantigen vaccine generates intratumoral T cell responses in phase Ib glioblastoma trial. Nature. 2019;565(7738):234–239. doi: 10.1038/s41586-018-0792-9. - DOI - PMC - PubMed
    1. Zaidi N, Jaffee EM. Immune cells track hard-to-target brain tumours. Nature. 2019;565(7738):170–171. doi: 10.1038/d41586-018-07728-9. - DOI - PMC - PubMed
    1. Ghorani E, et al. Differential binding affinity of mutated peptides for MHC class I is a predictor of survival in advanced lung cancer and melanoma. Ann Oncol. 2018;29(1):271–279. doi: 10.1093/annonc/mdx687. - DOI - PMC - PubMed
    1. Rech AJ, et al. Tumor immunity and survival as a function of alternative neopeptides in human cancer. Cancer Immunol Res. 2018;6(3):2326–287. - PMC - PubMed

Publication types