. 2021 Feb 15;131(4):e140196.
doi: 10.1172/JCI140196.

PD-1 blockade improves Kupffer cell bacterial clearance in acute liver injury

Affiliations

PD-1 blockade improves Kupffer cell bacterial clearance in acute liver injury

Evangelos Triantafyllou et al. J Clin Invest. .

Abstract

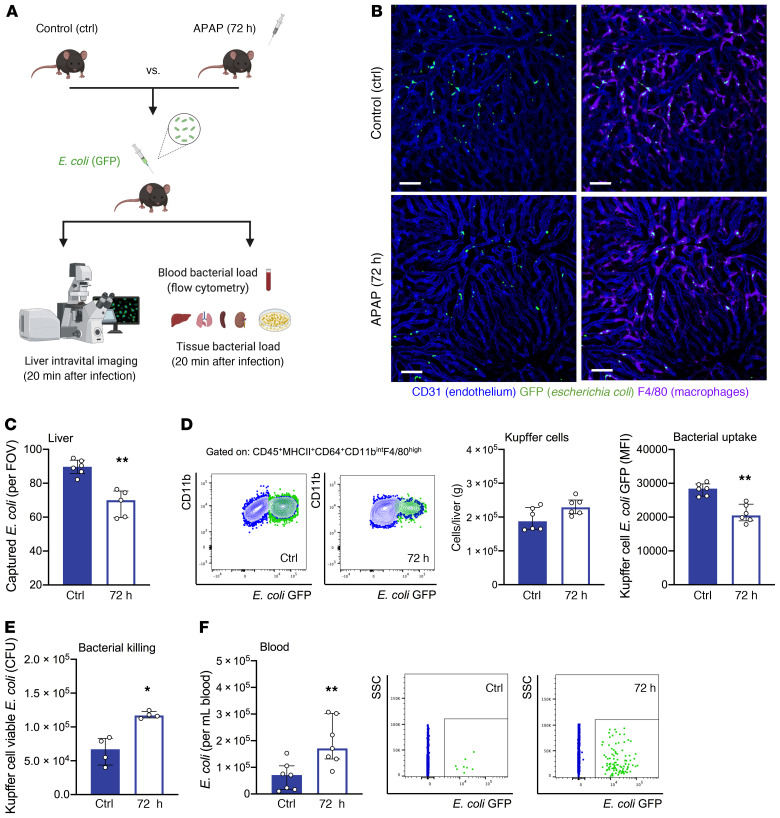
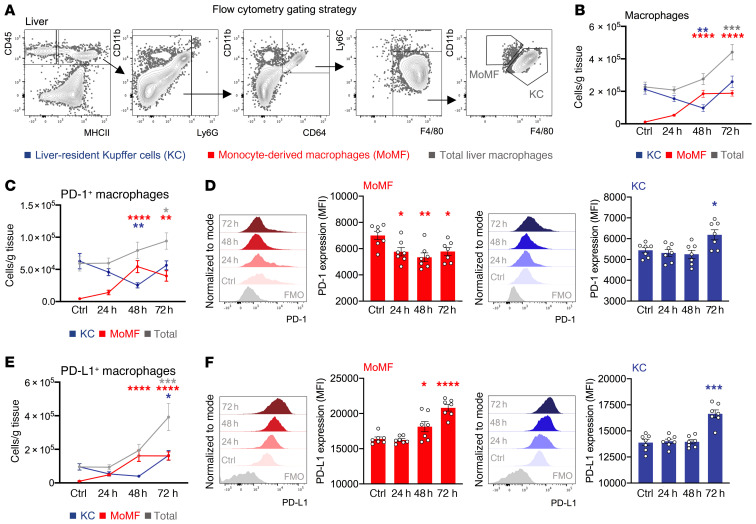
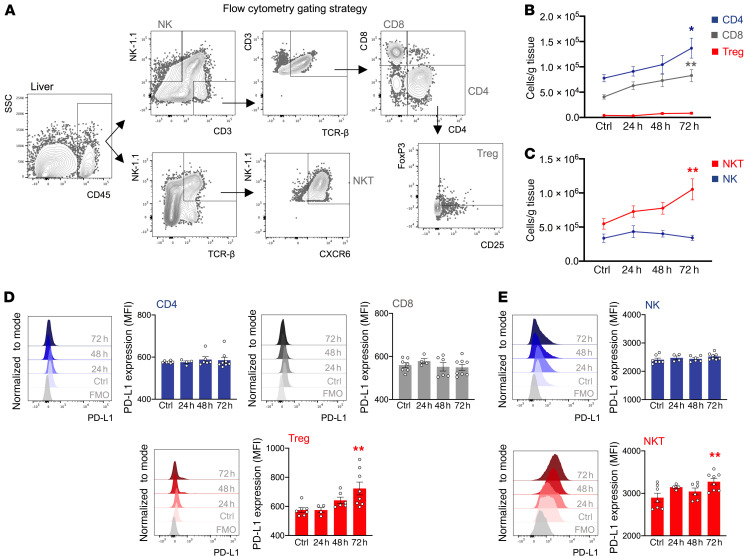
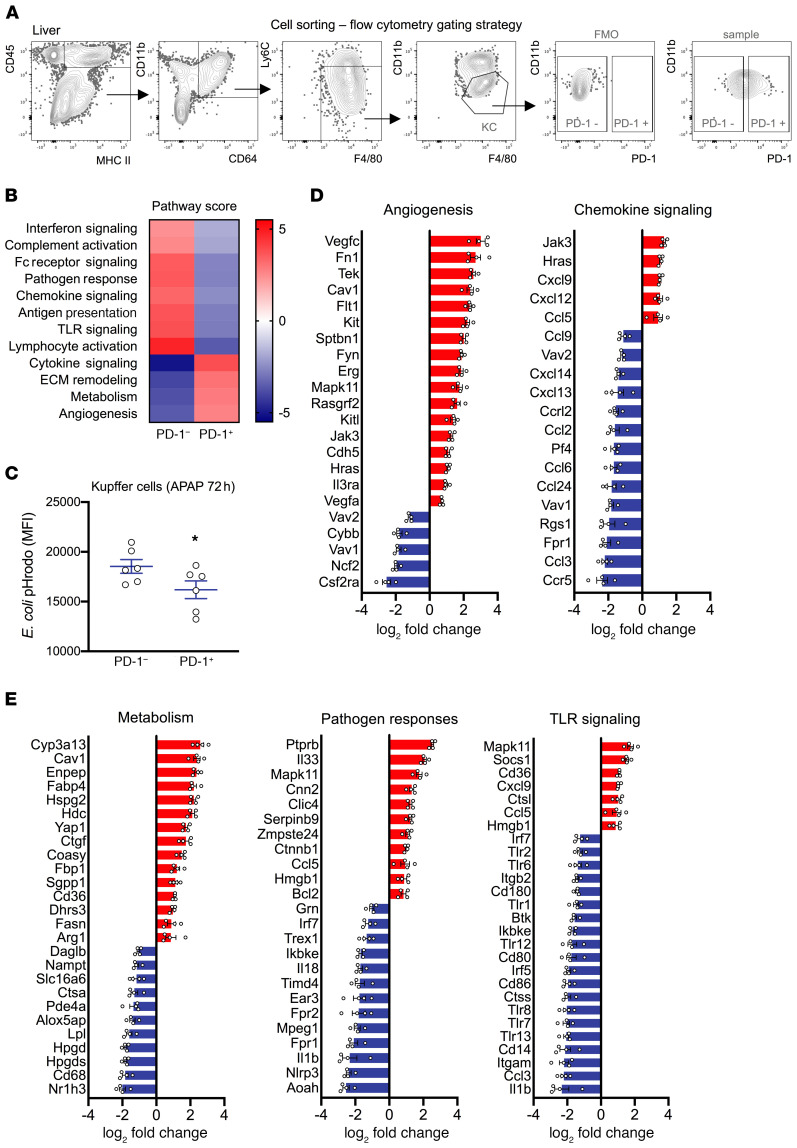
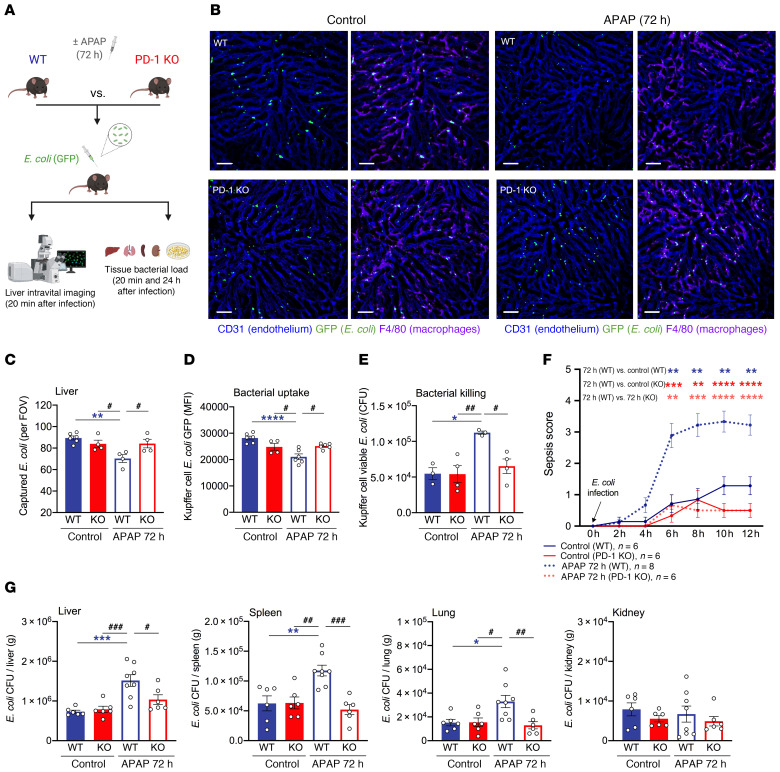
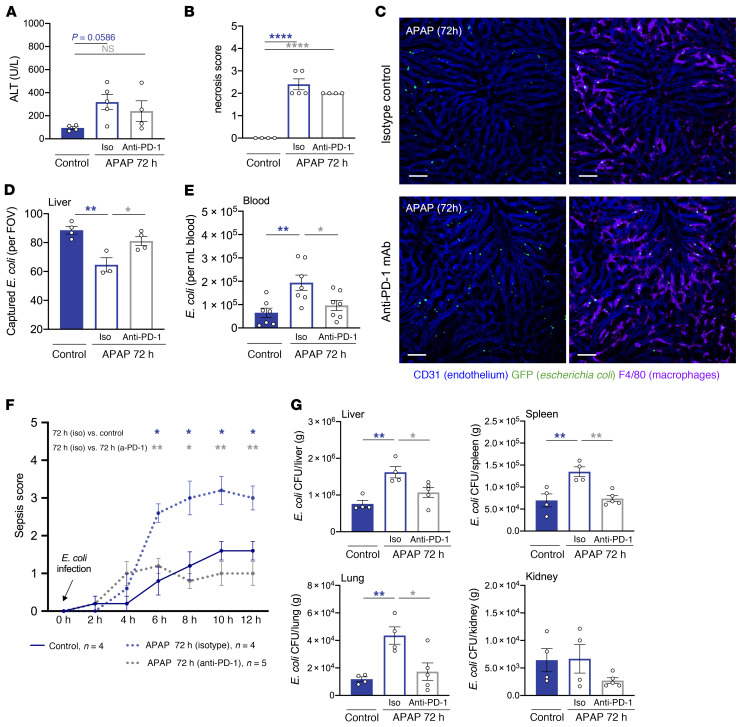
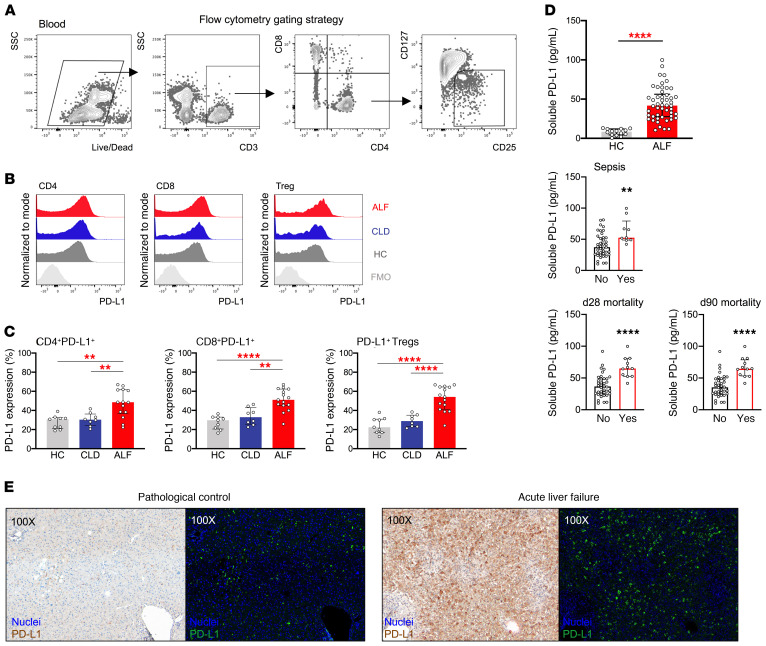
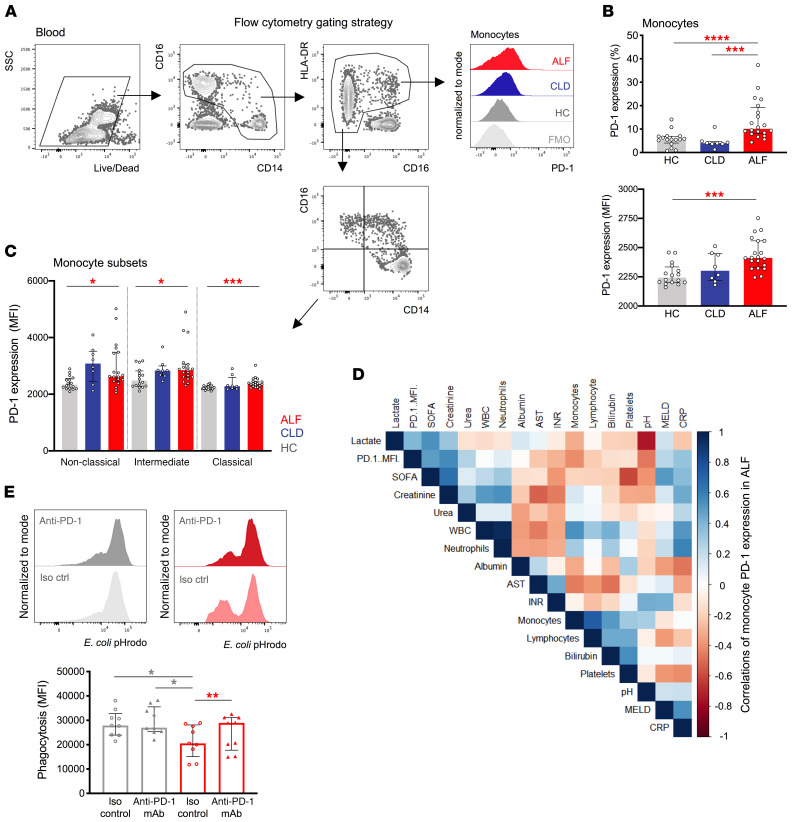
Patients with acute liver failure (ALF) have systemic innate immune suppression and increased susceptibility to infections. Programmed cell death 1 (PD-1) expression by macrophages has been associated with immune suppression during sepsis and cancer. We therefore examined the role of the programmed cell death 1/programmed death ligand 1 (PD-1/PD-L1) pathway in regulating Kupffer cell (KC) inflammatory and antimicrobial responses in acetaminophen-induced (APAP-induced) acute liver injury. Using intravital imaging and flow cytometry, we found impaired KC bacterial clearance and systemic bacterial dissemination in mice with liver injury. We detected increased PD-1 and PD-L1 expression in KCs and lymphocyte subsets, respectively, during injury resolution. Gene expression profiling of PD-1+ KCs revealed an immune-suppressive profile and reduced pathogen responses. Compared with WT mice, PD-1-deficient mice and anti-PD-1-treated mice with liver injury showed improved KC bacterial clearance, a reduced tissue bacterial load, and protection from sepsis. Blood samples from patients with ALF revealed enhanced PD-1 and PD-L1 expression by monocytes and lymphocytes, respectively, and that soluble PD-L1 plasma levels could predict outcomes and sepsis. PD-1 in vitro blockade restored monocyte functionality. Our study describes a role for the PD-1/PD-L1 axis in suppressing KC and monocyte antimicrobial responses after liver injury and identifies anti-PD-1 immunotherapy as a strategy to reduce infection susceptibility in ALF.

Keywords: Hepatology; Immunology; Innate immunity; Macrophages.


Conflict of interest statement

Conflict of interest: The authors have declared that no conflict of interest exists.

Figures

Figure 1
Figure 1. KC bacterial clearance is reduced in mice with acute liver injury.
Baseline (control [ctrl]) and APAP-treated (72 h) mice were intravenously challenged with E. coli. (A) Schematic of experimental E. coli challenge in mice. (B) Representative intravital liver images (20 min after infection). Macrophages and endothelial cells were stained with fluorescently labeled anti-F4/80 (purple) and anti-CD31 (blue) antibodies, respectively; GFP+ E. coli (green). Scale bars: 50 μm. (C) Intravital imaging analysis shows the amount of macrophage-captured E. coli per FOV (n = 5–6 per group). (D) Representative flow plots of KC (blue) E. coli (green) capture measured by flow cytometry. Dot plots show KC numbers and E. coli uptake as measured by flow cytometry (n = 6 per group). (E) Sorted KCs from control and APAP-treated (72 h) mice were in vitro challenged with E. coli (1:100 ratio, 60 min). In vitro bacterial killing of KC-phagocytosed E. coli was evaluated by measuring viable E. coli CFU recovered from KC lysates (n = 4 per group). (F) Representative dot plots and number of free GFP+ E. coli in blood measured by flow cytometry (n = 7 per group). SSC, side scatter. Results are from 3 (BD, and F) and 2 (E) independent experiments. Each symbol represents an individual mouse. Data are presented as the median with the IQR. *P < 0.05 and **P < 0.01, by Mann-Whitney U test.
Figure 2
Figure 2. PD-1 and PD-L1 expression in KCs is increased during the resolution of acute liver injury.
Hepatic nonparenchymal cells were isolated from livers of baseline (control) and APAP-treated (24 h, 48 h, or 72 h) WT mice. Phenotypic characterization of liver CD45+ leukocytes was done by flow cytometry. (A) Representative flow cytometric gating strategy used to identify MoMFs and liver-resident KCs. (B) Number of MoMFs (red), KCs (blue), and total macrophages (gray) (n = 10–12 per group). (C) Number of PD-1+ MoMFs (red), PD-1+ KCs (blue), and PD-1+ total liver macrophages (gray) (n = 7 per group). (D) Representative histograms and data showing PD-1 expression (MFI) by MoMFs and KCs (n = 7 per group). (E) Number of PD-L1+ MoMFs (red), PD-L1+ KCs (blue), and PD-L1+ total liver macrophages (gray) (n = 7 per group). (F) Representative histograms and data showing PD-L1 expression (MFI) of MoMFs and KCs (n = 7 per group). Results are from 3 (B) and 2 (CF) independent experiments. Each symbol represents an individual mouse. Data are presented as the mean ± SEM. *P < 0.05, **P < 0.01, ***P < 0.001, and ****P < 0.0001, by 1-way ANOVA (compared with control). FMO, fluorescence minus one.
Figure 3
Figure 3. PD-L1 expression of lymphocyte subsets is increased during the resolution of acute liver injury.
Hepatic nonparenchymal cells were isolated from livers of baseline (control) and APAP-treated (24 h, 48 h, or 72 h) WT mice. Phenotypic characterization of liver CD45+ leukocytes was done by flow cytometry. (A) Representative flow cytometric gating strategy used to identify CD4+ Τ cells, CD8+ Τ cells, Tregs, NK cells, and NKT cells. (B) Number of CD4+ T cells (blue), CD8+ T cells (gray), and Tregs (red) per gram of tissue (n = 8–12 per group). (C) Number of NK (blue) and NKT (red) cells per gram of tissue (n = 8–12 per group). (D) Representative histograms and data showing PD-L1 expression (MFI) of CD4+ T cells, CD8+ T cells, and Tregs (n = 4–8 per group). (E) Representative histograms and data showing PD-L1 expression (MFI) of NK and NKT cells (n = 4–8 per group). Results are from 3 (B and C) and 2 (D and E) independent experiments. Each symbol represents an individual mouse. Data are presented as the mean ± SEM. *P < 0.05 and **P < 0.01, by 1-way ANOVA (compared with control).
Figure 4
Figure 4. PD-1–expressing KCs exhibit an immune-suppressive profile during the resolution of acute liver injury.
PD-1+ and PD-1 KC subsets were sorted from livers of APAP-treated (72 h) WT mice using flow cytometry (n = 4 each). KC lysates were assessed for mRNA expression using the NanoString nCounter system (Mouse Myeloid Innate Immunity Panel). Data show comparison of PD-1+ with PD-1 cells (baseline). (A) Representative flow cytometric gating strategy used to sort the PD-1+ and PD-1 cell subsets. (B) Pathway scoring of PD-1+ and PD-1 KCs performed using nCounter Advanced Analysis. (C) Phagocytosis (uptake) of E. coli pHrodo was assessed by flow cytometry in PD-1+ and PD-1 KC subsets (APAP, 72 h) (n = 6 per group). *P < 0.05, by Wilcoxon paired test. Results are from 2 independent experiments. (D and E) Data show log2 fold change of normalized linear count data (PD-1+ subset, n = 4) for significantly differentially expressed genes (based on nCounter Advanced Analysis) in various pathways. A Benjamini-Hochberg P value adjustment was applied. Statistical significance was set at P < 0.05 and a 2-fold linear change. Data are presented as the mean ± SEM.
Figure 5
Figure 5. PD-1 deficiency improves KC bacterial clearance and confers protection from sepsis in mice with acute liver injury.
Baseline (control) and APAP-treated (72 h) WT and PD-1–deficient (PD-1 KO) mice were intravenously challenged with E. coli. (A) Schematic of experimental E. coli challenge. (B) Representative intravital liver images (20 min after infection). Macrophages and endothelial cells were stained with fluorescently labeled anti-F4/80 (purple) and anti-CD31 (blue) antibodies, respectively; GFP+ E. coli (green). Scale bars: 50 μm. (C) Intravital liver imaging analysis showing the amount of macrophage-captured E. coli per FOV (n = 4–6 per group). (D) KC E. coli uptake measured by flow cytometry (n = 4–6 per group). (E) Sorted KCs from control or APAP-treated (72 h) WT and PD-1–/– mice were in vitro challenged with E. coli (1:100 ratio, 60 min). In vitro bacterial killing of KC phagocytosed E. coli was evaluated by measuring viable E. coli CFU recovered from KC lysates (n = 3–4 per group). (F) Mouse sepsis scores over time following E. coli infection (n = 6–8 per group). (G) CFU analysis of bacterial burden in the liver, spleen, lungs, and kidneys 24 hours after infection (n = 6–8 per group). Results are from 3 (BD, F, and G) and 2 (E) independent experiments. Each symbol represents an individual mouse. Data are presented as the mean ± SEM. * or #P < 0.05, ** or ##P < 0.01, *** or ###P < 0.001, ****P < 0.0001, by 1-way ANOVA (CE and G) or 2-way, repeated-measures ANOVA (F).
Figure 6
Figure 6. PD-1 blockade improves KC bacterial clearance and confers protection from sepsis in mice with acute liver injury.
Baseline (control) and APAP-treated (72 h) WT mice, dosed with isotype control (iso) or anti–PD-1 mAb 48 hours after APAP treatment, were intravenously challenged with E. coli. (A) Plasma alanine transaminase (ALT) levels (U/L) and (B) hepatic necrosis scores (n = 4–5 per group). (C) Representative intravital liver images from APAP-treated (72 h) mice (20 min after infection). Macrophages and endothelial cells were stained with fluorescently labeled anti-F4/80 (purple) and anti-CD31 (blue) antibodies, respectively; GFP+ E. coli (green). Scale bars: 50 μm. (D) Intravital liver imaging analysis showing the amount of macrophage-captured E. coli per FOV (n = 3–4 per group). (E) Number of free E. coli in blood measured by flow cytometry (n = 7 per group). (F) Mouse sepsis scores over time following E. coli infection (n = 4–5 per group). (G) CFU analysis showing bacterial burden in the liver, spleen, lungs, and kidneys 24 hours after infection (n = 4–5 per group). Results in AG are for 2 independent experiments. Each symbol represents an individual mouse. Data are presented as the mean ± SEM. *P < 0.05, **P < 0.01, and ****P < 0.0001, by 1-way ANOVA (AE and G) or 2-way, repeated-measures ANOVA (F).
Figure 7
Figure 7. Lymphocyte PD-L1 expression and sPD-L1 plasma levels are increased in patients with ALF.
Phenotypic characterization of lymphocytes was performed by flow cytometry in PBMCs from HCs (n = 9) and patients with CLD (n = 8) or ALF (n = 15). (A) Representative flow cytometric gating strategy used to identify CD4+ T cells, CD8+ T cells, and Tregs. (B and C) Representative histograms and data showing PD-L1 expression (percentage) in CD4+ T cells, CD8+ T cells, and Tregs. (D) Dot plots show plasma sPD-L1 levels as determined by ELISA in HCs (n = 8) and patients with ALF (n = 50) and plasma sPD-L1 levels in patients with ALF based on development of sepsis (no: n = 41; yes: n = 9), day-28 mortality (no: n = 38; yes: n = 11), or day-90 mortality (no: n = 36; yes: n = 12). (E) Representative IHC images of PD-L1 staining in pathological control and APAP-induced ALF liver tissues analyzed using Nuance multispectral imaging technology. Left panels: RGB images show nuclei (blue) and PD-L1 (brown) staining. Original magnification, ×100. Right panels: Pseudofluorescence images show nuclei (blue) and PD-L1 (green) staining. Original magnification, ×100. Data are presented as the median with the IQR. **P < 0.01 and ****P < 0.0001, by Mann-Whitney U test.
Figure 8
Figure 8. Monocyte PD-1 expression is increased in patients with ALF.
Phenotypic characterization of monocytes was performed by flow cytometry in PBMCs from HCs (n = 16) and patients with CLD (n = 8) or ALF (n = 20). (A) Representative flow cytometric gating strategy used to identify monocytes and determine their PD-1 expression. Histograms show PD-1 expression in HCs and in patients with CLD or ALF. (B and C) PD-1 expression levels in (B) total monocytes and (C) monocyte subsets (classical, intermediate, and nonclassical). Statistical significance was determined by Mann-Whitney U test. (D) Matrix of correlation of monocyte PD-1 expression (MFI) with clinical scores and biochemical parameters for patients with ALF. INR, international normalized ratio; AST, aspartate aminotransferase; MELD, model for end-stage liver disease; WBC, white blood cell count. (E) PBMCs from HCs and patients with ALF were cultured in the presence of 10% autologous plasma and treated with anti–PD-1 mAb (10 μg/mL) or an isotype-matched control (iso ctrl) (10 μg/mL) prior to E. coli pHrodo phagocytosis assay. Flow cytometric plots and analysis show E. coli pHrodo phagocytosis levels (MFI) in HCs and patients with ALF (n = 9 per group). Results are from 3 independent experiments. Data are presented as the median with the IQR. *P < 0.05, **P < 0.01, ***P < 0.001, and **** P < 0.0001, by Wilcoxon paired test (ALF group) and Mann-Whitney U test (HCs versus patients with ALF).

References

    1. Stravitz RT, Lee WM. Acute liver failure. Lancet. 2019;394(10201):869–881. doi: 10.1016/S0140-6736(19)31894-X. - DOI - PMC - PubMed
    1. Bernal W, et al. Acute liver failure: A curable disease by 2024? J Hepatol. 2015;62(S1):S112–S120. - PubMed
    1. Triantafyllou E, et al. The role of monocytes and macrophages in acute and acute-on-chronic liver failure. Front Immunol. 2018;9:2948. - PMC - PubMed
    1. Antoniades CG, et al. Secretory leukocyte protease inhibitor: a pivotal mediator of anti-inflammatory responses in acetaminophen-induced acute liver failure. Hepatology. 2014;59(4):1564–1576. doi: 10.1002/hep.26933. - DOI - PubMed
    1. Bernsmeier C, et al. Patients with acute-on-chronic liver failure have increased numbers of regulatory immune cells expressing the receptor tyrosine kinase MERTK. Gastroenterology. 2015;148(3):603–615.e14. doi: 10.1053/j.gastro.2014.11.045. - DOI - PubMed

Publication types

MeSH terms