

Scanning single-molecule counting system for Eprobe with highly simple and effective approach
- PMID: 33320908
- PMCID: PMC7737986
- DOI: 10.1371/journal.pone.0243319
Scanning single-molecule counting system for Eprobe with highly simple and effective approach
Abstract
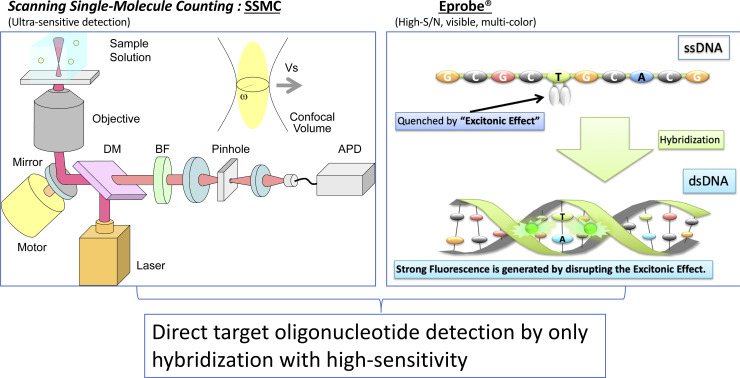
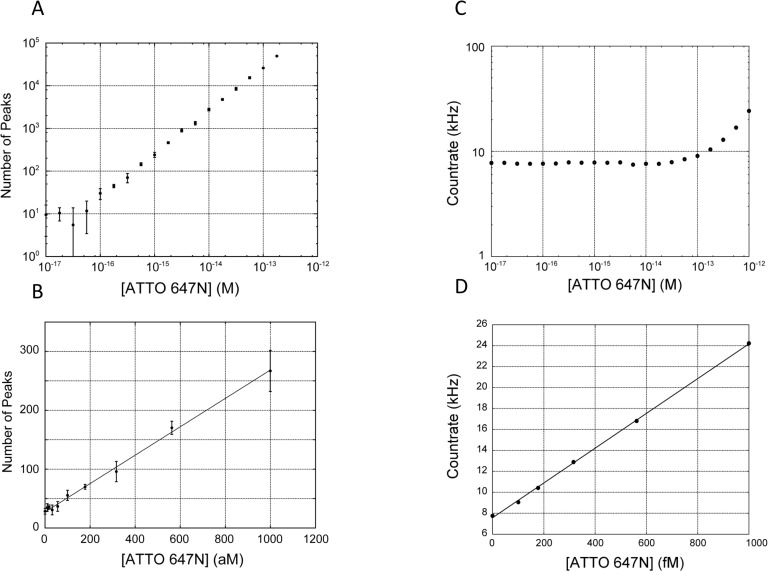
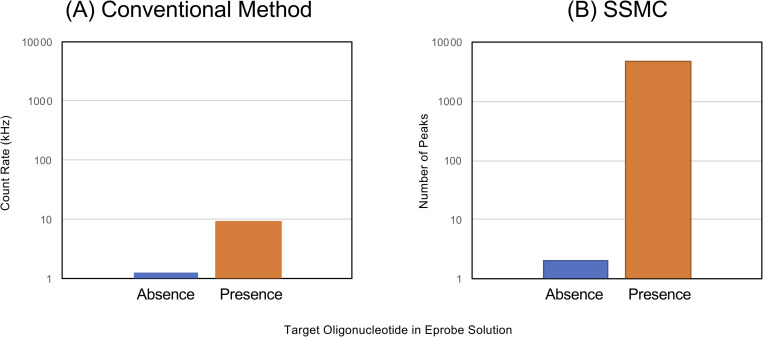
Here, we report a rapid and ultra-sensitive detection technique for fluorescent molecules called scanning single molecular counting (SSMC). The method uses a fluorescence-based digital measurement system to count single molecules in a solution. In this technique, noise is reduced by conforming the signal shape to the intensity distribution of the excitation light via a circular scan of the confocal region. This simple technique allows the fluorescent molecules to freely diffuse into the solution through the confocal region and be counted one by one and does not require statistical analysis. Using this technique, 28 to 62 aM fluorescent dye was detected through measurement for 600 s. Furthermore, we achieved a good signal-to-noise ratio (S/N = 2326) under the condition of 100 pM target nucleic acid by only mixing a hybridization-sensitive fluorescent probe, called Eprobe, into the target oligonucleotide solution. Combination of SSMC and Eprobe provides a simple, rapid, amplification-free, and high-sensitive target nucleic acid detection system. This method is promising for future applications to detect particularly difficult to design primers for amplification as miRNAs and other short oligo nucleotide biomarkers by only hybridization with high sensitivity.
Conflict of interest statement
The authors have read the journal's policy and the authors of this manuscript have the following competing interests: Authors TT, T. Hanashi, MY, HN, and SK are paid employees of Olympus Corporation. Authors YM and YK are paid employees of K.K. DNAFORM, a company holding commercial rights to Eprobe technology. T. Hanami and TS are inventors of Japanese patent applications [JP2012-091400] and [JP2012-158229]. YK is an inventor of Japanese patent application [JP2012-158229]. YH is an inventor of patents [JP2009-171935], [US8067162], [JP2012-091400], [JP2012-158229]. TT, MY and SK are patent inventors for SSMC device [US8710413/JP 5250152]. TT, T. Hanashi, HN are patent inventors for SSMC assay [US9395357 /JP5877155]. The other authors declare no further patents, products in development, or marketed products. This does not alter our adherence to PLOS ONE policies on sharing data and materials.
Figures
Similar articles
-
Direct quantification of single-molecules of microRNA by total internal reflection fluorescence microscopy.Anal Chem. 2010 Aug 15;82(16):6911-8. doi: 10.1021/ac101133x. Anal Chem. 2010. PMID: 20704380
-
Fluorescent Biosensors Based on Single-Molecule Counting.Acc Chem Res. 2016 Sep 20;49(9):1722-30. doi: 10.1021/acs.accounts.6b00237. Epub 2016 Sep 1. Acc Chem Res. 2016. PMID: 27583695 Review.
-
Eprobe mediated real-time PCR monitoring and melting curve analysis.PLoS One. 2013 Aug 7;8(8):e70942. doi: 10.1371/journal.pone.0070942. eCollection 2013. PLoS One. 2013. PMID: 23951046 Free PMC article.
-
Ultrasensitive detection of microRNAs based on hairpin fluorescence probe assisted isothermal amplification.Biosens Bioelectron. 2014 Aug 15;58:57-60. doi: 10.1016/j.bios.2014.02.034. Epub 2014 Feb 22. Biosens Bioelectron. 2014. PMID: 24613970
-
ECHO probes: a concept of fluorescence control for practical nucleic acid sensing.Chem Soc Rev. 2011 Dec;40(12):5815-28. doi: 10.1039/c1cs15025a. Epub 2011 Jun 10. Chem Soc Rev. 2011. PMID: 21660343 Review.
Cited by
-
A handheld luminometer with sub-attomole limit of detection for distributed applications in global health.PLOS Glob Public Health. 2024 Feb 21;4(2):e0002766. doi: 10.1371/journal.pgph.0002766. eCollection 2024. PLOS Glob Public Health. 2024. PMID: 38381748 Free PMC article.
-
Development of a Highly Sensitive β-Glucan Detection System Using Scanning Single-Molecule Counting Method.Int J Mol Sci. 2021 Jun 1;22(11):5977. doi: 10.3390/ijms22115977. Int J Mol Sci. 2021. PMID: 34205910 Free PMC article.
References
-
- Wabuyele MB, Farquar H, Stryjewski W, Hammer RP, Soper SA, Cheng Y-W, et al. Approaching real-time molecular diagnostics: single-pair fluorescence resonance energy transfer (spFRET) detection for the analysis of low abundant point mutations in K-ras oncogenes. J Am Chem Soc. 2003;125: 6937–6945. 10.1021/ja034716g - DOI - PubMed
-
- Baker M. Digital PCR hits its stride. Nat Methods. 2012;9: 541.
Publication types
MeSH terms
Substances
LinkOut - more resources
Full Text Sources
