. 2021 Apr 6;33(4):804-817.e5.
doi: 10.1016/j.cmet.2020.11.020. Epub 2020 Dec 14.

Reductive TCA cycle metabolism fuels glutamine- and glucose-stimulated insulin secretion

Affiliations

Reductive TCA cycle metabolism fuels glutamine- and glucose-stimulated insulin secretion

Guo-Fang Zhang et al. Cell Metab. .

Abstract

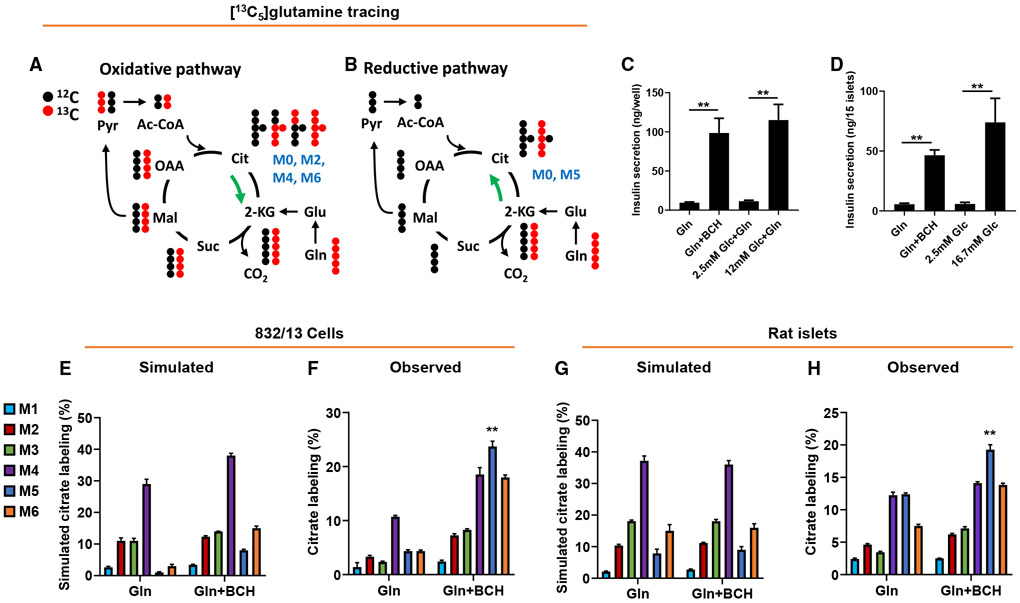
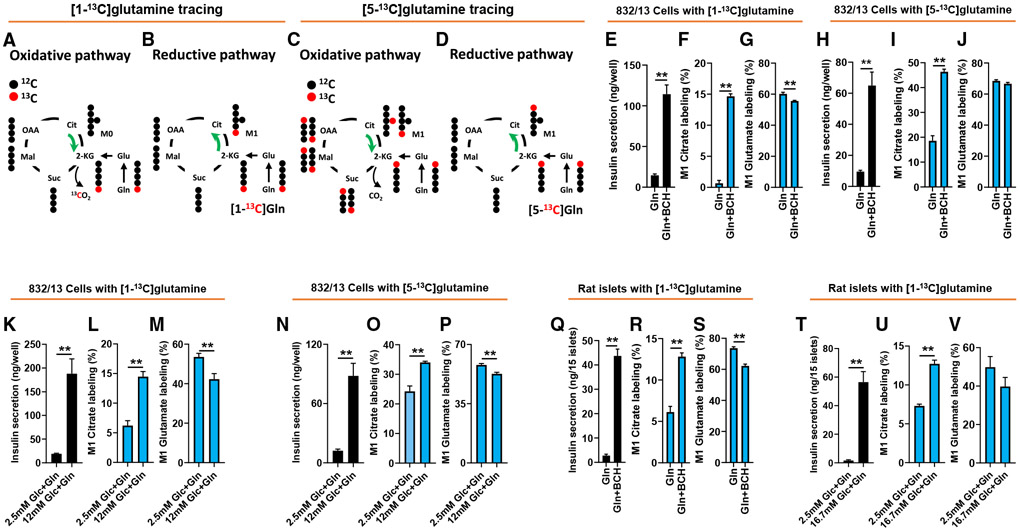
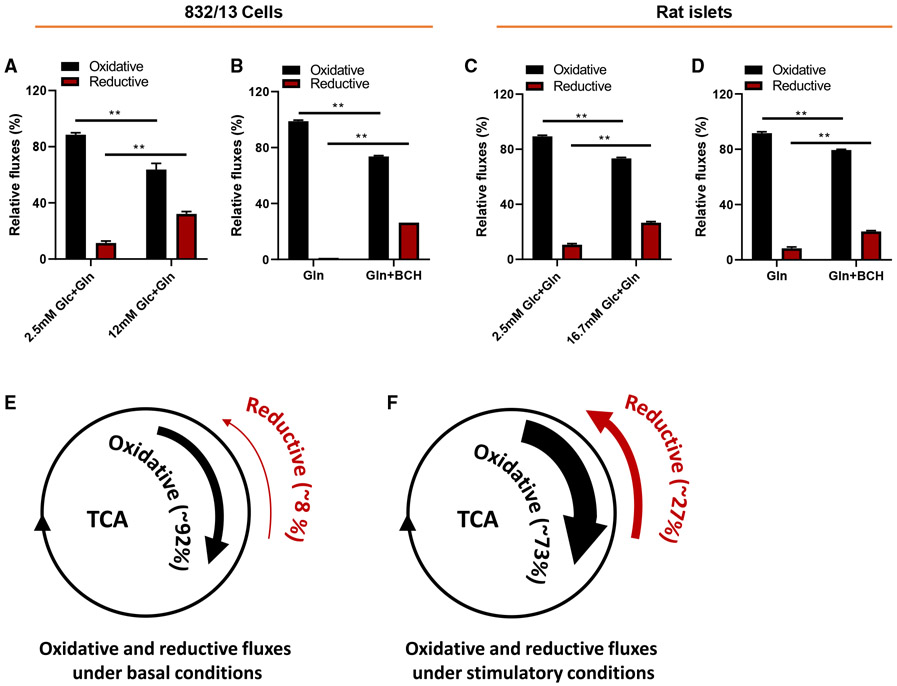
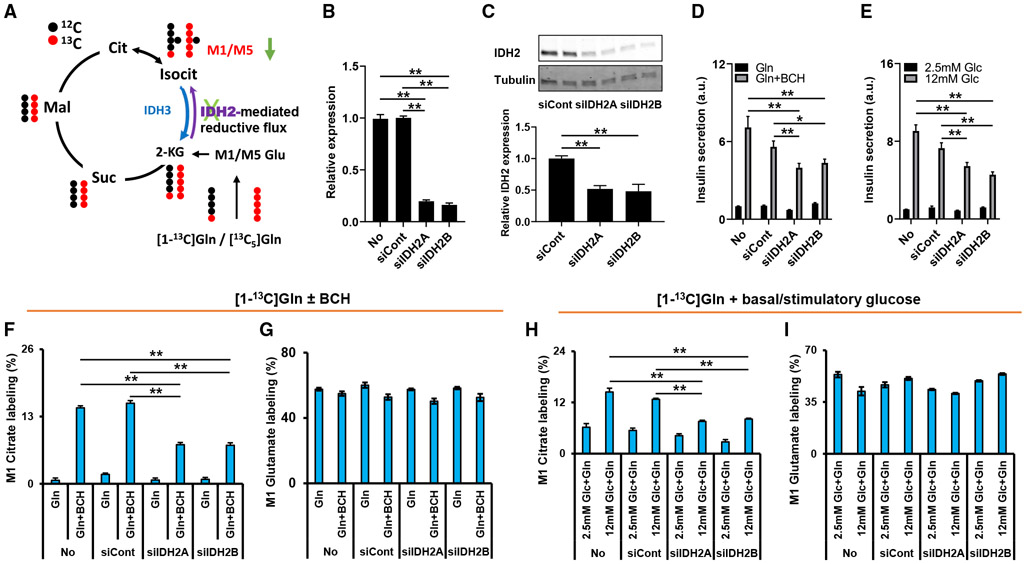
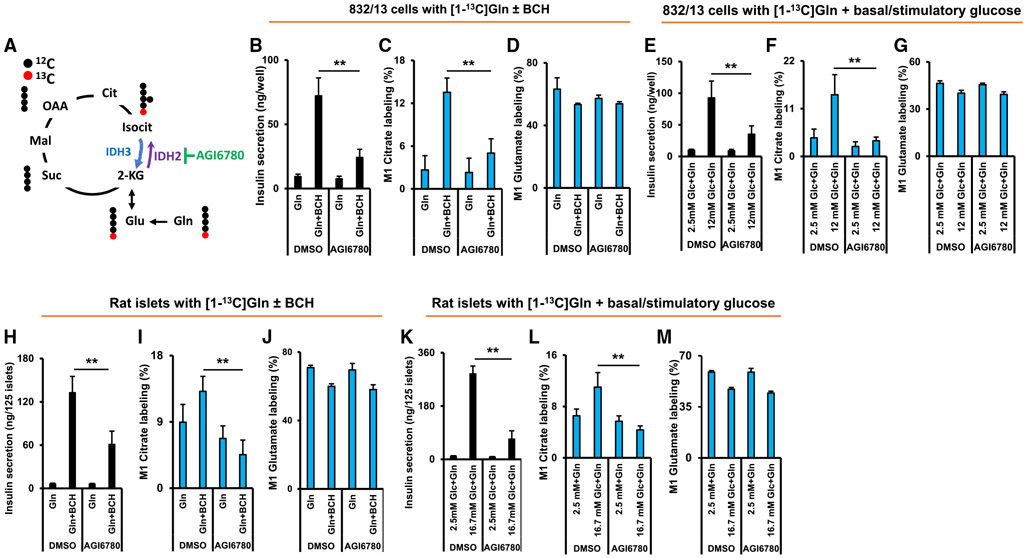
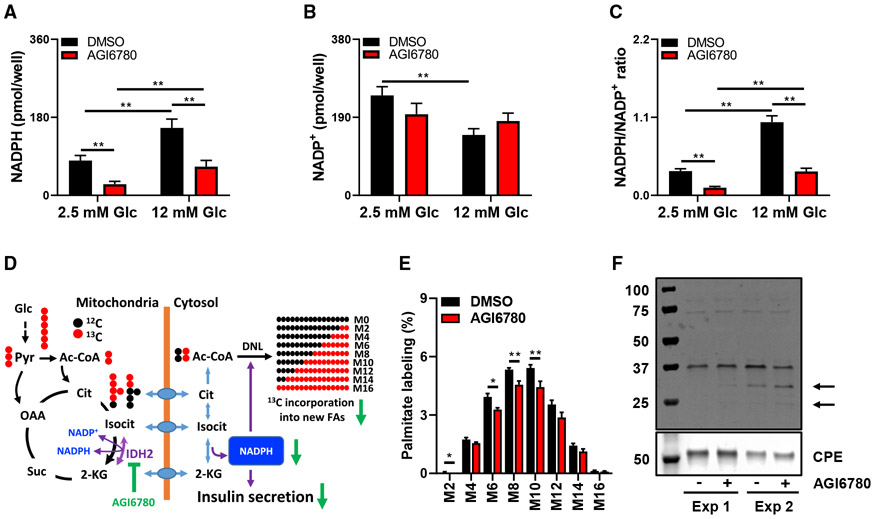
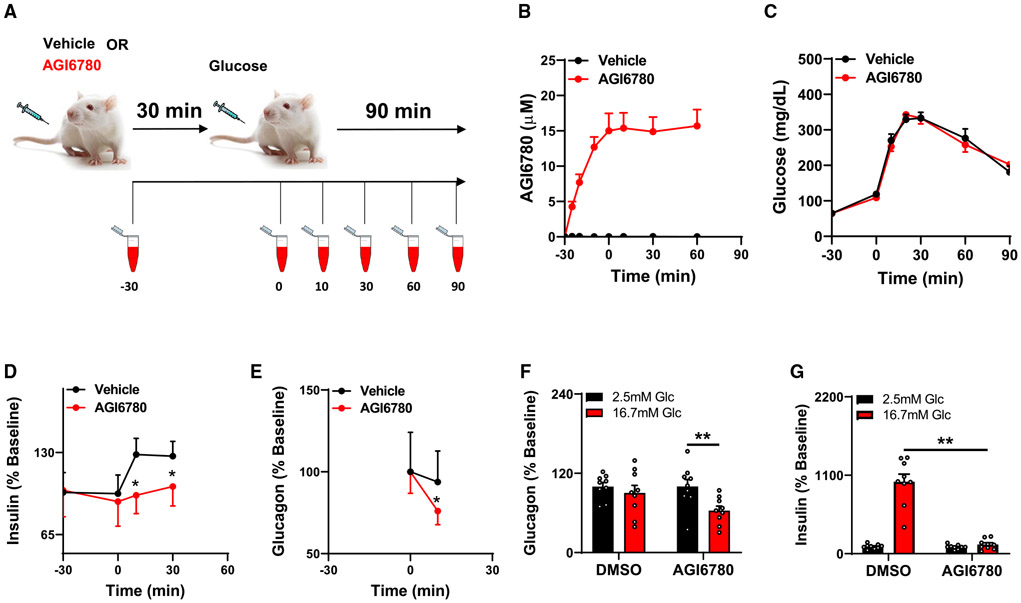
Metabolic fuels regulate insulin secretion by generating second messengers that drive insulin granule exocytosis, but the biochemical pathways involved are incompletely understood. Here we demonstrate that stimulation of rat insulinoma cells or primary rat islets with glucose or glutamine + 2-aminobicyclo-(2,2,1)-heptane-2-carboxylic acid (Gln + BCH) induces reductive, "counter-clockwise" tricarboxylic acid (TCA) cycle flux of glutamine to citrate. Molecular or pharmacologic suppression of isocitrate dehydrogenase-2 (IDH2), which catalyzes reductive carboxylation of 2-ketoglutarate to isocitrate, results in impairment of glucose- and Gln + BCH-stimulated reductive TCA cycle flux, lowering of NADPH levels, and inhibition of insulin secretion. Pharmacologic suppression of IDH2 also inhibits insulin secretion in living mice. Reductive TCA cycle flux has been proposed as a mechanism for generation of biomass in cancer cells. Here we demonstrate that reductive TCA cycle flux also produces stimulus-secretion coupling factors that regulate insulin secretion, including in non-dividing cells.

Keywords: NADPH; anaplerosis; insulin secretion; isocitrate dehydrogenase-2; metabolic flux; pancreatic islet β cells; reductive TCA cycle; stable isotopes.


Conflict of interest statement

Declaration of interests The authors declare no conflicts of interest in conduct of this research. C.B.N. is a paid consultant for Eli Lilly, Axcella Health, Boehringer Ingelheim, and Sigilon. Whereas all of these companies have interests in diabetes therapy, they have no involvement or competing interests in the research described in this paper.

Figures

Figure 1.
Figure 1.. Metabolism of [13C5]Gln by the reductive (counter-clockwise) TCA cycle pathway in 832/13 cells and primary rat islets
832/13 cells or primary rat islets were incubated for 2 h in secretion buffer in the presence of 5 mM [13C5]Gln ± BCH prior to insulin secretion and GC-MS analyses. (A and B) Conceptual scheme of the metabolic fate of [13C5]Gln metabolized via oxidative TCA cycle (A; clockwise) or reductive TCA cycle (B; counter-clockwise) pathways. Only the first cycle is shown for clarity. (C and D) Insulin secretion from 832/13 cells (C) and rat islets (D) in response to Gln + BCH or stimulatory glucose (12 mM for 832/13 cells, 16.7 mM for primary islets). (E and G) Simulated citrate isotopologue labeling from [13C5]Gln in 832/13 cells (E) or rat islets (G), based on measured labeling of pyruvate and malate (Figure S1), and assuming oxidative (clockwise) metabolism only. (F and H) Measured citrate isotopologue labeling in 832/13 cells (F) or rat islets (H), treated with 5 mM [13C5]Gln ± BCH. Data represent three independent aliquots of 832/13 cells and two independent islet aliquots, assayed in triplicate (cells) or duplicate (islets). ** denotes that the M5 isotopologue of citrate (blue bar) is the only one that fulfills the dual criteria of being significantly increased in the observed versus simulated data comparison, as well as being significantly increased in the presence relative to the absence of BCH, in both 832/13 cells and rat islets, with p < 0.01 for both comparisons in each cellular setting.
Figure 2.
Figure 2.. Confirmation of reductive pathway activity in 832/13 cells and islets using [1-13C] and [5-13C]Gln
832/13 cells or primary rat islets were incubated for 2 h in secretion buffer containing [1-13C]Gln or [5-13C]Gln prior to insulin secretion and GC-MS analyses. (A and B) Conceptual scheme of the metabolic fate of [1-13C]Gln metabolized via oxidative TCA cycle (A; clockwise) or reductive TCA cycle (B; counter-clockwise) pathways. (C and D) Conceptual scheme of the metabolic fate of [5-13C]Gln metabolized via oxidative TCA cycle (C; clockwise) or reductive TCA cycle (D; counter-clockwise) pathways. (E–V) 832/13 cells or primary rat islets were stimulated with 5 mM [1-13C]Gln ± BCH (E–G, 832/13; Q–S, islets) or 5 mM [5-13C]Gln ± BCH (H–J, 832/13 cells) for 2 h prior to tracer analyses. Insulin secretion (E, H, and Q), labeling of M1 citrate (F, I, and R), and labeling of M1 glutamate (G, J, and S). 832/13 cells or primary rat islets were stimulated with basal and stimulatory glucose for 2 h in the presence of 2 mM [1-13C]Gln (K–M, 832/13 cells; T–V, islets) or 2 mM [5-13C]Gln (N–P, 832/13 cells), and subjected to GC-MS-mediated mass isotopomer analyses. Insulin secretion (K, N, and T), labeling of M1 citrate (L, O, and U), and labeling of M1 glutamate (M, P, and V). Data represent three independent cell or islet aliquots each assayed in duplicate (islets) ortriplicate (832/13). “p < 0.01, significant differences between indicated groups. Related supplemental data shown in Figure S2.
Figure 3.
Figure 3.. Fuel stimulation of β cells increases reductive relative to oxidative TCA cycle flux
(A–D) Relative oxidative (black bars) and reductive (red bars) TCA cycle flux in 832/13 cells (A and B) or primary rat islets (C and D), exposed to [1-13C]Gln at low or stimulatory glucose levels (A and C) or [1-13C]Gln ± BCH (B and D). (E and F) Conceptual rendering of changes in oxidative and reductive fluxes under basal and stimulatory conditions based on all [1-13C ]Gln experiments conducted with 832/13 cells and rat islets. Reductive flux was calculated as fractional 13C labeling of M1 citrate divided by fractional 13C labeling of M1 glutamate × 100, and oxidative flux was calculated as 100-reductive flux, assuming that all unlabeled glutamate is used in the oxidative pathway. Data represent mean ± SEM; **p < 0.01.
Figure 4.
Figure 4.. siRNA-mediated suppression of IDH2 attenuates reductive metabolism of Gln and impairs glucose- and Gln + BCH-stimulated insulin secretion
832/13 cells were mock transfected (No) or transfected with either a control siRNA (siCont) or one of two siRNA duplexes targeting IDH2 (siIDH2A and siIDH2B) 72 h prior to analyses. (A) Proposed role of IDH2 in reductive metabolism of Gln to isocitrate and citrate. (B and C) qPCR (B) and immunoblot (C) analyses of IDH2 mRNA and protein levels, respectively. (D and E) siIDH2-mediated effects on Gln + BCH- (D) and glucose- (E) stimulated insulin secretion. Secretion data are expressed as fold change relative to basal secretion from mock-transfected cells (No) set to 1.0. (F and G) M1 citrate (F) and M1 glutamate (G) labeling in response to 5 mM [1-13C]Gln ± BCH treatment (2 h) in siIDH2-treated compared to siCont-treated or mock-transfected cells. (H and I) M1 citrate (H) and M1 glutamate (I) labeling after 2 h treatment with low and high glucose in the presence of 2 mM [1-13C]Gln. Data represent at least three independent cell or islet aliquots, each assayed in triplicate. Significant differences between indicated groups, *p < 0.05 and **p < 0.01.
Figure 5.
Figure 5.. The IDH2 inhibitor AGI6780 suppresses insulin secretion and reductive flux in 832/13 cells and primary rat islets
(A) Site of action of the IDH2 inhibitor AGI6780 to inhibit reductive metabolism of Gln. 832/13 cells were treated with AGI6780 for a total of 3.5 h. (B–D) Effect of AGI6780 on Gln + BCH-stimulated insulin secretion (B), labeling of M1 citrate by [1-13C]Gln (C), and labeling of M1 glutamate by [1-13C]Gln (D) in 832/13 cells. (E–G) Effect of AGI6780 on glucose-stimulated insulin secretion (E), labeling of M1 citrate by [1-13C]Gln during glucose stimulation (F), and labeling of M1 glutamate by [1-13C]Gln during glucose stimulation (G) in 832/13 cells. (H–J) Islets were treated with the IDH2 inhibitor AGI6780 for a total of 3 h prior to measurement of reductive pathway flux and insulin secretion. Effect of AGI6780 on Gln + BCH-stimulated insulin secretion (H), labeling of M1 citrate by [1-13C]Gln (I), and labeling of M1 glutamate by [1-13C]Gln (J) in rat islets. (K–M) Effect of AGI6780 on glucose-stimulated insulin secretion (K), labeling of M1 citrate by [1-13C]Gln during glucose stimulation (L), and labeling of M1 glutamate by [1-13C]Gln during glucose stimulation (M) in rat islets. Significant differences between indicated groups, **p < 0.01.
Figure 6.
Figure 6.. Effect of IDH2 inhibition on NADPH production, de novo lipogenesis, and protein SUMOylation
(A–C) Effect of the IDH2 inhibitor AGI6780 on NADPH (A), NADP (B), and NADPH:NADP ratio (C) at basal and stimulatory glucose in 832/13 cells. (D) Simplified labeling patterns obtained during de novo synthesis of palmitate from [13C6]glucose. (E) Palmitate isotopologues measured after 24 h of incubation of 832/13 cells with 12 mM [13C6]glucose ± AGI6780. (F) Secretory granule-enriched subcellular fractions were prepared from 832/13 cells following 90 min of preincubation with 10 μM AGI6780 or vehicle, followed by 2 h of stimulation with Gln + BCH in the presence (+) or absence (−) of AGI6780. Samples were resolved on an SDS gel and probed with an antibody for SUMO1. Significant differences between indicated groups, *p < 0.05 and **p < 0.01.
Figure 7.
Figure 7.. Acute inhibition of IDH2 with AGI6780 in living mice impairs insulin and glucagon secretion
(A) Schematic summary of in vivo experiment. Mice were injected with AGI6780 or DMSO (vehicle) as a control at time 30 min before (−30) injection of an i.p. glucose bolus. (B–E) Blood samples were taken at the times indicated for measurement of circulating AGI6780 levels (B), blood glucose (C), circulating insulin (D; expressed as percent change relative to levels at −30), and glucagon (E; expressed as percent change relative to time 0). Data represent the mean ± SEM for ≥ 14 mice per group. *p < 0.02, significant increases in insulin secretion in the DMSO control group, but not the AGI6780-treated group, in response to the glucose bolus, and a significant decrease in glucagon secretion in the AGI6780-treated group, but not the DMSO control group. (F and G) Batches of 25 rat islets were pretreated with 10 μM AGI6780 for 1 h followed by glucose stimulation in the presence of AGI6780 for 1 h. Media samples were collected and used for glucagon (F) and insulin (G) assays. **p < 0.01, significant differences between indicated groups.

Comment in

References

    1. Alves TC, Pongratz RL, Zhao X, Yarborough O, Sereda S, Shirihai O, Cline GW, Mason G, and Kibbey RG (2015). Integrated, step-wise, mass-isotopomeric flux analysis of the TCA cycle. Cell Metab. 22, 936–947. - PMC - PubMed
    1. Ashcroft FM, Harrison DE, and Ashcroft SJ (1984). Glucose induces closure of single potassium channels in isolated rat pancreatic beta-cells. Nature 312, 446–448. - PubMed
    1. Attané C, Peyot ML, Lussier R, Zhang D, Joly E, Madiraju SR, and Prentki M (2016). Differential insulin secretion of high-fat diet-fed C57BL/6NN and C57BL/6NJ mice: implications of mixed genetic background in metabolic studies. PLoS One 11, e0159165. - PMC - PubMed
    1. Cook DL, and Hales CN (1984). Intracellular ATP directly blocks K+ channels in pancreatic B-cells. Nature 311, 271–273. - PubMed
    1. Dai XQ, Plummer G, Casimir M, Kang Y, Hajmrle C, Gaisano HY, Manning Fox JE, and MacDonald PE (2011). SUMOylation regulates insulin exocytosis downstream of secretory granule docking in rodents and humans. Diabetes 60, 838–847. - PMC - PubMed

Publication types

MeSH terms