. 2020 Dec 10;9(12):2651.
doi: 10.3390/cells9122651.

Involvement of Bradykinin Receptor 2 in Nerve Growth Factor Neuroprotective Activity

Affiliations

Involvement of Bradykinin Receptor 2 in Nerve Growth Factor Neuroprotective Activity

Carla Petrella et al. Cells. .

Abstract

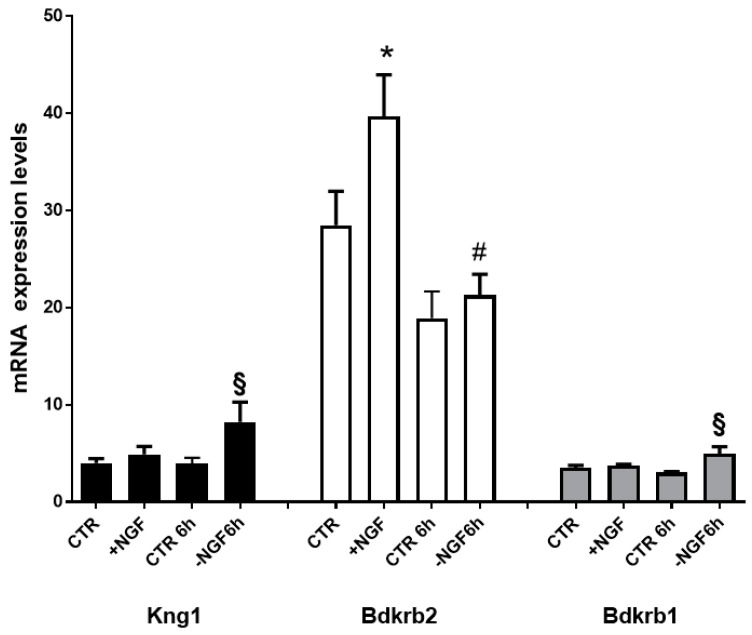
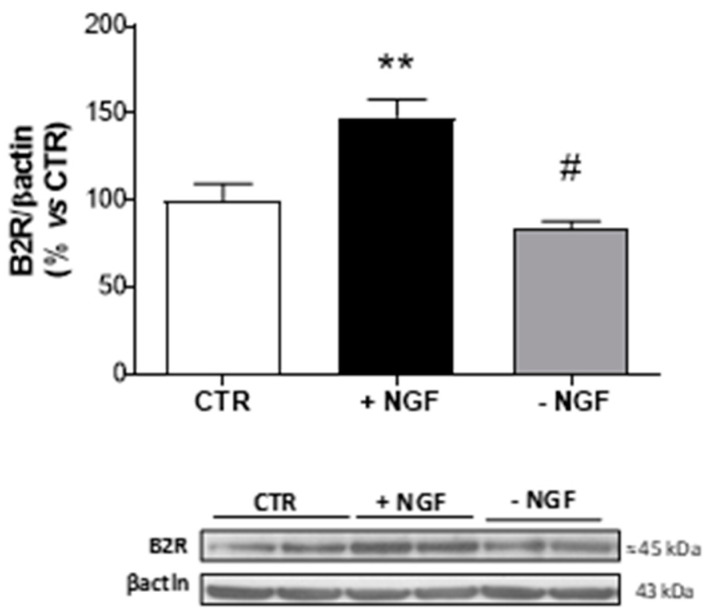
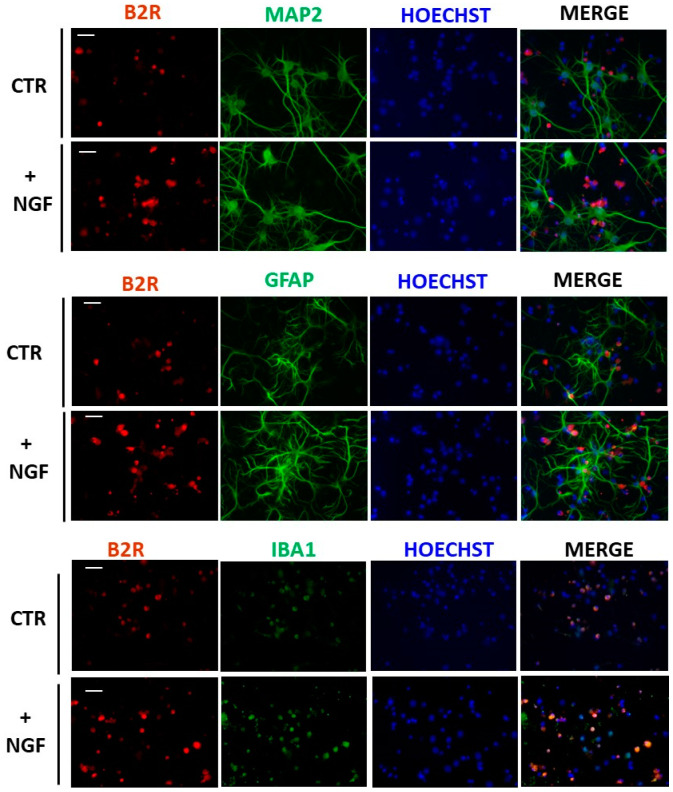
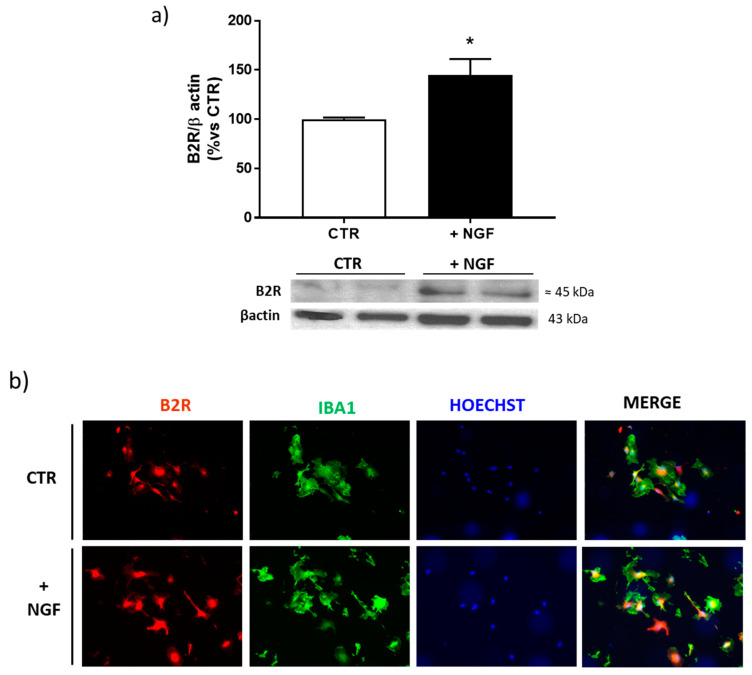
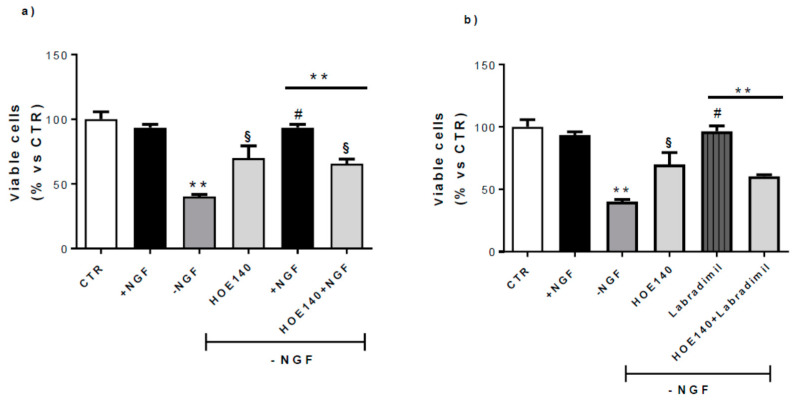
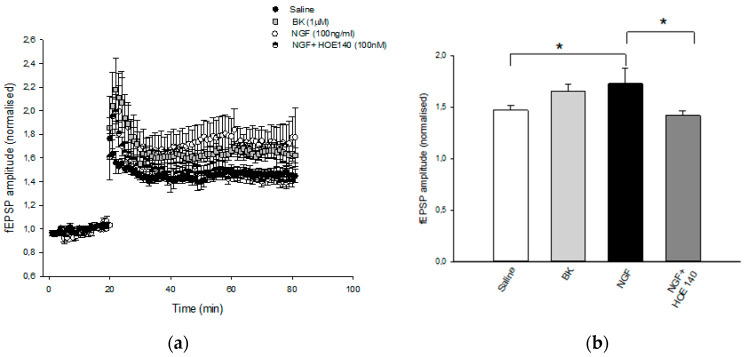
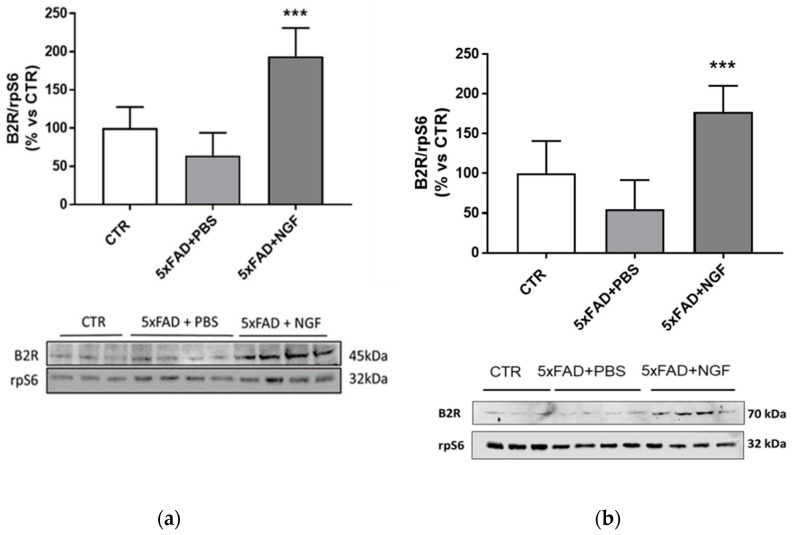
Neurotrophin nerve growth factor (NGF) has been demonstrated to upregulate the gene expression of bradykinin receptor 2 (B2R) on sensory neurons, thus facilitating nociceptive signals. The aim of the present study is to investigate the involvement of B2R in the NGF mechanism of action in nonsensory neurons in vitro by using rat mixed cortical primary cultures (CNs) and mouse hippocampal slices, and in vivo in Alzheimer's disease (AD) transgenic mice (5xFAD) chronically treated with NGF. A significant NGF-mediated upregulation of B2R was demonstrated by microarray, Western blot, and immunofluorescence analysis in CNs, indicating microglial cells as the target of this modulation. The B2R involvement in the NGF mechanism of action was also demonstrated by using a selective B2R antagonist which was able to reverse the neuroprotective effect of NGF in CNs, as revealed by viability assay, and the NGF-induced long-term potentiation (LTP) in hippocampal slices. To confirm in vitro observations, B2R upregulation was observed in 5xFAD mouse brain following chronic intranasal NGF treatment. This study demonstrates for the first time that B2R is a key element in the neuroprotective activity and synaptic plasticity mediated by NGF in brain cells.

Keywords: Alzheimer’s disease animal models; LTP; bradykinin receptor 2 (B2R); microglial cells; nerve growth factor (NGF).


Conflict of interest statement

The authors declare no conflict of interest.

Figures

Figure 1
Figure 1
mRNA expression profiles of BK and its receptors genes after NGF treatment, deprivation, and rescue. Transcript levels of genes encoding BK (Kng1; NM_012696), Bradykinin receptor 2 (Bdkrb2; NM_001270713), and Bradykinin receptor 1 (Bdkrb1; NM_030851) in cortical neurons (CNs) following 48 h NGF treatment (+NGF), induction of apoptosis by 6 h NGF deprivation (−NGF 6 h), and rescue by 6 h NGF replacement (+NGF 6 h). Data represent means (±S.E.M.) from four replicates. Statistically significant differences were calculated by one-way analysis of variance (ANOVA) followed by Bonferroni’s test for multiple comparison (* p < 0.001 vs CTR; § p < 0.05 vs CTR 6 h; # p < 0.05 vs. +NGF replacement (+NGF).
Figure 2
Figure 2
Expression of B2R after NGF treatment and deprivation in CNs. At 10 DIV, CNs cultured in Neurobasal + 1% B27 (CTR) were treated for 48 h with NGF (100 ng/mL, +NGF) before being deprived of NGF by anti-NGF antibody treatment and incubated for 24 h (−NGF). B2R protein expression was measured by Western blot analysis. The immunoreactive signals at 45 kDa were quantified and normalized against β-actin and expressed as a percentage of the control (CTR). Data represent means (±S.E.M.) from four independent experiments run in duplicate. Statistically significant differences were calculated by one-way analysis of variance (ANOVA) followed by Bonferroni’s test for multiple comparisons (** p < 0.01 versus CTR; # p < 0.01 versus NGF treatment).
Figure 3
Figure 3
Expression of B2R in mixed cortical cultures. Representative immunofluorescence images of cultured CNs stained with antibodies for B2R (red), neurons (MAP2, green), astrocytes (GFAP, green), or microglial cells (Iba1, green) and nuclei (Hoechts, blue) in control conditions (CTR) and after NGF treatment (+NGF). B2R immunoreactivity significantly increased in microglial cell body after NGF treatment. Scale bar: 15 µm.
Figure 4
Figure 4
Expression of bradykinin receptor 2 (B2R) after NGF treatment in cortical microglial cells. (a) Western blot analysis of B2R protein expression in enriched microglial cells cultures treated for 48 h with NGF 100 ng/mL (+NGF), normalized against β-actin, and expressed as a percentage of the control (CTR). Data represent means (±S.E.M.) from four independent experiments run in duplicate. Statistically significant differences were calculated by one-way analysis of variance (ANOVA) followed by Bonferroni’s test for multiple comparisons (* p < 0.05). (b) Representative immunofluorescence images of microglial cells stained with antibodies for B2R (red) or microglia (Iba1, green) and nuclei (Hoechts, blue) in control conditions (CTR) and after NGF treatment (+NGF). Scale bar: 15 µm.
Figure 5
Figure 5
Effect of B2R antagonism on CN viability. At 10 DIV, CNs cultured in Neurobasal + 1% B27 (CTR) were treated for 48 h with NGF 100 ng/mL (+NGF) and afterwards deprived of NGF for 24 h by washing (−NGF) or rescued by 24 h NGF replacement (+NGF). Neuronal viability was determined by counting intact nuclei and expressed considering 100 as the number of viable neurons in CTR conditions. (a) Treatment with HOE140 (1 µM), a selective B2R antagonist, induced a considerable inhibitory effect on the neuroprotection promoted by NGF replacement (HOE140 +NGF). (b) In the same conditions, HOE140 significantly antagonized the neuroprotective activity exerted by RPM-7, a selective B2R agonist (RPM-7 (100 nM). Data represent means (±S.E.M.) from four duplicate experiments. Statistically significant differences were calculated by one-way analysis of variance (ANOVA) followed by Bonferroni’s test (** p < 0.01 versus +NGF; # p < 0.01 versus −NGF; § p < 0.01 versus −NGF).
Figure 6
Figure 6
Effect of NGF LTP at CA1 hippocampal synapses. (a) Superimposed pooled data showing the normalized changes in field potential amplitude (±SEM) induced by HFS (100 Hz, 1 s). LTP is enhanced following BK (1μm) and NGF (100 ng/mL) treatment, and the latter effect is reversed by HOE140 (100 nM) application. At least eight slices from four mice were used for each group tested. (b) Histograms show the relative increase in the fEPSP amplitude measured 50–60 min post-HFS under the different pharmacological conditions (* p < 0.05).
Figure 7
Figure 7
Overexpression of B2R by NGF treatment in 5xFAD brain extracts. Western blot analysis of B2R protein expression (panel (a) bands at 45 kDa; panel (b) bands at 70kDa) in brain extracts from wild type mice (CTR) and 5xFAD mice intranasally treated with PBS or NGF normalized against rpS6 and expressed as a percentage of the control (CTR). Data represent means (±S.E.M.) from four independent samples. Statistically significant differences were calculated by one-way analysis of variance (ANOVA) followed by Bonferroni’s test for multiple comparisons. (*** p < 0.001).

References

    1. Levi-Montalcini R. The nerve growth factor 35 years later. Science. 1987;237:1154–1162. doi: 10.1126/science.3306916. - DOI - PubMed
    1. Delcroix J.D., Valletta J., Wu C., Howe C.L., Lai C.F., Cooper J.D., Belichenko P.V., Salehi A., Mobley W.C. Trafficking the NGF signal: Implications for normal and degenerating neurons. Prog. Brain Res. 2004;146:3–23. doi: 10.1016/s0079-6123(03)46001-9. - DOI - PubMed
    1. Mufson E.J., Counts S.E., Perez S.E., Ginsberg S.D. Cholinergic system during the progression of Alzheimer’s disease: Therapeutic implications. Expert Rev. Neurother. 2008;8:1703–1718. doi: 10.1586/14737175.8.11.1703. - DOI - PMC - PubMed
    1. Tuszynski M.H., Thal L., Pay M., Salmon D.P., Bakay R., Patel P., Blesch A., Vahlsing H.L., Ho G., Tong G., et al. A phase 1 clinical trial of nerve growth factor gene therapy for Alzheimer disease. Nat. Med. 2005;11:551–555. doi: 10.1038/nm1239. - DOI - PubMed
    1. Chao M.V., Rajagopal R., Lee F.S. Neurotrophin signalling in health and disease. Clin. Sci. 2006;110:167–173. doi: 10.1042/CS20050163. - DOI - PubMed

Publication types

MeSH terms