. 2020 Dec 13;21(24):9483.
doi: 10.3390/ijms21249483.

Experimental Pulmonary Tuberculosis in the Absence of Detectable Brain Infection Induces Neuroinflammation and Behavioural Abnormalities in Male BALB/c Mice

Affiliations

Experimental Pulmonary Tuberculosis in the Absence of Detectable Brain Infection Induces Neuroinflammation and Behavioural Abnormalities in Male BALB/c Mice

Jacqueline V Lara-Espinosa et al. Int J Mol Sci. .

Abstract

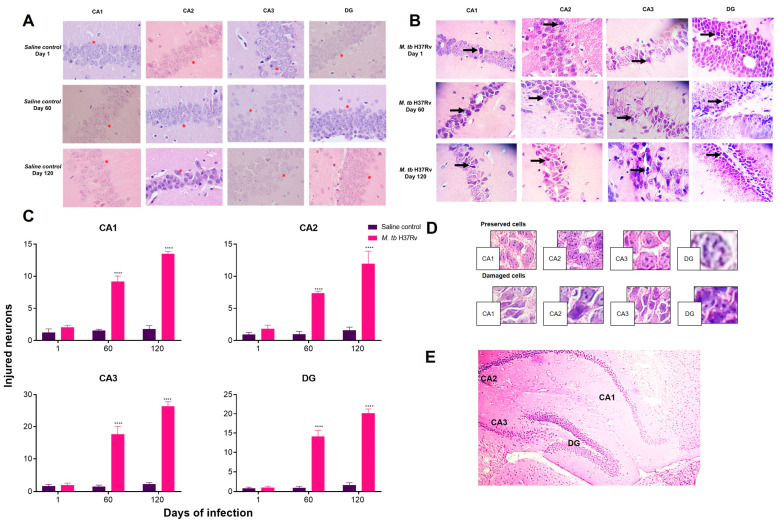
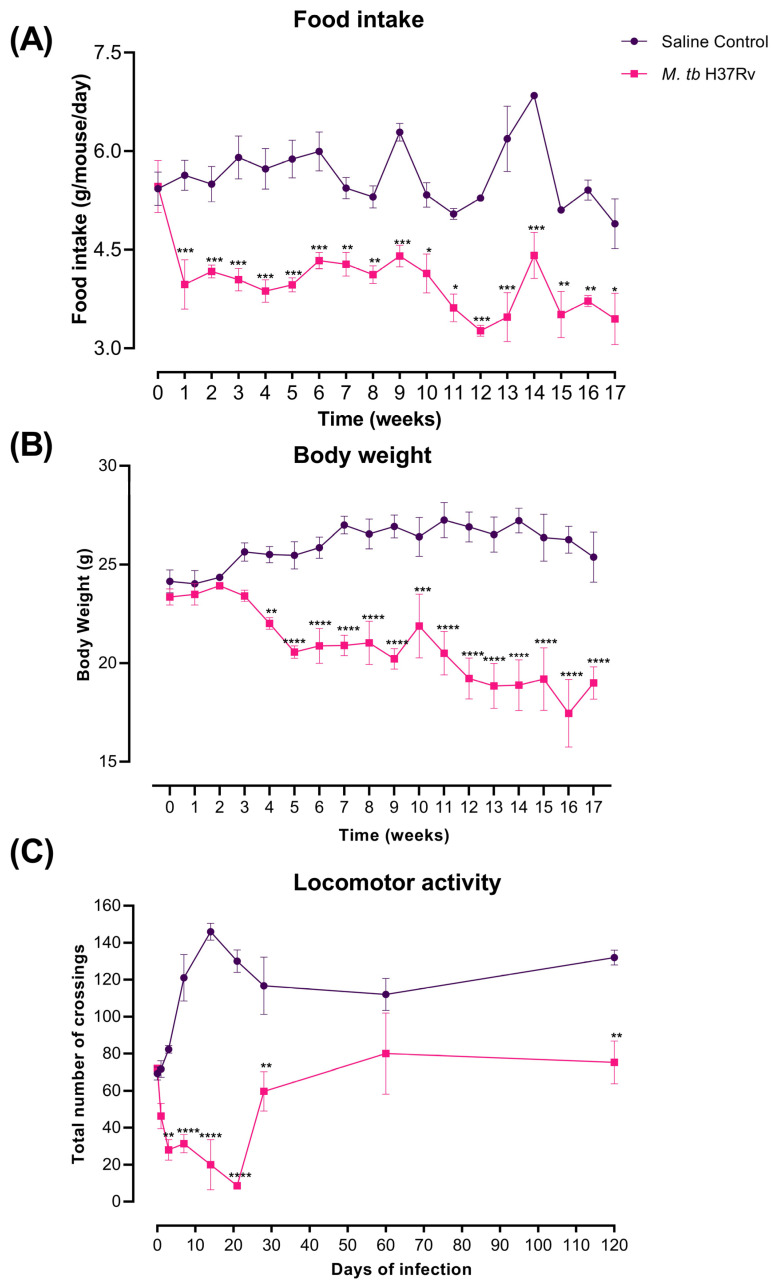
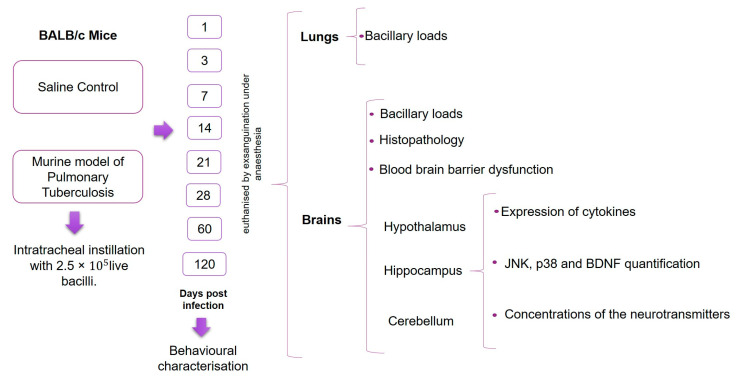
Tuberculosis (TB) is a chronic infectious disease in which prolonged, non-resolutive inflammation of the lung may lead to metabolic and neuroendocrine dysfunction. Previous studies have reported that individuals coursing pulmonary TB experience cognitive or behavioural changes; however, the pathogenic substrate of such manifestations have remained unknown. Here, using a mouse model of progressive pulmonary TB, we report that, even in the absence of brain infection, TB is associated with marked increased synthesis of both inflammatory and anti-inflammatory cytokines in discrete brain areas such as the hypothalamus, the hippocampal formation and cerebellum accompanied by substantial changes in the synthesis of neurotransmitters. Moreover, histopathological findings of neurodegeneration and neuronal death were found as infection progressed with activation of p38, JNK and reduction in the BDNF levels. Finally, we perform behavioural analysis in infected mice throughout the infection, and our data show that the cytokine and neurochemical changes were associated with a marked onset of cognitive impairment as well as depressive- and anxiety-like behaviour. Altogether, our results suggest that besides pulmonary damage, TB is accompanied by an extensive neuroinflammatory and neurodegenerative state which explains some of the behavioural abnormalities found in TB patients.

Keywords: Mycobacterium tuberculosis; behaviour abnormalities; neuroinflammation.


Conflict of interest statement

The authors of this manuscript declare that there are no actual or potential conflicts of interest. The authors affirm that there are no financial, personal or other relationships with other people or organisations that have inappropriately influenced or biased their research.

Figures

Figure 1
Figure 1
Mycobacterial loads in brain and lung and survival rate of BALB/c mice infected with 2.5 × 10⁵ colony-forming unit (CFU) of M. tb H37Rv. (A) Comparative quantification of CFU from lungs and brains of infected mice at each time of infection (n = 12). No bacilli loads were detected in the brain homogenates from mice infected with the H37Rv strain. (B) Survival rates of mice injected with saline solution (control) or infected with M. tb H37Rv (M. tb H37Rv) (n = 36). After two months of infection, infected mice started to die.
Figure 2
Figure 2
Cytokine and enzyme expression of the hypothalamus of mice intratracheal infected with M. tb H37Rv. In the absence of any detectable brain infection, there was a significant increase in gene expression from day 21 post-infection. Saline controls were mainly unaffected. RNA was isolated from hypothalamus homogenates and reverse-transcribed to cDNA, then analysed for changes in gene expression determined by reverse transcription-polymerase chain reaction (RT-PCR) of the indicated cytokine or enzyme. Fold-change values were normalised to expression levels of the saline controls. Data are expressed as mean ± standard error of the mean (SEM). TNFα F (1, 10) = 59.01, p < 0.001, two-way ANOVA; * p < 0.01, ** p = 0.005 Sidak’s multiple comparisons test (α = 0.05) (n = 6). IL-12 F (1, 10) = 224.3, p < 0.005, two-way ANOVA; * p < 0.01, **** p < 0.0001, Sidak’s multiple comparisons test (α = 0.05) (n = 6). IFNγ F (1, 10) = 96.9, p < 0.0001, two-way ANOVA; *** p < 0.001, Sidak’s multiple comparisons test (α = 0.05) (n = 6). IL-4 F (1, 10) = 84.6, p = 0.0089, two-way ANOVA; ** p < 0.001, *** p < 0.0001, Sidak’s multiple comparisons test (α = 0.05) (n = 6). TGFβ F (1, 10) = 102.3, p < 0.0001, two-way ANOVA; * p < 0.01, ** p < 0.001, *** p < 0.0001, Sidak’s multiple comparisons test (α = 0.05) (n = 6). iNOS F (1, 10) = 82.6, p < 0.001, two-way ANOVA; * p < 0.01, *** p < 0.0001, Sidak’s multiple comparisons test (α = 0.05) (n = 6). IDO F (1, 10) = 86.7, p < 0.0001, two-way ANOVA; ** p < 0.001, *** p < 0.0001, Sidak’s multiple comparisons test (α = 0.05) (n = 6).
Figure 3
Figure 3
Cytokine and enzyme expression of the hippocampus of mice intratracheal infected with M. tb H37Rv. In the absence of any detectable brain infection, there was a significant increase in gene expression from day 1 post-infection, being the highest on days 7 and 14 post-infection. Saline controls were mainly unaffected. RNA was isolated from hippocampus homogenates and reverse-transcribed to cDNA, then analysed for changes in gene expression determined by RT-PCR of the indicated cytokine or enzyme. Fold-change values were normalised to expression levels of the saline controls. Data are expressed as mean ± SEM. TNFα F (1, 10) = 81.02, p < 0.0001, two-way ANOVA; ** p < 0.001, *** p < 0.0001 Sidak’s multiple comparisons test (α = 0.05) (n = 6). IL-12 F (1, 10) = 59.7, p = 0.0032, two-way ANOVA; * p < 0.018, ** p < 0.001, *** p < 0.0001, Sidak’s multiple comparisons test (α = 0.05) (n = 6). IFNγ F (1, 10) = 83.6, p < 0.0001, two-way ANOVA; * p < 0.01, ** p < 0.001, *** p < 0.0001, Sidak’s multiple comparisons test (α = 0.05) (n = 6). IL-4 F (1, 10) = 79.3, p < 0.001, two-way ANOVA; *** p < 0.0001, Sidak’s multiple comparisons test (α = 0.05) (n = 6). TGFβ F (1, 10) = 82.7, p < 0.0001, two-way ANOVA; *** p < 0.0001, Sidak’s multiple comparisons test (α = 0.05) (n = 6). iNOS F (1, 10) = 94.32, p < 0.0001, two-way ANOVA; ** p < 0.0016, *** p < 0.0001, Sidak’s multiple comparisons test (α = 0.05) (n = 6). IDO F (1, 10) = 89.45, p < 0.0001, two-way ANOVA; ** p < 0.001, *** p < 0.0001, Sidak’s multiple comparisons test (α = 0.05) (n = 6).
Figure 4
Figure 4
Cytokine and enzyme expression of the cerebellum of mice intratracheal infected with M. tb H37Rv. In the absence of any detectable brain infection, there was a significant increase in gene expression from day 1 post-infection with a peak on days 60 and 120. Saline controls were mainly unaffected. RNA was isolated from cerebellum homogenates and reverse-transcribed to cDNA, then analysed for changes in gene expression determined by RT-PCR of the indicated cytokine or enzyme. Fold-change values were normalised to expression levels of the saline controls. Data are expressed as mean ± SEM. TNFα F (1, 10) = 68.02, p < 0.001, two-way ANOVA; *** p < 0.0001 Sidak’s multiple comparisons test (α = 0.05) (n = 6). IL-12 F (1, 10) = 77.4, p = 0.0028, two-way ANOVA; *** p < 0.0001, Sidak’s multiple comparisons test (α = 0.05) (n = 6). IFNγ F (1, 10) = 48.96, p < 0.0001, two-way ANOVA; * p < 0.01, ** p < 0.001, *** p < 0.0001, Sidak’s multiple comparisons test (α = 0.05) (n = 6). IL-4 F (1, 10) = 85.23, p < 0.001, two-way ANOVA; * p < 0.01, ** p < 0.001, *** p < 0.0001, Sidak’s multiple comparisons test (α = 0.05) (n = 6). TGFβ F (1, 10) = 54.36, p < 0.001, two-way ANOVA; * p < 0.019, *** p < 0.0001, Sidak’s multiple comparisons test (α = 0.05) (n = 6). IL-10 F (1, 10) = 91.23, p < 0.0001, two-way ANOVA; *** p < 0.0001, Sidak’s multiple comparisons test (α = 0.05) (n = 6). iNOS F (1, 10) = 45.23, p < 0.0001, two-way ANOVA; * p < 0.01, *** p < 0.0001, Sidak’s multiple comparisons test (α = 0.05) (n = 6). IDO F (1, 10) = 76.4, p < 0.0001, two-way ANOVA; * p < 0.01, ** p < 0.001, *** p < 0.0001, Sidak’s multiple comparisons test (α = 0.05) (n = 6).
Figure 5
Figure 5
The activation pattern of MAPKs during pulmonary infection with M. tb at 28, 60 and 120 days post-infection in the hypothalamus (A), hippocampus (B) and cerebellum (C). Upper panel shows representative Western blots of activated JNK and p38. Lower panel shows the quantification of the pixel density ratio (PD ratio). There is a tendency to increase the activation of p38 and JNK in the infected mice. Data are expressed as mean ± SEM. p38 Hypothalamus 28 days t = 8.328, ** p = 0.0011, two-tail, unpaired t-test. p38 Hypothalamus 60 days t = 7.428, * p = 0.012, two-tail, unpaired t-test. p38 Hypothalamus 120 days t = 5.19, ** p = 0.0020, two-tail, unpaired t-test. p38 Hippocampus 28 days t = 6.873, *** p = 0.0010, two-tail, unpaired t-test. p38 Hippocampus 60 days t = 16.43, ** p =< 0.0001, two-tail, unpaired t-test. JNK Hypothalamus 28 days t = 8.518, * p = 0.022, two-tail, unpaired t-test. JNK Hypothalamus 120 days t = 9.23, ** p = 0.0027, two-tail, unpaired t-test. JNK Hippocampus 28 days t = 13.75, *** p = 0.0008, two-tail, unpaired t-test (n = 3).
Figure 6
Figure 6
Production of BDNF in the hypothalamus (A), hippocampus (B) and cerebellum (C) of mice with pulmonary tuberculosis (TB). Upper panel shows a representative image of the Western blot at 28, 60 and 120 days post-infection. Lower panel shows the quantification of the PD ratio. BDNF levels decreased in the hippocampus and the hypothalamus at 60 days post-infection and in the cerebellum at 120 days post-infection. Data are expressed as mean ± SEM. Hypothalamus 60 days t = 3.025, * p = 0.0186, two-tail, unpaired t-test. Hippocampus 60 days t = 4.025, * p = 0.0276, two-tail, unpaired t-test. Cerebellum 120 days t = 9.391, ** p = 0.0026. (n = 3).
Figure 7
Figure 7
Pulmonary infection with M. tb induced neuronal injury in the hippocampus (CA3) at the early phase of infection. (A) Representative images of the Fluoro-Jade B (FJ-B) staining in CA3 in the saline control and tuberculous mice (B) at different time points after M. tb infection. (C) Quantification of positive cells to FJ-B in the hippocampus at the indicated days post-infection. Only infected pulmonary animals showed positive cells to FJ-B during the first and second week. Data are expressed as mean ± SEM. F (1, 6) = 2360, p < 0.0001, two-way ANOVA; **** p < 0.0001, Sidak’s multiple comparisons test (α = 0.05) (n = 6).
Figure 8
Figure 8
Pulmonary infection with M. tb induced neuronal death in the hippocampus in the late phase of infection. Representative image of the saline group (A) and tuberculous mice (B) with H&E staining (40×). The asterisks (*) in 8A show preserved hippocampal cells. Arrows indicate damaged cells. (C) The percentage of cells injured per field. (D) The criteria used to discriminate damaged cells from healthy cells. (E) A coronal section of the mice brain, indicating the hippocampus areas from where the fields were obtained for quantification. The infected mice presented a critical number of injured cells in the hippocampus, mostly in the CA3 region and in the DG in contrast to the saline group. Data are expressed as mean ± SEM. CA1 F (1, 10) = 218.6, p < 0.0001, two-way ANOVA; **** p < 0.0001, Sidak’s multiple comparisons test (α = 0.05) (n = 6). CA2 F (1, 10) = 49.01, p < 0.0001, two-way ANOVA; **** p < 0.0001, Sidak’s multiple comparisons test (α = 0.05) (n = 6). CA3 F (1, 10) = 268.3, p < 0.0001, two-way ANOVA; **** p < 0.0001, Sidak’s multiple comparisons test (α = 0.05) (n = 6). DG F (1, 10) = 106.9, p < 0.0001, two-way ANOVA; **** p < 0.0001, Sidak’s multiple comparisons test (α = 0.05) (n = 6).
Figure 9
Figure 9
Advanced TB enhanced blood–brain barrier permeability in BABL/c mice. Simple effects analyses revealed increased extravasation of EB in the infected group at 60 and 120 days post-infection compared with the saline control. Data are expressed as mean ± SEM. F (1, 4) = 23.45, p = 0.0084, two-way ANOVA; * p < 0.01, **** p < 0.0001, Sidak’s multiple comparisons test (α = 0.05) (n = 6).
Figure 10
Figure 10
The concentration of the indicated neurotransmitter determined by HPLC in the hypothalamus of animals intratracheally infected with M. tb. Pulmonary TB mice showed a significant decrease in Norepinephrine (NE), Dopamine (DA), Epinephrine (EP) and 5-HT from day one of infection. Data are expressed as mean ± SEM. The following were used: 5-HT F (1, 4) = 3570, p < 0.0001, two-way ANOVA; *** p < 0.0003, **** p < 0.0001, Sidak’s multiple comparisons test (α = 0.05) (n = 6). DA F (1, 4) = 630.9, p < 0.0001, two-way ANOVA; ** p < 0.0091, **** p < 0.0001, Sidak’s multiple comparisons test (α = 0.05) (n = 6). EP F (1, 4) = 512.6, p < 0.0001, two-way ANOVA; * p < 0.0113, ** p < 0.0032, *** p < 0.0006, Sidak’s multiple comparisons test (α = 0.05) (n = 6). NE F (1, 4) = 443.9, p < 0.0001, two-way ANOVA; ** p < 0.0029, **** p < 0.0001, Sidak’s multiple comparisons test (α = 0.05) (n = 6).
Figure 11
Figure 11
The concentration of the indicated neurotransmitter determined by HPLC in the cerebellum of animals intratracheally infected with M. tb. Infected mice showed a significant decrease in NE, DA, EP and 5-HT from day one of infection. Data are expressed as mean ± SEM. The following were used: 5-HT F (1, 6) = 54.28, p = 0.0003, two-way ANOVA; * p < 0.01, ** p < 0.001, *** p < 0.0001, **** p < 0.00001, Sidak’s multiple comparisons test (α = 0.05) (n = 6). DA F (1, 6) = 344.1, p < 0.0001, two-way ANOVA; * p < 0.01, ** p < 0.001, **** p < 0.0001, Sidak’s multiple comparisons test (α = 0.05) (n = 6). EP F (1, 6) = 215.7, p < 0.0001, two-way ANOVA; * p < 0.01, ** p < 0.001, Sidak’s multiple comparisons test (α = 0.05) (n = 6). NE F (1, 6) = 18.67, p = 0.0050, two-way ANOVA; * p < 0.01, Sidak’s multiple comparisons test (α = 0.05) (n = 6).
Figure 12
Figure 12
The concentration of the indicated neurotransmitter determined by HPLC in the hippocampus of animals intratracheally infected with M. tb. Pulmonary TB mice showed a significant increase in EP from day one of infection and a decrease in the concentration of DA and NE. Data are expressed as mean ± SEM. The following were used: 5-HT F (1, 6) = 74.16, p = 0.0001, two-way ANOVA; * p < 0.01, **** p < 0.0001, Sidak’s multiple comparisons test (α = 0.05) (n = 6). DA F (1, 6) = 60.82, p = 0.0002, two-way ANOVA; * p < 0.01, ** p < 0.001, Sidak’s multiple comparisons test (α = 0.05) (n = 6). EP F (1, 6) = 38.81, p = 0.0008, two-way ANOVA; * p < 0.01, ** p < 0.001, **** p < 0.0001, Sidak’s multiple comparisons test (α = 0.05) (n = 6). NE F (1, 6) = 35.01, p = 0.0010, two-way ANOVA; * p < 0.01, Sidak’s multiple comparisons test (α = 0.05) (n = 6).
Figure 13
Figure 13
Sickness behaviour showed by TB mice. (A) Food intake, (B) body weight loss and (C) locomotor activity (LMA). Infected animals showed food intake decrease after one week of infection, Body weight starts decreasing after three weeks post-infection, and the locomotor activity was decreased during the whole course of the disease being most pronounced during early infection from day 1 to 21. Data are expressed as mean ± SEM. Food intake F (1, 10) = 51.86, p < 0.0001, two-way ANOVA; * p < 0.01, ** p < 0.001, *** p < 0.0005, Sidak’s multiple comparisons test (α = 0.05) (n = 6). Body weight loss F (1, 3) = 101.2, p = 0.0021, two-way ANOVA; ** p < 0.001, *** p < 0.0002, **** p < 0.0001, Sidak’s multiple comparisons test (α = 0.05) (n = 6). LMA F (1, 4) = 222.9, p = 0.0001, two-way ANOVA; ** p < 0.001, **** p < 0.0001, Sidak’s multiple comparisons test (α = 0.05) (n = 6).
Figure 14
Figure 14
Behaviour abnormalities showed by pulmonary TB mice. (A) Tail suspension test (depression-like behaviour), (B) neurological outcome, (C) stretched attend posture (anxiety-like behaviour), (D) open field test (unconditioned fear and anxiety), (E) short-term and (F) long-term memory. Animals infected with M. tb in the lungs present behavioural abnormalities such as depression-like behaviour, anxiety-like behaviour, neurological damage, and short- and long-term memory damage. Data are expressed as mean ± SEM. Tail suspension test F (1, 4) = 225.2, p = 0.0001, two-way ANOVA; *** p < 0.0001, Sidak’s multiple comparisons test (α = 0.05) (n = 6). Neurological outcome F (1, 4) = 186.3, p = 0.0002, two-way ANOVA; ** p < 0.001, *** p < 0.0001, Sidak’s multiple comparisons test (α = 0.05) (n = 6). Stretched attend posture F (1, 4) = 166, p = 0.0002, two-way ANOVA; *** p < 0.0001, Sidak’s multiple comparisons test (α = 0.05) (n = 6). Open field test F (1, 6) = 326.5, p < 0.0001, two-way ANOVA; * p < 0.01, *** p < 0.0001, Sidak’s multiple comparisons test (α = 0.05) (n = 6). Short-term memory F (1, 4) = 49.05, p = 0.0022, two-way ANOVA; * p < 0.01, ** p < 0.001, Sidak’s multiple comparisons test (α = 0.05) (n = 6). Long-term memory F (1, 4) = 116, p = 0.0004, two-way ANOVA; * p < 0.01, ** p < 0.001, *** p < 0.0001, Sidak’s multiple comparisons test (α = 0.05) (n = 6).
Figure 15
Figure 15
Study design workflow. BALB/c mice, 8 weeks of age, were infected with 2.5 × 10⁵ live bacilli or received saline solution (control). At days 1, 3, 7, 14, 21, 28, 60 and 120 post-infection, different behavioural tests were performed. After the behavioural tests, animals were euthanised, and the brain and lungs were collected for the determination of bacillary loads. The hypothalamus, hippocampus and cerebellum were used to determinate the cytokines gene expression, JNK, p38 and BDNF quantification and the determination of neurotransmitters levels. In brains, histological damage and the permeability of the blood–brain barrier were also measured. For each of the measurements, except for the Western Blot, two independent experiments were performed with n = 3 each. The samples for each experimental age group were run separately.
Figure 16
Figure 16
Schematic representation of the behavioural tests performed. Groups of mice of both experimental groups were tested only once, and the studies were performed during the first 4 h of the dark phase of the light cycle. (A) Locomotor activity. To assess LMA, the animals were placed in a box divided into 16 quadrants, and the number of crosses between quadrants were counted in 10 min. (B) Tail suspension test. In this test, the animals were suspended from the tail ventrally for 6 min, and the time that the animal presented behavioural despair was recorded. (C) Stretched attend posture. For this test, each mouse was located in the covered area of the platform and filmed for 5 min. The number of stretched attend postures was counted for 5 min. (D) Open field test, we videotaped from the top in a box divided into 16 quadrants by 5 min and evaluated the time spent in the outer area. (E) Neurological severity score. (F) Recognition test. For this test, the animals were exposed to two objects A, and 30 min after, one of these was changed for object B, whereby short-term memory was evaluated; for long-term memory, the same procedure was carried out, but after 24 h, object C was presented to the animals. (Created with BioRender.com.)
Figure 17
Figure 17
M. tb induces neuroinflammation, neuronal damage and behavioural abnormalities during pulmonary infection. TB is an infectious disease that mainly affects the lungs, although it can spread to other organs and cause extrapulmonary TB. However, most of the time, the host’s immune system efficiently controls the infection. Although, when there is some failure in the immune system, the infection becomes active. (1) Intense inflammation due to the immune response against mycobacteria in the lungs induces neuroinflammation by humoral and neuronal pathways, (2) which is manifested by high production of different cytokines, (3) which disturbs the production of neurotransmitters and induces oxidative damage, with activation of p38 and JNK and decrease in BNDF production. (4) All this causes neuronal injury and death, increases the permeability of the BBB and (5) induces behavioural alterations and neuropsychiatric symptoms such as depression and anxiety. (Created with BioRender.com.).

References

    1. Pai M., Behr M.A., Dowdy D., Dheda K., Divangahi M., Boehme C.C., Ginsberg A., Swaminathan S., Spigelman M., Getahun H., et al. Tuberculosis. Nat. Rev. Dis. Primers. 2016;2 doi: 10.1038/nrdp.2016.76. - DOI - PubMed
    1. World Health Organization . Global tuberculosis Report 2020. World Health Organization; Geneva, Switzerland: 2020. Licence: CC BY-NC-SA 3.0 IGO.
    1. Wells K.B., Golding J.M., Burnam M.A. Psychiatric disorder in a sample of the general population with and without chronic medical conditions. Am. J. Psychiatry. 1988;145:976–981. doi: 10.1176/ajp.145.8.976. - DOI - PubMed
    1. Xavier P.B., Peixoto B. Emotional distress in angolan patients with several types of tuberculosis. Afr. Health Sci. 2015;15:378–384. doi: 10.4314/ahs.v15i2.10. - DOI - PMC - PubMed
    1. Paulo B.X., Peixoto B. Emotional distress patients with several types of tuberculosis. A pilot study with patients from the Sanatorium Hospital of Huambo. Int. J. Mycobacteriol. 2016;5:S58. doi: 10.1016/j.ijmyco.2016.11.002. - DOI - PubMed

MeSH terms

LinkOut - more resources