. 2020 Dec 13;6(4):364.
doi: 10.3390/jof6040364.

Fungal Dysbiosis Correlates with the Development of Tumor-Induced Cachexia in Mice

Affiliations

Fungal Dysbiosis Correlates with the Development of Tumor-Induced Cachexia in Mice

Daniela L Jabes et al. J Fungi (Basel). .

Abstract

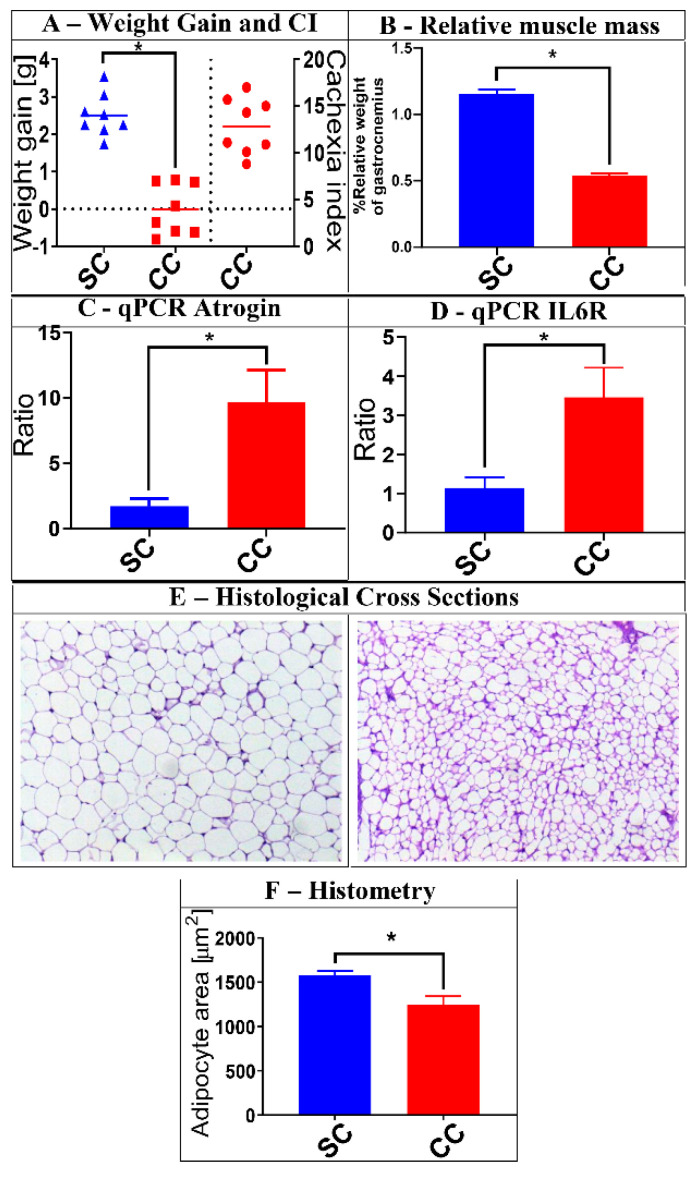
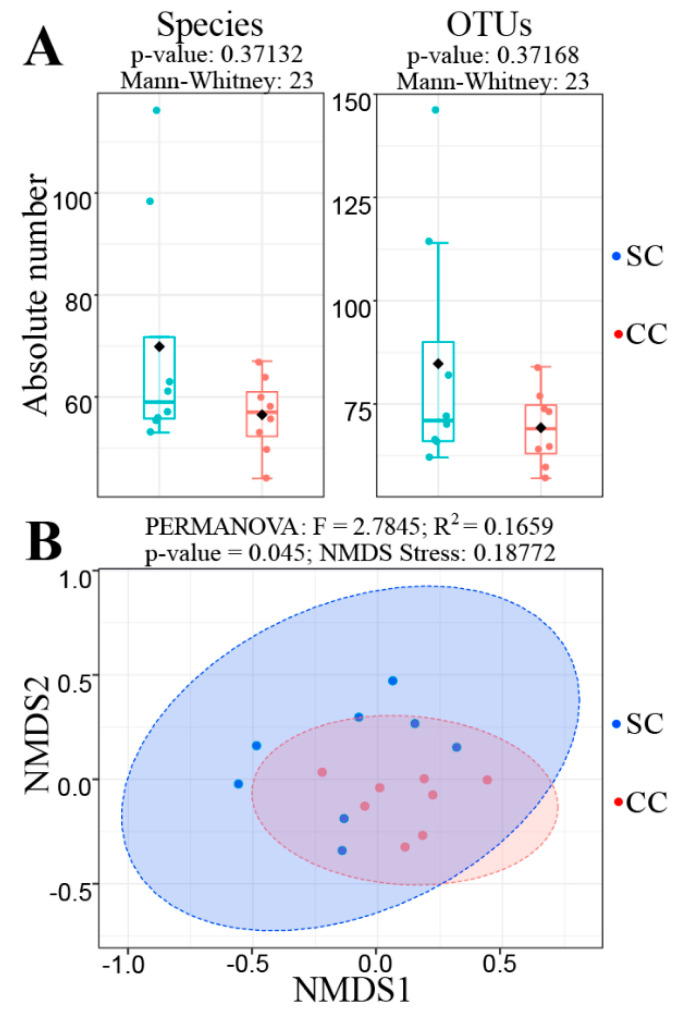
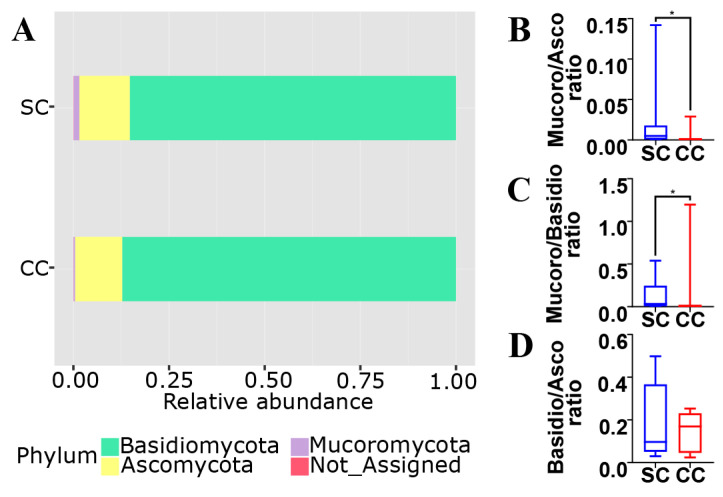
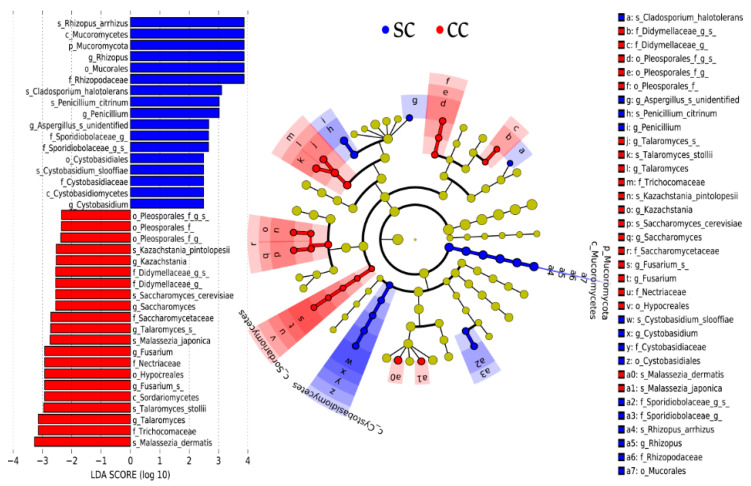
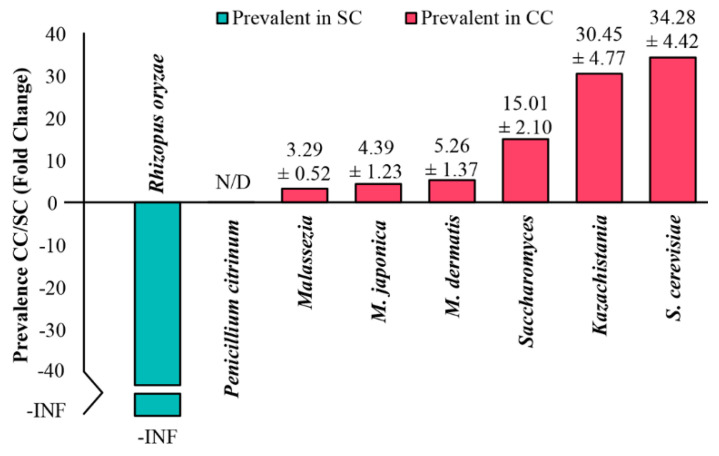
Cachexia (CC) is a devastating metabolic syndrome associated with a series of underlying diseases that greatly affects life quality and expectancy among cancer patients. Studies involving mouse models, in which CC was induced through inoculation with tumor cells, originally suggested the existence of a direct correlation between the development of this syndrome and changes in the relative proportions of several bacterial groups present in the digestive tract. However, these analyses have focus solely on the characterization of bacterial dysbiosis, ignoring the possible existence of changes in the relative populations of fungi, during the development of CC. Thus, the present study sought to expand such analyses, by characterizing changes that occur in the gut fungal population (mycobiota) of mice, during the development of cancer-induced cachexia. Our results confirm that cachectic animals, submitted to Lewis lung carcinoma (LLC) transplantation, display significant differences in their gut mycobiota, when compared to healthy controls. Moreover, identification of dysbiotic fungi showed remarkable consistency across successive levels of taxonomic hierarchy. Many of these fungi have also been associated with dysbioses observed in a series of gut inflammatory diseases, such as obesity, colorectal cancer (CRC), myalgic encephalomyelitis (ME) and inflammatory bowel disease (IBD). Nonetheless, the dysbiosis verified in the LLC model of cancer cachexia seems to be unique, presenting features observed in both obesity (reduced proportion of Mucoromycota) and CRC/ME/IBD (increased proportions of Sordariomycetes, Saccharomycetaceae and Malassezia). One species of Mucoromycota (Rhyzopus oryzae) stands out as a promising probiotic candidate in adjuvant therapies, aimed at treating and/or preventing the development of CC.

Keywords: NGS; cachexia; microbiome; microbiota; mycobiota; next generation sequencing.


Conflict of interest statement

The authors declare no conflict of interest.

Figures

Figure 1
Figure 1
Characterization of cachexia in the animals selected for this study. A group of 16 animals was selected for the analyses described herein. Eight (8) of them received saline injection (SC group), while the other 8 were injected with Lewis lung carcinoma (LLC) cells (CC group). After 28 days, the animals were evaluated for a series of characteristics typically associated with cachexia. Panel (A) shows, on the left part of the graph, the average weight gain of the SC and CC animals 28 days after injection (tumor weight subtracted), as well as the Cachexia Indexes (CI) among CC animals (on the right part of the graph) (Weight gain: SC = 2.508 ± 0.1996; CC = −0.00625 ± 0.2391. Cachexia index: CC = 12.86 ± 1.06). Panel (B) shows the reduced relative mass of gastrocnemius muscle in CC animals, when compared to SC controls (SC = 1.151 ± 0.09864; CC = 0.5373 ± 0.04663). Panels (C,D) show that CC animals also display increased relative expression of muscular atrophy and inflammation markers (Atrogin and IL6R, respectively), as verified by qPCR (Atrogin: SC = 1.421 ± 0.3972; CC = 9.661 ± 2.471. IL6R: SC = 1.062 ± 0.1726; CC = 3.573 ± 0.707). Panel (E) shows examples of histological analyses made with epididymal adipose tissue obtained from SC (left) and CC (right) animals, demonstrating significant reduction in the average adipocyte area in CC animals. These reductions are confirmed by histometric evaluation of representative cross sections obtained from all animals within each group (Panel (F)) (Adipocyte area: SC = 1573 ± 45.83; CC = 1197 ± 77.71). Magnification of adipose tissue: 20×; * = p ≤ 0.05, after Mann–Whitney U test. Results for SC animals are shown in blue, while results for CC animals are shown in red. Plots represent mean and mean standard errors.
Figure 2
Figure 2
Alpha and Beta diversity analyses comparing the mycobiota of SC and CC animals. Panel (A) shows the result of an alpha diversity analysis, displaying the absolute number of fungi obtained for the levels of species (left) and operational taxonomic units (OTU) (right), in both SC and CC animals. In both cases, it was not possible to verify significant changes in fungal alpha diversity between the two groups, since p-values obtained from such analyses, after a Mann–Whitney U test, were always above 0.05. Panel (B) shows the result of a Beta-diversity analysis to evaluate differences in composition between the fungal populations present in the stool samples from SC and CC animals. This analysis was performed with the aid of a non-metric multidimensional scaling (NMDS) algorithm (based on the Bray–Curtis index), using the same OTU Table described above. The NMDS analysis shows that differences in mycobiota composition allow statistically significant discrimination between the SC and CC groups (at p = 0.045, as verified by PERMANOVA), although the two main components of the NMDS analysis do not allow us to visualize such distinction. Animals from the SC group are shown in blue, while animals from the CC group are shown in red.
Figure 3
Figure 3
Phylum composition of the mycobiota from SC and CC animals. Panel (A) shows that the gut mycobiota of SC animals are mostly represented by Ascomycota (~85.1%), followed by Basidiomycota (~13.3%) and Mucoromycota (~1.5%). These proportions are shifted in the gut mycobiota of CC animals to ~87.2% (Ascomycota), ~12.5% (Basidiomycota), and ~0.4% (Mucoromycota). These values were used to calculate the specific ratios involving the main fungal phyla, between SC and CC animals: Mucoromycota/Ascomycota (Panel (B)), Mucoromycota/Basidiomycota (Panel (C)) and Basidiomycota/Ascomycota (Panel (D)). Results for SC animals are shown in blue, while results for CC animals are shown in red (* = p ≤ 0.05, after Mann–Whitney U test).
Figure 4
Figure 4
Identification of the main fungal taxa differentially represented in stool samples from SC and CC animals. The Core 70 OTU Table (see Methods) was subjected to a linear discriminant analysis effect size (LEfSe) analysis to identify differentially represented taxa between CC and SC animals. Taxa preferentially present in CC animals displayed Linear Discriminant Analysis (LDA) Scores ≤2, while taxa preferentially present in SC animals displayed LDA Scores ≥2. All taxa identified in this analysis display statistical significance at p ≤ 0.05, which was used as a threshold in the LEfSe analysis. All differentially represented taxa (at different taxonomic levels) are shown in the left panel of the figure and their distribution in a phylogenetic dendrogram is shown at the center panel. The concentric circles of the dendrogram show the taxonomic hierarchy, from phylum (innermost circle) to species (outermost circle) and the different microorganisms distributed in each node can be identified with the aid of the legend shown on the right panel. Microorganisms overrepresented in stool samples from SC animals are shown in blue, while microorganisms overrepresented in stool samples from CC animals are shown in red.
Figure 5
Figure 5
Relative quantification of different microorganisms in stool samples from SC and CC animals by qPCR. Equimolar samples of DNA extracted from stool samples obtained from each mouse were consolidated into two pools, representing SC and CC groups. Samples from these pools were then used in qPCR experiments, with primers previously described in the literature as specific to Saccharomyces, Kazachstania, and Malassezia genera, as well as to the species Saccharomyces cerevisiae, Malassezia dermatis, Malassezia japonica, Rhizopus oryzae, and Penicillium citrinum. The Ct values obtained for each of these taxa were normalized by the Ct obtained after amplifying the pooled DNAs with the primer pair used to amplify the fungal ITS1 amplicons. Next, the normalized Cts were used to calculate the relative prevalence of each genus/species in the CC pool, in relation to the SC pool (CC/SC). The relative quantification values for each taxon (Fold Change) are shown in the graph, as the mean ± standard deviation of three independent experiments (each performed in triplicate). The species Rhizopus oryzae was detected only in the DNA pool from SC animals, so its CC/SC ratio is represented in the graph as negative, to infinity (-INF). The species Penicillium citrinum was not detected (N/D) in any of the experiments, with either DNA pool.

References

    1. Fearon K., Strasser F., Anker S.D., Bosaeus I., Bruera E., Fainsinger R.L., Jatoi A., Loprinzi C., MacDonald N., Mantovani G., et al. Definition and classification of cancer cachexia: An international consensus. Lancet Oncol. 2011;12:489–495. doi: 10.1016/S1470-2045(10)70218-7. - DOI - PubMed
    1. Bruera E., Hui D. Conceptual models for integrating palliative care at cancer centers. J. Palliat. Med. 2012;15:1261–1269. doi: 10.1089/jpm.2012.0147. - DOI - PMC - PubMed
    1. Bindels L.B., Beck R., Schakman O., Martin J.C., De Backer F., Sohet F.M., Dewulf E.M., Pachikian B.D., Neyrinck A.M., Thissen J.P., et al. Restoring Specific Lactobacilli Levels Decreases Inflammation and Muscle Atrophy Markers in an Acute Leukemia Mouse Model. PLoS ONE. 2012;7:e37971. doi: 10.1371/journal.pone.0037971. - DOI - PMC - PubMed
    1. Bindels L.B., Neyrinck A.M., Claus S.P., Le Roy C.I., Grangette C., Pot B., Martinez I., Walter J., Cani P.D., Delzenne N.M. Synbiotic approach restores intestinal homeostasis and prolongs survival in leukaemic mice with cachexia. ISME J. 2016;10:1456–1470. doi: 10.1038/ismej.2015.209. - DOI - PMC - PubMed
    1. Tözün N., Vardareli E. Gut Microbiome and Gastrointestinal Cancer: Les liaisons Dangereuses. J. Clin. Gastroenterol. 2016;50(Suppl. S2):S191–S196. doi: 10.1097/MCG.0000000000000714. - DOI - PubMed

LinkOut - more resources