Derivation of Respiratory Metrics in Health and Asthma
- PMID: 33322776
- PMCID: PMC7764376
- DOI: 10.3390/s20247134
Derivation of Respiratory Metrics in Health and Asthma
Abstract
The ability to continuously monitor breathing metrics may have indications for general health as well as respiratory conditions such as asthma. However, few studies have focused on breathing due to a lack of available wearable technologies. To examine the performance of two machine learning algorithms in extracting breathing metrics from a finger-based pulse oximeter, which is amenable to long-term monitoring.
Methods: Pulse oximetry data were collected from 11 healthy and 11 with asthma subjects who breathed at a range of controlled respiratory rates. U-shaped network (U-Net) and Long Short-Term Memory (LSTM) algorithms were applied to the data, and results compared against breathing metrics derived from respiratory inductance plethysmography measured simultaneously as a reference.
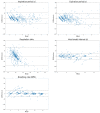
Results: The LSTM vs. U-Net model provided breathing metrics which were strongly correlated with those from the reference signal (all p < 0.001, except for inspiratory: expiratory ratio). The following absolute mean bias (95% confidence interval) values were observed (in seconds): inspiration time 0.01(-2.31, 2.34) vs. -0.02(-2.19, 2.16), expiration time -0.19(-2.35, 1.98) vs. -0.24(-2.36, 1.89), and inter-breath intervals -0.19(-2.73, 2.35) vs. -0.25(2.76, 2.26). The inspiratory:expiratory ratios were -0.14(-1.43, 1.16) vs. -0.14(-1.42, 1.13). Respiratory rate (breaths per minute) values were 0.22(-2.51, 2.96) vs. 0.29(-2.54, 3.11). While percentage bias was low, the 95% limits of agreement was high (~35% for respiratory rate).
Conclusion: Both machine learning models show strong correlation and good comparability with reference, with low bias though wide variability for deriving breathing metrics in asthma and health cohorts. Future efforts should focus on improvement of performance of these models, e.g., by increasing the size of the training dataset at the lower breathing rates.
Keywords: LSTM; U-Net; asthma; machine learning; respiratory monitoring.
Conflict of interest statement
The authors declare no conflict of interest.
Figures


References
-
- Thamrin C., Zindel J., Nydegger R., Reddel H.K., Chanez P., Wenzel S.E., Fitzpatrick S., Watt R.A., Suki B., Frey U. Predicting future risk of asthma exacerbations using individual conditional probabilities. J. Allergy Clin. Immunol. 2011;127:1494–1502. doi: 10.1016/j.jaci.2011.01.018. - DOI - PubMed
-
- Yañez A.M., Guerrero D., De Alejo R.P., Garcia-Rio F., Alvarez-Sala J.L., Calle-Rubio M., De Molina R.M., Falcones M.V., Ussetti P., Sauleda J., et al. Monitoring Breathing Rate at Home Allows Early Identification of COPD Exacerbations. Chest. 2012;142:1524–1529. doi: 10.1378/chest.11-2728. - DOI - PubMed
-
- Channa A., Popescu N., Malik N.U.R. 2020 12th International Congress on Ultra Modern Telecommunications and Control Systems and Workshops (ICUMT) Institute of Electrical and Electronics Engineers (IEEE); New York, NY, USA: 2020. Managing COVID-19 Global Pandemic with High-Tech Consumer Wearables: A Comprehensive Review; pp. 222–228.
Publication types
MeSH terms
LinkOut - more resources
Full Text Sources
Medical

