. 2021 Sep;70(9):1734-1745.
doi: 10.1136/gutjnl-2020-321190. Epub 2020 Dec 15.

Hepatitis C reference viruses highlight potent antibody responses and diverse viral functional interactions with neutralising antibodies

Affiliations

Hepatitis C reference viruses highlight potent antibody responses and diverse viral functional interactions with neutralising antibodies

Dorothea Bankwitz et al. Gut. 2021 Sep.

Erratum in

Abstract

Objective: Neutralising antibodies are key effectors of infection-induced and vaccine-induced immunity. Quantification of antibodies' breadth and potency is critical for understanding the mechanisms of protection and for prioritisation of vaccines. Here, we used a unique collection of human specimens and HCV strains to develop HCV reference viruses for quantification of neutralising antibodies, and to investigate viral functional diversity.

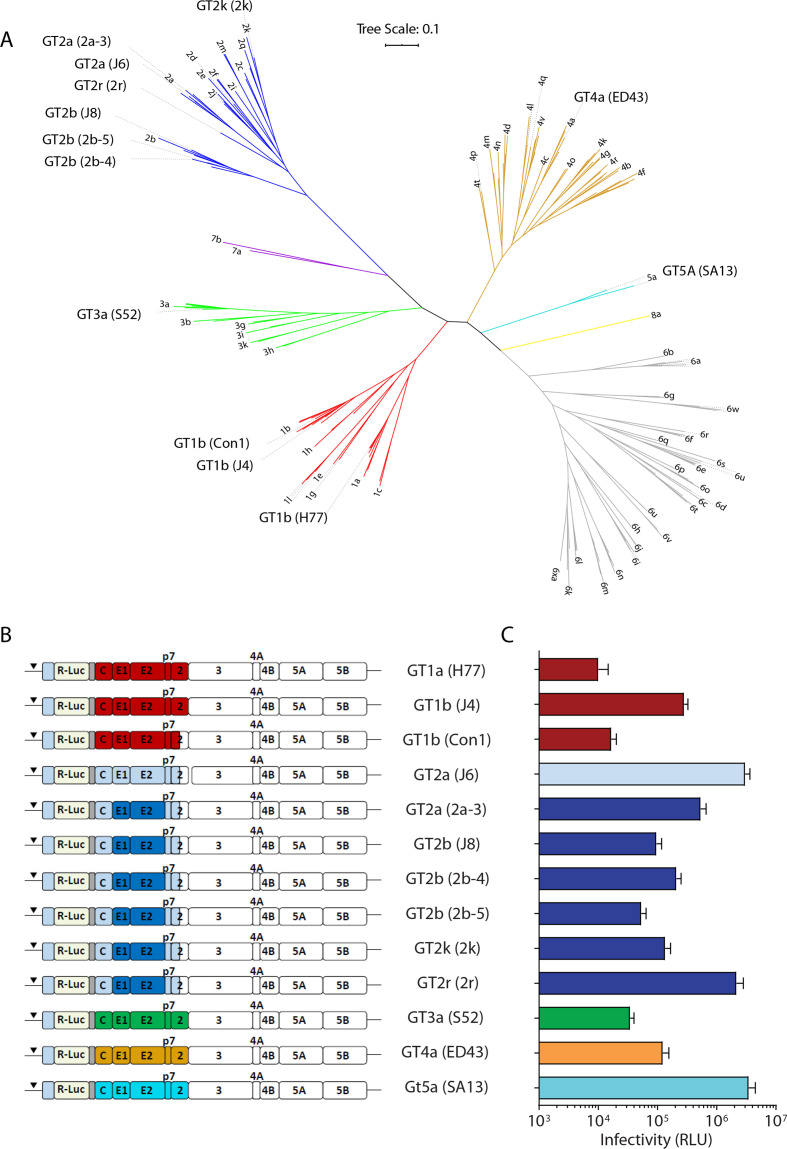
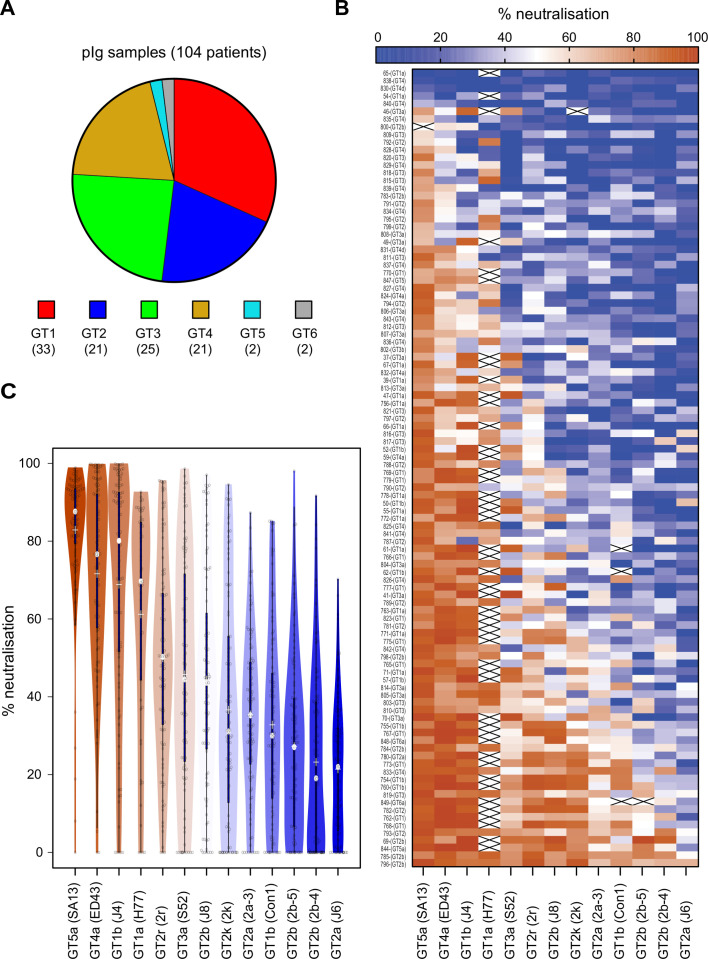
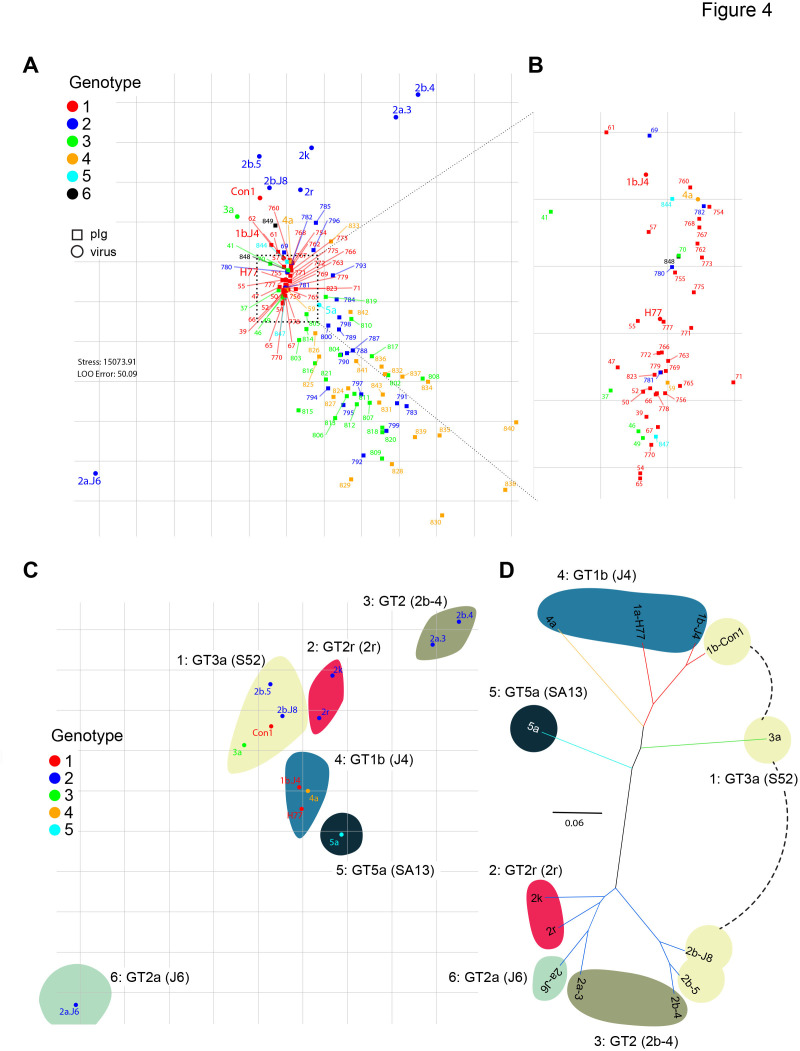
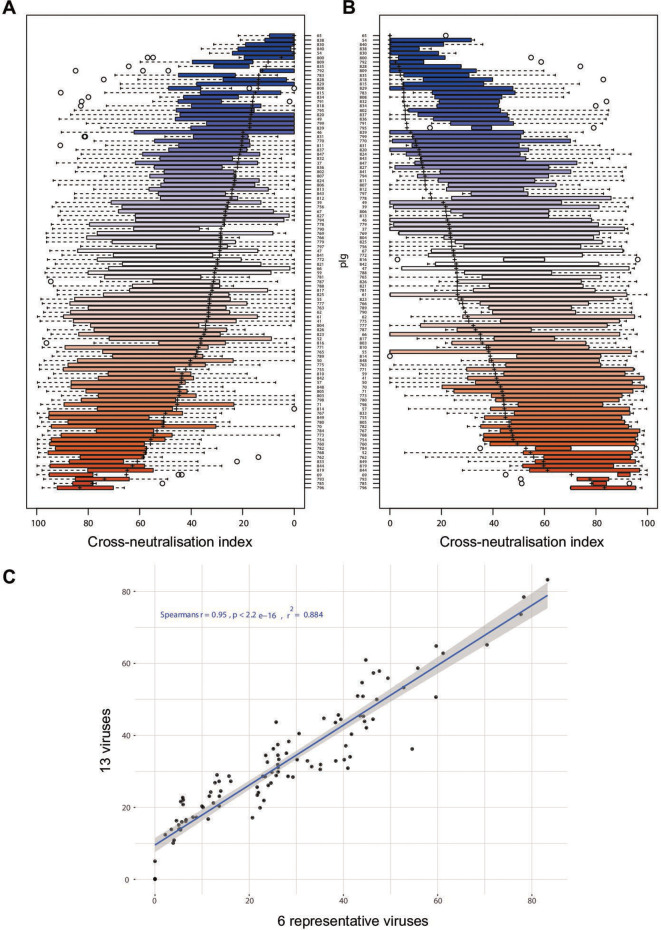
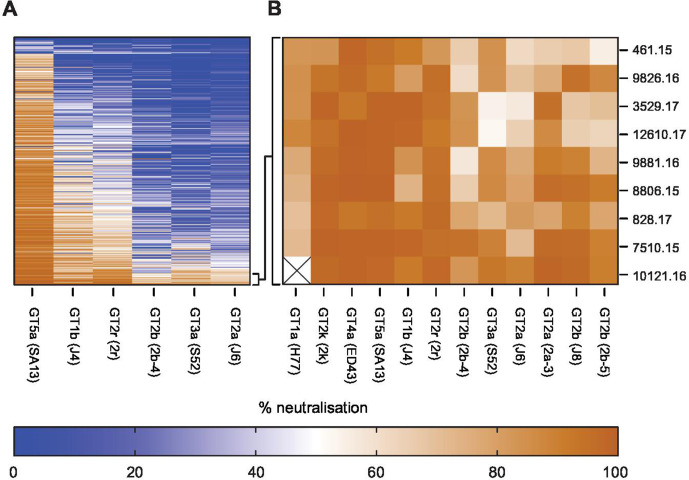
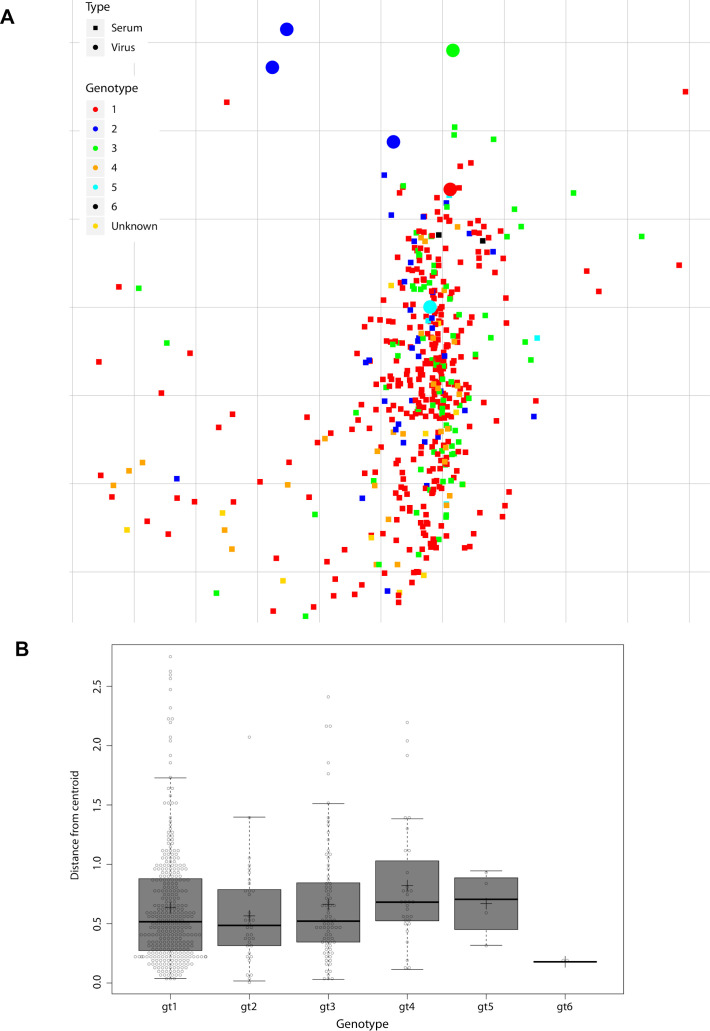
Design: We profiled neutralisation potency of polyclonal immunoglobulins from 104 patients infected with HCV genotype (GT) 1-6 across 13 HCV strains representing five viral GTs. Using metric multidimensional scaling, we plotted HCV neutralisation onto neutralisation maps. We employed K-means clustering to guide virus clustering and selecting representative strains.

Results: Viruses differed greatly in neutralisation sensitivity, with J6 (GT2a) being most resistant and SA13 (GT5a) being most sensitive. They mapped to six distinct neutralisation clusters, in part composed of viruses from different GTs. There was no correlation between viral neutralisation and genetic distance, indicating functional neutralisation clustering differs from sequence-based clustering. Calibrating reference viruses representing these clusters against purified antibodies from 496 patients infected by GT1 to GT6 viruses readily identified individuals with extraordinary potent and broadly neutralising antibodies. It revealed comparable antibody cross-neutralisation and diversity between specimens from diverse viral GTs, confirming well-balanced reporting of HCV cross-neutralisation across highly diverse human samples.

Conclusion: Representative isolates from six neutralisation clusters broadly reconstruct the functional HCV neutralisation space. They enable high resolution profiling of HCV neutralisation and they may reflect viral functional and antigenic properties important to consider in HCV vaccine design.

Keywords: HCV; genotype; hepatitis C; immunology in hepatology; liver.


Conflict of interest statement

Competing interests: MC reports personal fees from Abbvie, personal fees from Gilead Sciences, personal fees from Janssen-Cilag, personal fees from Merck, MD, personal fees from Biogen, personal fees from Falk Foundation, personal fees from Siemens, personal fees from Spring Bank, personal fees from GlaxoSmithKline, outside the submitted work.

Figures

Figure 1
Figure 1
Genetic relationship and infectivity of cell culture-derived HCV (HCVcc) reporter viruses. (A) Phylogenetic tree of E1E2 amino acid sequences. Genotypes are colour coded. The tree was constructed using the maximum likelihood method with MEGA. (B) Schematic drawing of chimeric, JFH1-based HCVcc reporter constructs. The genotype represented by the E1-E2 genes is given in front, the strain name representing these genes is given in brackets. (C) Infectivity of the given HCVcc reporter viruses quantified by luciferase reporter gene assays. Mean values of n=12 replicates and the SD are given.
Figure 2
Figure 2
Amino acid conservation between the 13 HCV genotypes within the large virus panel. Differences are mapped according to the conservation of chemical amino acid properties onto the E2 ectodomain structure. (A) Cartoon representation of the HCV E2 ectodomain crystallised in complex with HEPC3 and HEPC46 Fabs (PDB 6MEJ). For simplicity, the N-terminal part (aa 405–413) of E2 is not shown in (A)–(F). The composite CD81 binding site, consisting of epitope I (aa412-423; green), epitope II (aa428-446; orange) and the CD81-binding loop (aa518-542; blue), is highlighted and the HVR2 (aa459-486) is coloured in black. (B) Surface representation of the HCV E2 ectodomain with mapped amino acid conservation between the HCV genotypes included in the large virus panel. (C) Putty cartoon representation of the E2 ectodomain alignment with the amino acid represented by the tube thickness and colour coded according to the bar underneath similar to colouring according to the amino acid conservation in (B). (D)–(F) Representations of E2 according to (A)–(C), respectively, with a view turned by approximately 90 degrees along the horizontal axis. (E) The epitope contact residues of HC84.26 (PDB 5ERW) is mapped to identify its epitope, which is mapped onto the E2 surface (black contour). (G) Radar plots of individual neutralisation capacities of a panel of 8 well-known human monoclonal antibodies using all 13 cell culture-derived HCV (HCVcc) reporter viruses.
Figure 3
Figure 3
Profiling of reporter virus neutralisation by polyclonal immunoglobulins (pIg) from 104 patients infected by GT1 to GT6 viruses. (A) Distribution of HCV genotypes of chronically infected patients in the cohort. (B) Heatmap of pIg neutralisation data with efficient virus neutralisation in red and inefficient neutralisation in blue. Crossed white rectangle, data not available. (C) Rank-ordered representation of cell culture-derived HCV (HCVcc) viruses based on their susceptibility to patient-derived pIg neutralisation. The silhouette of the violin is proportional to the number of sera with that neutralisation capacity, the solid blue bar covers 50% of all data, that is, second and third quartile, the grey dot in the middle indicates the median and ‘+’ the mean.
Figure 4
Figure 4
Metric multidimensional scaling of neutralisation data (104 polyclonal immunoglobulins (pIg) samples and 13 viruses). (A) Two-dimensional neutralisation map (with no normalisation and 1/Dij as weight). Viruses are drawn as coloured circles, pIg as coloured squares. (B) Magnification of central cluster. (C) Representation of only the viruses shows mapping to six neutralisation clusters. Clusters are enumerated in clockwise orientation, and reference virus for each cluster is given. (D) Phylogenetic tree of E1E2 amino acid sequences of the cell culture-derived HCV (HCVcc) screening viruses. Branches of the tree are coloured according to viral genotypes. Clouds around the virus strains are coloured according to neutralisation cluster.
Figure 5
Figure 5
HCV reference panel faithfully reproduces data of large virus panel. (A) Rank-ordered representation of patient-derived polyclonal immunoglobulins (pIg) based on the cross-neutralisation values against all 13 cell culture-derived HCV (HCVcc) strains. (B) Rank-ordered representation of patient-derived pIg based on the cross-neutralisation of six reference viruses. The solid rectangle is the data range for second and third quartile, the dotted line indicates the date range in first and fourth quartile, ‘+’ indicates the mean cross-neutralisation and individual points outside the whiskers are outliers. (C) Correlation between patient-derived pIg rankings based on 13 HCVcc strains and the 6 reference HCVcc strains.
Figure 6
Figure 6
Identification of elite neutralisers using six reference viruses. (A) Heatmap of virus neutralisation by 392 patient-derived polyclonal immunoglobulin (pIg) against given six reference viruses. (B) Confirmation that the 2% best patient-derived pIg samples efficiently neutralise 12 different cell culture-derived HCV (HCVcc) strains.
Figure 7
Figure 7
Metric multidimensional scaling of neutralisation data (496 polyclonal immunoglobulin (pIg) samples and 6 reference viruses). (A) Two-dimensional neutralisation map (with no normalisation and 1/Dij as weight). Viruses are drawn as coloured circles, pIg as coloured squares. (B) Distance of each pIg specimen to the central point (ie, centroid) of the pIg cluster of its cognate genotype. Cognate genotype means the genotype of the infecting virus of the patient that the sample was drawn from. The box covers 50% of the data range, that is, the second and third quartile, whiskers indicate the complete data range from first to fourth quartile, thick black bar indicates the median and ‘+’ the mean. The points outside the whiskers are outliers.

Comment in

References

    1. World Health Organisation . Global hepatitis report 2017. Geneva: WHO; 2017.
    1. Pawlotsky J-M. Hepatitis C Virus Resistance to Direct-Acting Antiviral Drugs in Interferon-Free Regimens. Gastroenterology 2016;151:70–86. 10.1053/j.gastro.2016.04.003 - DOI - PubMed
    1. Dietz J, Susser S, Vermehren J, et al. Patterns of Resistance-Associated Substitutions in Patients With Chronic HCV Infection Following Treatment With Direct-Acting Antivirals. Gastroenterology 2018;154:976–88. 10.1053/j.gastro.2017.11.007 - DOI - PubMed
    1. Midgard H, Bjøro B, Mæland A, et al. Hepatitis C reinfection after sustained virological response. J Hepatol 2016;64:1020–6. 10.1016/j.jhep.2016.01.001 - DOI - PubMed
    1. Pineda JA, Núñez-Torres R, Téllez F, et al. Hepatitis C virus reinfection after sustained virological response in HIV-infected patients with chronic hepatitis C. J Infect 2015;71:571–7. 10.1016/j.jinf.2015.07.006 - DOI - PubMed

Publication types