. 2021 May;11(5):1248-1267.
doi: 10.1158/2159-8290.CD-20-0304. Epub 2020 Dec 15.

Gut Microbiome Directs Hepatocytes to Recruit MDSCs and Promote Cholangiocarcinoma

Affiliations

Gut Microbiome Directs Hepatocytes to Recruit MDSCs and Promote Cholangiocarcinoma

Qianfei Zhang et al. Cancer Discov. 2021 May.

Abstract

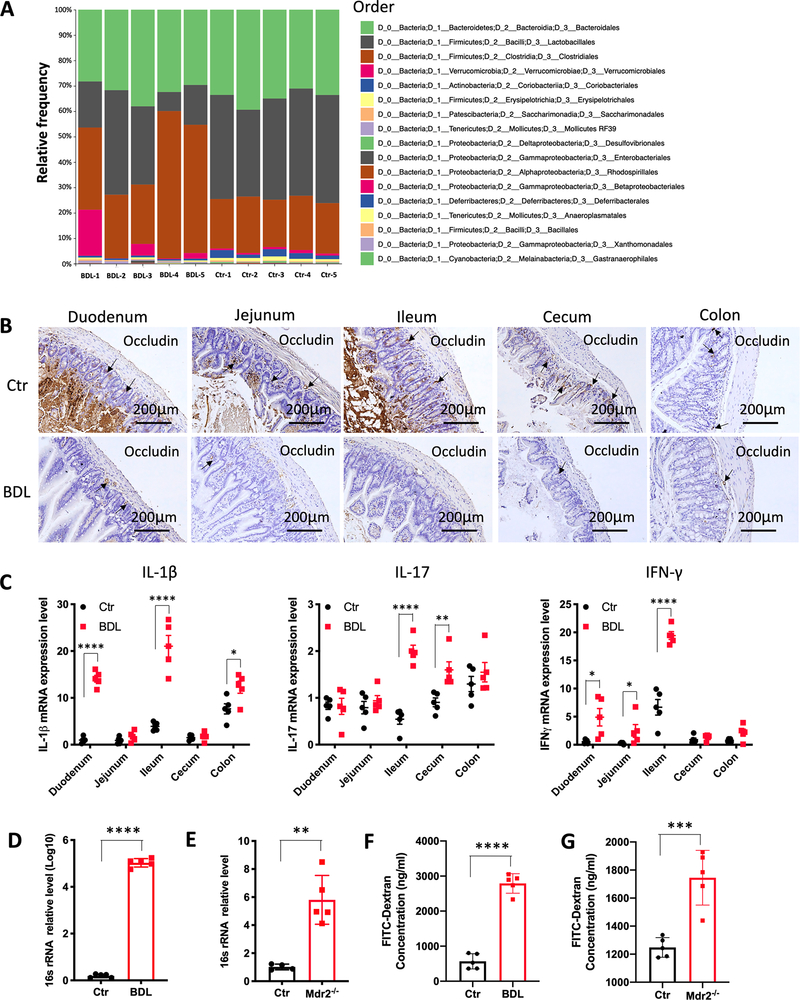
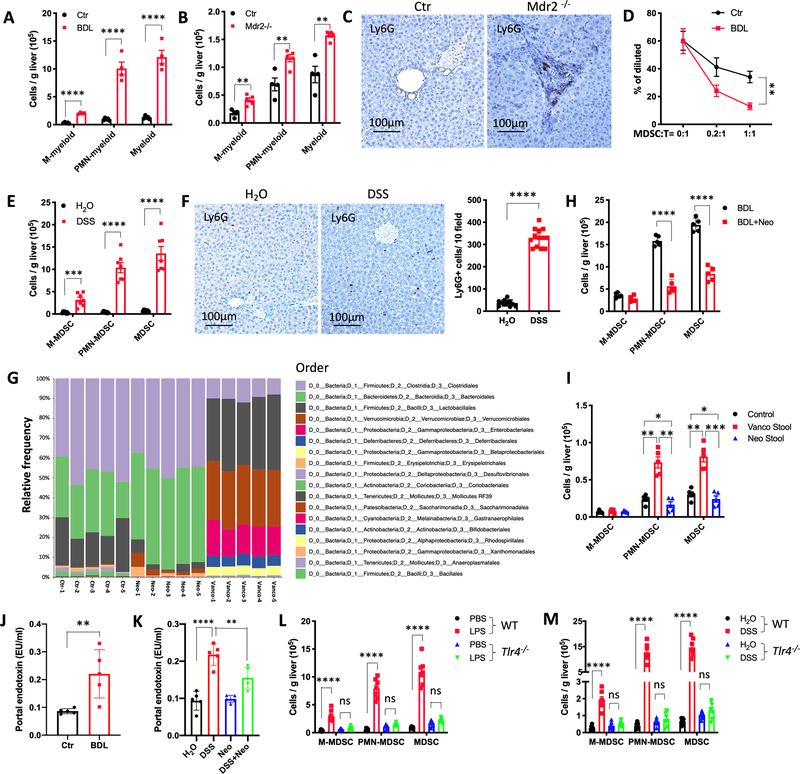
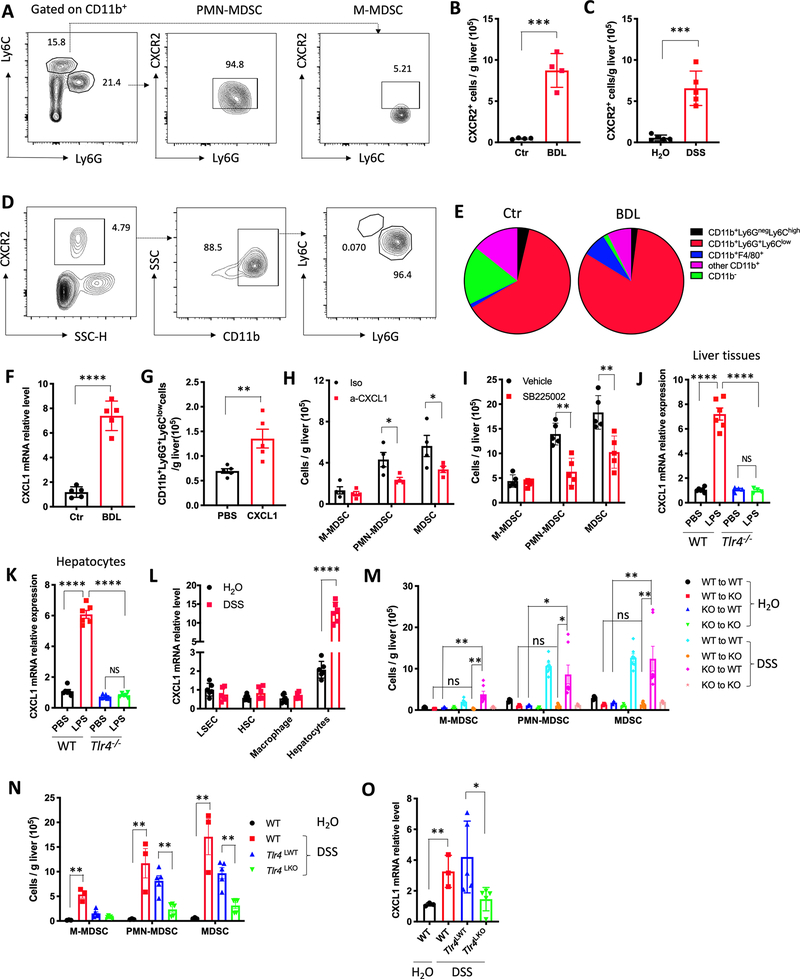
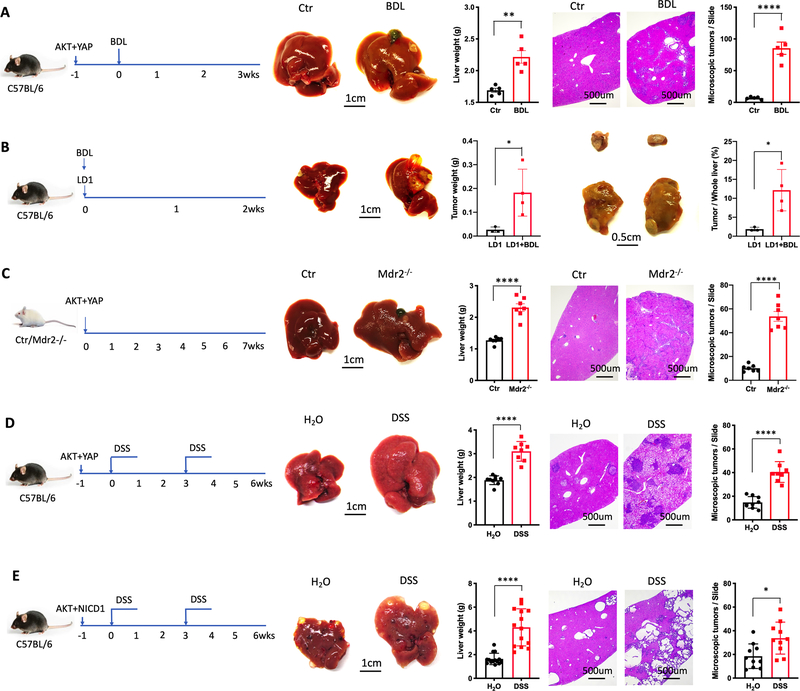
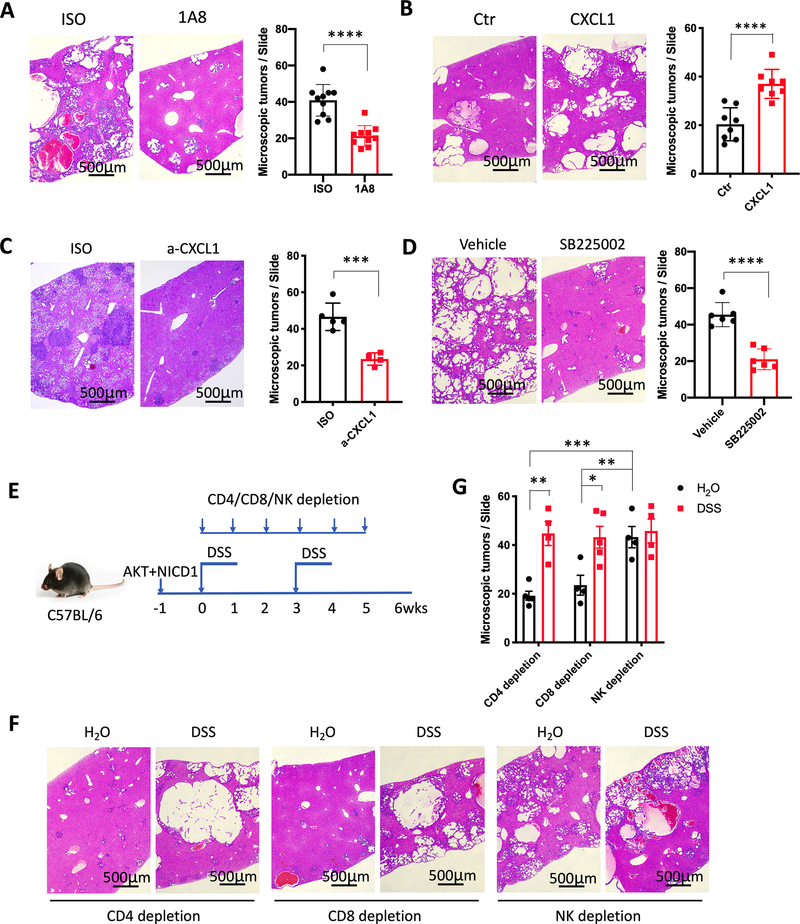
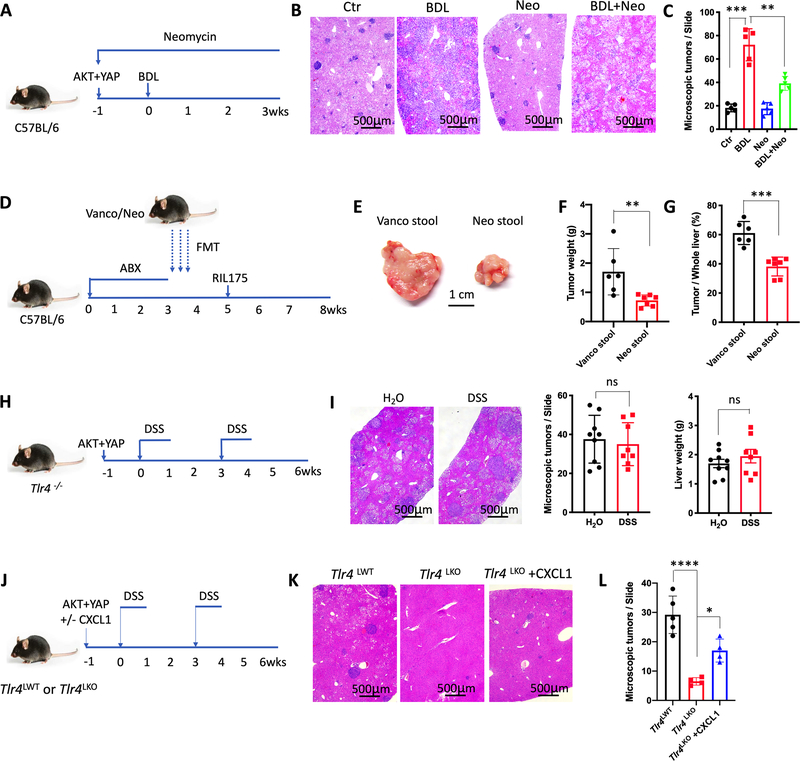
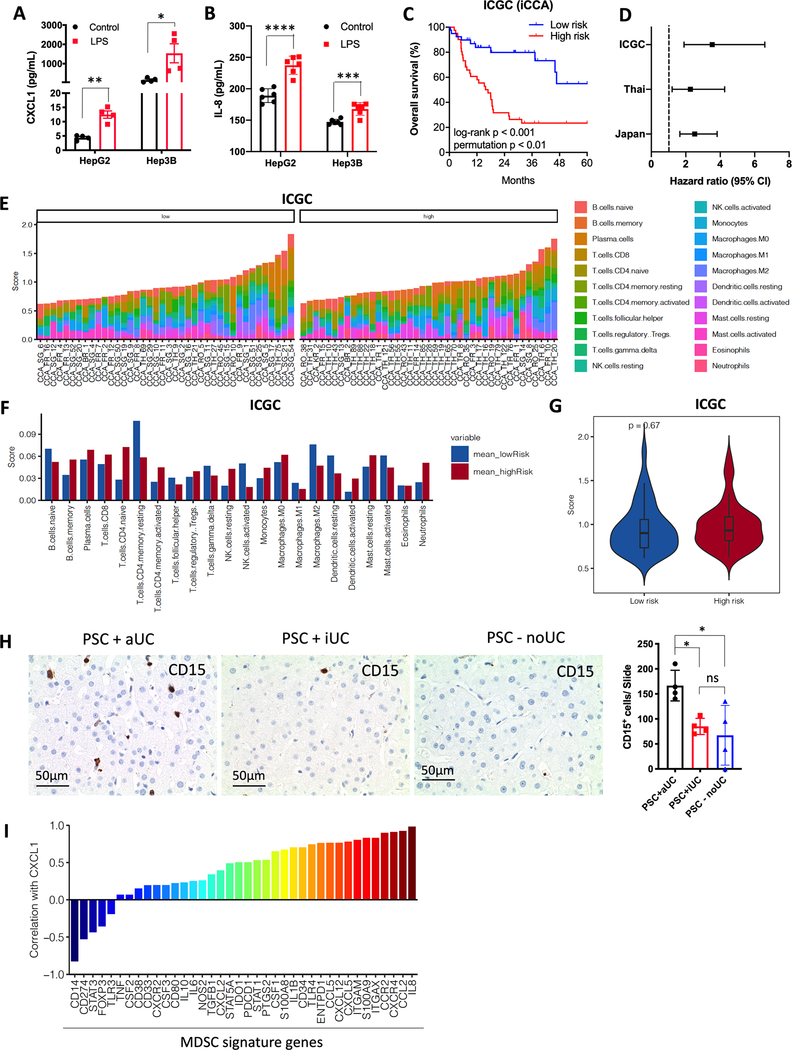
Gut dysbiosis is commonly observed in patients with cirrhosis and chronic gastrointestinal disorders; however, its effect on antitumor immunity in the liver is largely unknown. Here we studied how the gut microbiome affects antitumor immunity in cholangiocarcinoma. Primary sclerosing cholangitis (PSC) or colitis, two known risk factors for cholangiocarcinoma which promote tumor development in mice, caused an accumulation of CXCR2+ polymorphonuclear myeloid-derived suppressor cells (PMN-MDSC). A decrease in gut barrier function observed in mice with PSC and colitis allowed gut-derived bacteria and lipopolysaccharide to appear in the liver and induced CXCL1 expression in hepatocytes through a TLR4-dependent mechanism and an accumulation of CXCR2+ PMN-MDSCs. In contrast, neomycin treatment blocked CXCL1 expression and PMN-MDSC accumulation and inhibited tumor growth even in the absence of liver disease or colitis. Our study demonstrates that the gut microbiome controls hepatocytes to form an immunosuppressive environment by increasing PMN-MDSCs to promote liver cancer. SIGNIFICANCE: MDSCs have been shown to be induced by tumors and suppress antitumor immunity. Here we show that the gut microbiome can control accumulation of MDSCs in the liver in the context of a benign liver disease or colitis.See related commentary by Chagani and Kwong, p. 1014.This article is highlighted in the In This Issue feature, p. 995.


Figures

Figure 1.
Figure 1.
PSC and colitis cause a leaky gut and bacterial translocation. (A) BDL was performed in C57BL/6 mice. Two weeks later, stool samples from BDL and control (Ctr) mice were collected for 16s rRNA sequencing. n=5 for Ctr and BDL. Bar plots of the order levels in BDL and Ctr mice are shown. Relative abundance is plotted for each mouse. (B) BDL was performed in C57BL/6 mice. Two weeks later, duodenum, jejunum, ileum, cecum and colon were collected for immunochemistry (IHC). Representative IHC samples for Occludin are shown. (C) BDL was performed in C57BL/6 mice. Two weeks later duodenum, jejunum, ileum, cecum and colon were collected for RT-PCR. The relative mRNA expression analysis for IL-1β, IL-17 and IFN-γ was performed. n=5 for Ctr and BDL. Data represent mean ± SEM. *p<0.05, **p<0.01, ****p<0.0001, two-way ANOVA. (D) Quantitative real time PCR for relative 16s rRNA in portal vein blood of Ctr and BDL mice. n=5 for Ctr and BDL. Data represent mean ± SEM. ***p<0.001, Student’s t test. (E) Quantitative real time PCR for relative 16s rRNA levels in portal vein blood of Ctr and Mdr2−/− mice. n=5 for Ctr and Mdr2-/−. Data represent mean ± SEM. **p<0.01, Student’s t test. (F) Bile duct ligation (BDL) was performed in C57BL/6 mice. Two weeks later, BDL and control (Ctr) mice received 440mg/kg body weight FITC-Dextran by oral gavage. Four hours later, blood was collected. The concentration of FITC-Dextran was measured in blood. n=5 for Ctr and BDL. Data represent mean ± SEM. ****p<0.0001, Student’s t test. (G) Ten-week old VBN/J control (Ctr) and Mdr2−/− mice received 440mg/kg body weight FITC-Dextran by oral gavage. Four hours later, blood was collected. The concentration of FITC-Dextran was measured. n=5 for Ctr and Mdr2-/−. Data represent mean ± SEM. ***p<0.001, Student’s t test.
Figure 2.
Figure 2.
LPS/TLR4 induces MDSC accumulation in the liver. (A) Two weeks after BDL, the absolute number of hepatic M-myeloid, PMN-myeloid and total myeloid were determined in BDL and control (Ctr) mice. n=4 for Ctr and BDL. Data represent mean ± SEM. **** p<0.0001, two-way ANOVA. (B) The absolute numbers of hepatic M-myeloid, PMN-myeloid and total myeloid were determined in FVBN/J control (Ctr) and Mdr2−/− mice at the age of 10 week. n=4 for Ctr, 5 for Mdr2-/−. Data represent mean ± SEM. ** p<0.01, two-way ANOVA. (C) Immunochemistry of Ly6G in liver of Ctr or Mdr2−/− mice at the age of 10 week. (D) Inhibition of T cell proliferation by myeloid cells was assessed by flow cytometry of T cells in co-culture experiments. Hepatic CD11b+Gr-1+ myeloid cells were purified from control (Ctr) or BDL mice. Splenic T cells (T) were isolated from normal C57BL/6 mice. T cells were labeled with CFSE and activated using anti-CD3ε/ anti-CD28. Myeloid cells and T cells were co-cultured at different ratios. The percentage of diluted CFSE after 72 hours co-culture was measured by FACS. Data represent mean ± SEM. ** p<0.01, two-way ANOVA. (E) The absolute numbers of hepatic M-MDSC, PMN-MDSC and total MDSC were determined in C57BL/6 mice after 1 cycle of DSS treatment (2.5% DSS in drinking water for 1 week, followed by regular water for 2 weeks). n=6 for H2O, 7 for DSS. Data represent mean ± SEM. **** p<0.0001, two-way ANOVA. (F) Immunochemistry of Ly6G in H2O or DSS treated liver tissues. Ly6G+ cells in each field were counted by a blinded investigator. n=11 for H2O, 13 for DSS. Data represent mean ± SEM. **** p<0.0001, Student’s t test. (G) C57BL/6 mice were treated with H2O (Ctr), Vancomycin (Vanco), or Neomycin for 3 weeks before stool samples were collected for 16s rRNA sequencing. n=5 for Ctr and BDL. Bar plots of the order levels in BDL and Ctr mice are shown. Relative abundance is plotted for each mouse. (H) C57BL/6 mice received Neomycin for 2 weeks prior to BDL (BDL+Neo). Two weeks after BDL, the absolute numbers of hepatic M-MDSC, PMN-MDSC and MDSC were determined. n=5 for BDL and BDL+Neo. Data represent mean ± SEM. **** p<0.0001, two-way ANOVA. (I) C57BL/6 germ free mice were colonized with stool samples from mice treated with vancomycin (Vanco Stool) or neomycin (Neo Stool) for 3 weeks by oral gavage. Two weeks later, mice were sacrificed and the absolute numbers of hepatic M-MDSC, PMN-MDSC and MDSC were determined. n=5 for Control, Vanco stool, and Neo stool. Data represent mean ± SEM. *p<0.05, **p<0.01, ***p<0.001, two-way ANOVA. (J) Bile duct ligation (BDL) was performed in C57BL/6 mice. Two weeks later, the concentration of endotoxin in portal vein was detected. n=5 for Ctr and BDL. Data represent mean ± SEM. **p<0.01, Student’s t test. (K) C57BL/6 mice received H2O, DSS, Neo, and DSS+Neo for 7 days. The concentration of endotoxin in portal vein was detected. n=5 for H2O, DSS, Neo, and DSS+Neo. Data represent mean ± SEM. **p<0.01, ***p<0.001, one-way ANOVA. (L) PBS or 2.5mg/kg LPS was i.p. injected in Tlr4−/− or C57BL/6 wildtype (WT) mice. Three days later, the absolute numbers of M-MDSC, PMN-MDSC and total MDSC were determined. Data represent mean ± SEM. n=6 for PBS and 7 for LPS in WT mice, n=6 for PBS and LPS in Tlr4−/− mice. ns, no significant. ****p<0.0001, two-way ANOVA. (M) WT or Tlr4−/− C57BL/6 mice were treated with H2O or 2.5 % DSS for 1 cycle. The absolute numbers of M-MDSC, PMN-MDSC and total MDSC were determined. Data represent mean ± SEM. n=7 for H2O and DSS in WT mice, n=7 for PBS and 8 for LPS in Tlr4−/− mice. ns, no significant. ****p<0.0001, two-way ANOVA.
Figure 3.
Figure 3.
Hepatocytes mediate MDSC accumulation via LPS/TLR4/CXCL1. (A) Representative CXCR2 staining of hepatic M-MDSC and PMN-MDSC cells from three independent experiments. (B) Absolute numbers of CXCR2+ cells in liver of control and BDL mice. Data represent mean ± SEM. n=4 for Ctr and BDL. ***p<0.001, Student’s t test. (C) Absolute numbers of CXCR2+ cells in liver of H2O and DSS treated mice. Data represent mean ± SEM. n=5 for H2O and DSS. ***p<0.001, Student’s t test. (D) Representative flow cytometry analysis of CXCR2+ infiltrating mononuclear cells in liver from three independent experiments. (E) Composition of CXCR2+ infiltrating mononuclear cells in liver of control or BDL mice. Data represent pooled results from three experiments. (F) CXCL1 mRNA expression levels were detected in liver tissues of control or BDL mice. n=5 for Ctr and BDL. Data represent mean ± SEM. ****p<0.0001, Student’s t test. (G) Hydrodynamic injection of CXCL1 plasmid in C57BL/6 mice. The absolute numbers of PMN-MDSCs was determined 7 days later. n=5 for PBS and CXCL1. Data represent mean ± SEM. **p<0.01, Student’s t test. (H) C57BL/6 mice were treated with 2.5% DSS for 7days. CXCL1 neutralization antibody or isotype control at 4 mg/kg was injected i.v. on day 5, 7 and 9. The mice were sacrificed at day 11. The absolute numbers of M-MDSC, PMN-MDSC and total MDSC were determined. Data represent mean ± SEM. n=4 for Iso and a-CXCL1. *p<0.05, two-way ANOVA. (I) BDL was performed in C57BL/6 mice and the mice were treated with vehicle or SB225002 (10mg/kg, i.p. every other day). The absolute numbers of hepatic M-MDSC, PMN-MDSC and total MDSC was determined. n=5 for Vehicle and SB225002. Data represent mean ± SEM. ** p<0.01, two-way ANOVA. (J) 2.5mg/kg LPS or saline was injected i.p. into Tlr4−/− or wild type (WT) mice. Three days later, CXCL1 mRNA levels in whole liver tissues were detected by real-time PCR. n=6 for each group. Data represent mean ± SEM. ns, no significant. ****p<0.0001, one-way ANOVA. (K) Hepatocytes were isolated from Tlr4−/− or wild type (WT) mice. Then, hepatocytes were incubated with 100ng/ml LPS overnight. CXCL1 mRNA levels in hepatocytes was determined by real-time PCR. n=6 for each group. Data represent mean ± SEM. ns, no significant. ****p<0.0001, one-way ANOVA. (L) C57BL/6 mice were treated with H2O or 2.5% DSS for 1cycle. Macrophage, LSEC, HSC and hepatocytes were isolated for RT-PCR to detect CXCL1 mRNA levels. n=5 for H2O and DSS. Data represent mean ± SEM. ****p<0.0001, two-way ANOVA. (M) C57BL/6 mice (WT) or Tlr4−/− mice (KO) were lethally irradiated with 900 rad, followed by i.v. injection with 2×10⁷ bone marrow cells from WT or KO mice. Six weeks later, the mice were treated with H2O or 2.5% DSS for 1cycle. Then, mice were sacrificed for M-MDSC, PMN-MDSC and total MDSC detection. n=3 for WT to WT+ H2O, WT to KO+ H2O, KO to WT+ H2O, KO to KO+ H2O, n=7 for WT to WT+ DSS, WT to KO+ DSS, KO to WT+ DSS, KO to KO+ DSS. Data represent mean ± SEM. ns, no significant. *p<0.05, **p<0.01, two-way ANOVA. (N and O) C57BL/6 mice (WT) were treated with H2O or 2.5% DSS for 1cycle, Alb-Cre-; Tlr4 f/f (Tlr4LWT) and Alb-Cre+;Tlr4f/f (Tlr4LKO) mice were treated with 2.5% DSS for 1cycle. Then, mice were sacrificed for hepatic M-MDSC, PMN-MDSC and total MDSC detection (N) and CXCL1 mRNA levels in whole liver tissues (O). n=3 for WT+ H2O and WT+ DSS, n=5 for Tlr4LWT+DSS and Tlr4LKO+DSS. Data represent mean ± SEM. **p<0.01, two-way ANOVA.
Figure 4.
Figure 4.
PSC and colitis promote cholangiocarcinoma. (A) C57BL/6 mice were used to induce cholangiocarcinoma via hydrodynamic injection of AKT and YAP. One week later, BDL was performed on the mice. Mice were sacrificed 3 weeks after BDL. Representative liver images and H&E staining are shown. Microscopic tumors were counted. n=5 for Ctr and BDL. Data represent mean ± SEM. **p<0.01, **** p<0.0001, Student’s t test. (B) Intrahepatic injection using 3×10⁵ LD1 cell line were performed on C57BL/6 mice, followed by BDL. Two weeks later, the mice were sacrificed. Representative liver images and tumor images were shown. Tumor weight were detected. The ratio of tumor weight in whole liver weight was measured. n=4 for LD1 and LD1+BDL. Data represent mean ± SEM. *p<0.05, Student’s t test. (C) FVBN/J (Ctr) or Mdr2−/− mice at 10 weeks were used to induce cholangiocarcinoma via hydrodynamic injection of AKT and YAP. Mice were sacrificed 7 weeks after injection. Representative liver images and H&E staining are shown. Microscopic tumors were counted. n=6 for Ctr and Mdr2-/−. Data represent mean ± SEM. **** p<0.0001, Student’s t test. (D) C57BL/6 mice were used to induce cholangiocarcinoma via hydrodynamic injection of AKT and YAP. One week later, the mice were treated with 2.5% DSS in drinking water for 1 week, followed by regular water for 2 weeks (1 cycle). Mice were sacrificed after 2 cycles DSS treatment. Representative liver images and H&E staining are shown. Microscopic tumors were counted. n=9 for H2O, 8 for DSS. Data represent mean ± SEM. **** p<0.0001, Student’s t test. (E) C57BL/6 mice were used to induce cholangiocarcinoma via hydrodynamic injection of AKT and NICD1. One week later, the mice were treated with 2.5% DSS in drinking water for 1 week, followed by regular water for 2 weeks (1 cycle). Mice were sacrificed after 2 cycles DSS treatment. Representative liver images and H&E staining are shown. Microscopic tumors were counted. n=18 for H2O,18 for DSS. Data represent mean ± SEM. *p<0.05, **** p<0.0001, Student’s t test.
Figure 5.
Figure 5.
CXCL1/CXCR2/MDSC/NK axis regulates liver cancer development. (A) AKT+ NICD1 tumor bearing C57BL/6 mice with DSS-colitis were treated with isotype control (ISO) or anti-Ly6G antibody (1A8) (200 μg, i.p. every other day). Microscopic tumors were counted after 2 cycles of DSS treatment. Data represent mean ± SEM. n=10 for ISO an 1A8. **** p<0.0001, Student’s t test. (B) CXCL1 overexpression in cholangiocarcinoma was induced by hydrodynamic injection using AKT+NICD1+CXCL1 (CXCL1). Hydrodynamic injection using AKT+NICD1 was used as control (Ctr). Microscopic tumors were counted after 7 weeks. Data represent mean ± SEM. n=8 for Ctr and CXCL1. ****p<0.0001, Student’s t test. (C) C57BL/6 mice were used to induce cholangiocarcinoma via hydrodynamic injection of AKT and YAP. Mice were treated with CXCL1 neutralization antibody (a-CXCL1) or isotype (ISO) control (4 mg/kg, i.v.) and sacrificed after 2 cycles DSS treatment. The microscopic tumors were counted. Data represent mean ± SEM. n=5 for Iso, 4 for a-CXCL1. ***p<0.001, Student’s t test. (D) Cholangiocarcinoma was induced via hydrodynamic injection of AKT+ NICD1, followed by 2 cycles DSS treatment. Mice were treated with vehicle or SB225002 (10mg/kg, i.p. every other day). Microscopic tumors were counted. Data represent mean ± SEM. n=6 for Vehicle and SB225002. **** p<0.0001, Student’s t test. (E, F and G) Cholangiocarcinoma was induced via hydrodynamic injection of AKT+ NICD1. Mice were treated with anti-CD4, anti-CD8 or NK depletion antibodies and killed after 2 cycles DSS treatment. Microscopic tumors were counted. n=5 for CD8 depletion in DSS-treated mice, 4 for some other groups. Data represent mean ± SEM. *p<0.05, **p<0.01, ***p<0.001, two-way ANOVA.
Figure 6.
Figure 6.
Gut microbiome directs hepatocytes to control cholangiocarcinoma. (A, B and C) Cholangiocarcinoma was induced by hydrodynamic injection of AKT+YAP and mice were treated with Neomycin. One week later, BDL was performed. Control (Ctr), BDL, neomycin (Neo) and BDL+ neomycin (BDL+Neo) mice were sacrificed 3 weeks after BDL (A). Representative H&E staining of livers are shown (B). Microscopic tumors (C) were counted. n=5 for each group. Data represent mean ± SEM. ***p<0.001, one-way ANOVA. (D, E, F and G) C57BL/6 mice were treated with an antibiotics cocktail (0.5g/L vancomycin, 0.5g/L neomycin, and 0.5g/L primaxin) for 3 weeks, followed by oral gavage of cecum stool samples derived from mice treated for 3 weeks with Vancomycin (Vanco Stool) or Neomycin (Neo Stool). Two weeks later (Week 5), intrahepatic injection of 3×10⁵ RIL175 cells was performed and mice were sacrificed at week 8 (D). Representative tumors are shown (E). Tumor weight (F) and the ratio of tumor in whole liver (G) are shown. n=6 for Vanco Stool, 7 for Neo Stool. Data represent mean ± SEM. *p<0.05, Student’s t test. (H and I) Tlr4−/− mice were used to induce cholangiocarcinoma via hydrodynamic injection of AKT and YAP, then treated with H2O or DSS for 2 cycles (H). The microscopic tumors and liver weight (I) were determined. Data represent mean ± SEM. n=9 for H2O, 8 for DSS. ns, no significant, Student’s t test. (J, K and L). Alb-Cre+;Tlr4f/f (Tlr4LKO) or Alb-Cre-;Tlr4f/f (Tlr4LWT) mice were used to induce cholangiocarcinoma via hydrodynamic injection of AKT+YAP, or AKT+YAP plus or without CXCL1. Mice were sacrificed after 2 cycles DSS treatment (J). Representative H&E staining are shown (K). Microscopic tumors were counted (L). n=5 for Tlr4LWT, 4 for Tlr4LKO and Tlr4LKO+CXCL1. Data represent mean ± SEM. *p<0.05, ****p<0.0001, two-way ANOVA.
Figure 7.
Figure 7.
TLR4 gene signatures are associate with poor survival of cholangiocarcinoma patients. (A and B) Human HepG2 or Hep3B cell line was stimulated with 100ng/ml LPS overnight. CXCL1 (A) and IL-8 (B) concentrations in supernatant were determined by ELISA. Data represent mean ± SEM. *p<0.05, **p<0.01, ***p<0.001, ****p<0.0001, one-way ANOVA. (C) Total of 81 intrahepatic cholangiocarcinoma (iCCA) cases were divided into two groups (low-risk and high-risk) according to the expression of Tlr4 activation-associated genes. Log-rank (Mantel-Cox) test was performed to detect overall survival of the two groups. log-rank p value and permutation p value are provided. (D) Hazard ratio with 95% confidence interval (CI) for the three cohorts ICGC, Thai, and Japan are shown. (E, F and G) CIBERSORT was applied to estimate the abundance of different immune cells based on TLR4 gene expression level. The abundance of different immune cell in each iCCA patient are shown (E). The abundance of different immune cell in low-risk and high-risk iCCA patient are shown (F). The overall abundance of immune cells in low-risk and high-risk groups are shown (G). (H) Immunochemistry of CD15 in liver tissues of patients with PSC+aUC, PSC+iUC, or PSC-noUC. The sum of CD15+ cells from 10 slides was calculated. Data represent mean ± SEM. *p<0.05, one-way ANOVA. (I) The correlation of CXCL1 expression with MDSC signature gene was analyzed using the published GEO DataSets (GSE118373).

Comment in

References

    1. Gopalakrishnan V, Spencer CN, Nezi L, Reuben A, Andrews MC, Karpinets TV, et al. Gut microbiome modulates response to anti-PD-1 immunotherapy in melanoma patients. Science 2018;359(6371):97–103 doi 10.1126/science.aan4236. - DOI - PMC - PubMed
    1. Routy B, Le Chatelier E, Derosa L, Duong CPM, Alou MT, Daillere R, et al. Gut microbiome influences efficacy of PD-1-based immunotherapy against epithelial tumors. Science (New York, NY) 2018;359(6371):91–7 doi 10.1126/science.aan3706. - DOI - PubMed
    1. Matson V, Fessler J, Bao R, Chongsuwat T, Zha Y, Alegre ML, et al. The commensal microbiome is associated with anti-PD-1 efficacy in metastatic melanoma patients. Science (New York, NY) 2018;359(6371):104–8 doi 10.1126/science.aao3290. - DOI - PMC - PubMed
    1. Peterson LW, Artis D. Intestinal epithelial cells: regulators of barrier function and immune homeostasis. Nat Rev Immunol 2014;14(3):141–53 doi 10.1038/nri3608. - DOI - PubMed
    1. Szabo G Gut-liver axis in alcoholic liver disease. Gastroenterology 2015;148(1):30–6 doi 10.1053/j.gastro.2014.10.042. - DOI - PMC - PubMed

Publication types

LinkOut - more resources