. 2021 Feb 19;371(6531):eabd9338.
doi: 10.1126/science.abd9338. Epub 2020 Dec 15.

Inferring the effectiveness of government interventions against COVID-19

Affiliations

Inferring the effectiveness of government interventions against COVID-19

Jan M Brauner et al. Science. .

Abstract

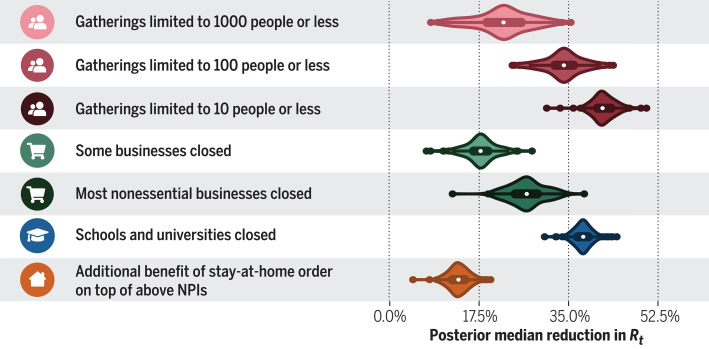
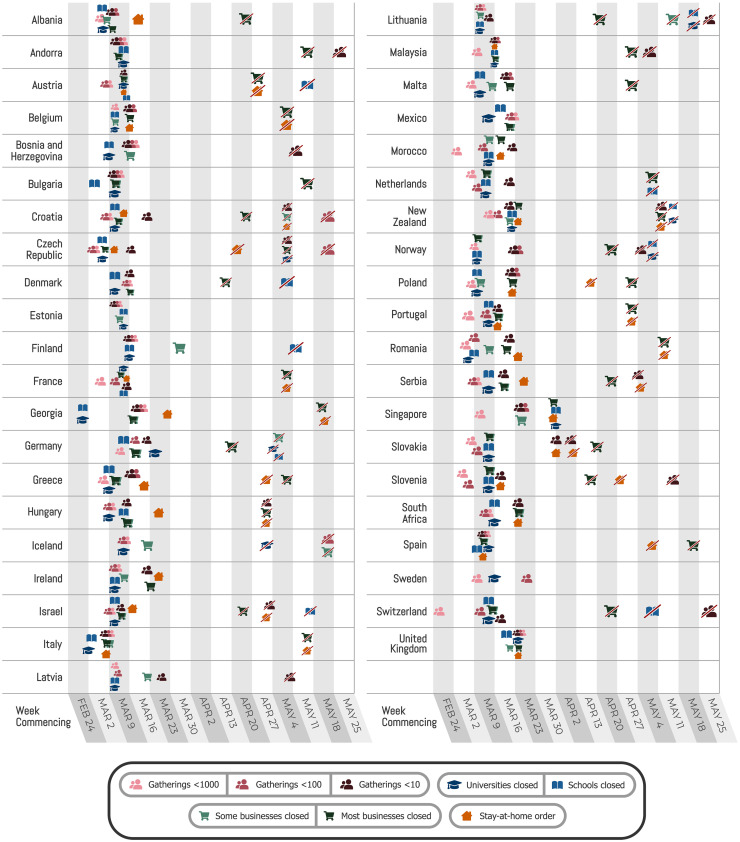
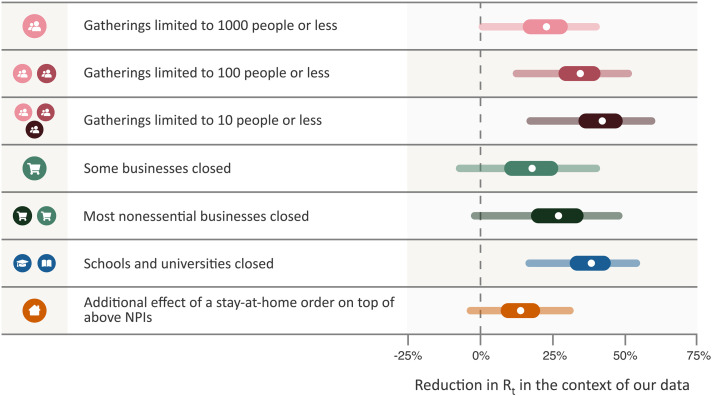
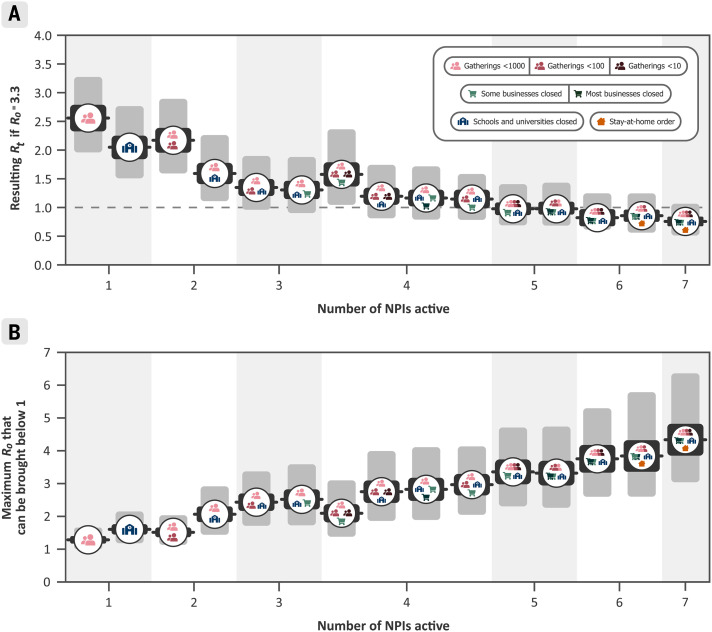
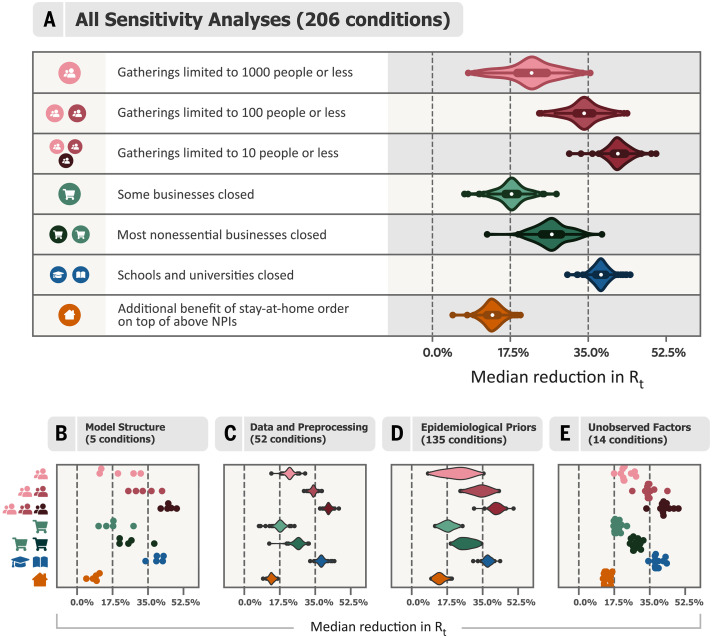
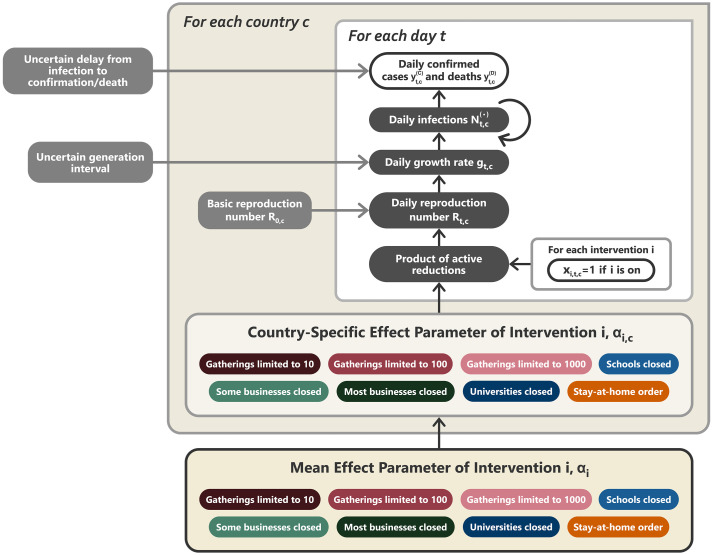
Governments are attempting to control the COVID-19 pandemic with nonpharmaceutical interventions (NPIs). However, the effectiveness of different NPIs at reducing transmission is poorly understood. We gathered chronological data on the implementation of NPIs for several European and non-European countries between January and the end of May 2020. We estimated the effectiveness of these NPIs, which range from limiting gathering sizes and closing businesses or educational institutions to stay-at-home orders. To do so, we used a Bayesian hierarchical model that links NPI implementation dates to national case and death counts and supported the results with extensive empirical validation. Closing all educational institutions, limiting gatherings to 10 people or less, and closing face-to-face businesses each reduced transmission considerably. The additional effect of stay-at-home orders was comparatively small.


Figures

None
Median intervention effectiveness estimates across a suite of 206 analyses with different epidemiological parameters, data, and modeling assumptions.
Bayesian inference using a semimechanistic hierarchical model with observed national case and death data across 41 countries between January and May 2020 is used to infer the effectiveness of several nonpharmaceutical interventions. Although precise effectiveness estimates depend on the assumed data and parameters, there are clear trends across the experimental conditions. Violins show kernel density estimates of the posterior median effectiveness across the sensitivity analysis. Rt, instantaneous reproduction number.
Fig. 1
Fig. 1. Timing of NPI implementations in early 2020.
Crossed-out icons signify when an NPI was lifted. Detailed definitions of the NPIs are given in Table 1.
Fig. 2
Fig. 2. NPI effectiveness under default model settings.
Posterior percentage reductions in Rt with median, 50%, and 95% prediction intervals shown. Prediction intervals reflect many sources of uncertainty, including NPI effectiveness varying by country and uncertainty in epidemiological parameters. A negative 1% reduction refers to a 1% increase in Rt. “Schools and universities closed” shows the joint effect of closing both schools and universities; the individual effect of closing just one will be smaller (see text). Cumulative effects are shown for hierarchical NPIs (gathering bans and business closures), that is, the result for “Most nonessential businesses closed” shows the cumulative effect of two NPIs with separate parameters and icons—closing some (high-risk) businesses, and additionally closing most remaining (non-high-risk but nonessential) businesses given that some businesses are already closed.
Fig. 3
Fig. 3. Combined NPI effectiveness for the 15 most commonly implemented sets of NPIs in our data.
Black and gray bars denote 50% and 95% Bayesian prediction intervals, respectively. (A) Predicted Rt after implementation of each set of NPIs, assuming R0 = 3.3. (B) Maximum R0 that can be reduced to Rt below 1 by common sets of NPIs. Readers can interactively explore the effects of all sets of NPIs, while setting R0 and adjusting NPI effectiveness to local circumstances, with our online mitigation calculator (16).
Fig. 4
Fig. 4. Median NPI effectiveness across the sensitivity analyses.
(A) Median NPI effectiveness (reduction in Rt) when varying different components of the model or the data in 206 experimental conditions. Results are displayed as violin plots, using kernel density estimation to create the distributions. Inside the violins, the box plots show median and interquartile range. The vertical lines mark 0, 17.5, and 35% (see text). (B to E) Categorized sensitivity analyses. (B) Sensitivity to model structure. Using only cases or only deaths as observations (two experimental conditions; fig. S7); varying the model structure (three conditions; fig. S8, left). (C) Sensitivity to data and preprocessing. Leaving out countries from the dataset (42 conditions; figs. S5 and S21); varying the threshold below which cases and deaths are masked (eight conditions; fig. S13); sensitivity to correcting for undocumented cases and to country-level differences in case ascertainment (two conditions; fig. S6). (D) Sensitivity to epidemiological parameters. Jointly varying the means of the priors over the means of the generation interval, the infection-to-case-confirmation delay, and the infection-to-death delay (125 conditions; fig. S10); varying the prior over R0 (four conditions; fig. S11); varying the prior over NPI effect parameters (three conditions; fig. S11); varying the prior over the degree to which NPI effects vary across countries (three conditions; fig. S12). (E) Sensitivity to unobserved factors influencing Rt. Excluding observed NPIs one at a time (eight conditions; fig. S9); controlling for additional NPIs from a different dataset (six conditions; fig. S9).
Fig. 5
Fig. 5. Model overview.
Unshaded, white nodes are observed. From bottom to top: The mean effect parameter of NPI i is αi, and the country-specific effect parameter is αi,c. On each day t, a country’s daily reproduction number Rt,c depends on the country’s basic reproduction number R0,c and the active NPIs. The active NPIs are encoded by xi,t,c, which is 1 if NPI i is active in country c at time t, and 0 otherwise. Rt,c is transformed into the daily growth rate gt,c using the generation interval parameters and subsequently is used to compute the new infections Nt,c(C) and Nt,c(D) that will subsequently become confirmed cases and deaths, respectively. Finally, the expected numbers of daily confirmed cases yt,c(C) and deaths yt,c(D) are computed using discrete convolutions of Nt,c(.) with the relevant delay distributions. Our model uses both case and death data; it splits all nodes above the daily growth rate gt,c into separate branches for deaths and confirmed cases. We account for uncertainty in the generation interval, infection-to–case confirmation delay, and the infection-to-death delay by placing priors over the parameters of these distributions.

References

    1. Flaxman S., Mishra S., Gandy A., Unwin H. J. T., Mellan T. A., Coupland H., Whittaker C., Zhu H., Berah T., Eaton J. W., Monod M., Ghani A. C., Donnelly C. A., Riley S., Vollmer M. A. C., Ferguson N. M., Okell L. C., Bhatt S.; Imperial College COVID-19 Response Team , Estimating the effects of non-pharmaceutical interventions on COVID-19 in Europe. Nature 584, 257–261 (2020). 10.1038/s41586-020-2405-7 - DOI - PubMed
    1. Dehning J., Zierenberg J., Spitzner F. P., Wibral M., Neto J. P., Wilczek M., Priesemann V., Inferring change points in the spread of COVID-19 reveals the effectiveness of interventions. Science 369, eabb9789 (2020). 10.1126/science.abb9789 - DOI - PMC - PubMed
    1. Hsiang S., Allen D., Annan-Phan S., Bell K., Bolliger I., Chong T., Druckenmiller H., Huang L. Y., Hultgren A., Krasovich E., Lau P., Lee J., Rolf E., Tseng J., Wu T., The effect of large-scale anti-contagion policies on the COVID-19 pandemic. Nature 584, 262–267 (2020). 10.1038/s41586-020-2404-8 - DOI - PubMed
    1. Lai S., Ruktanonchai N. W., Zhou L., Prosper O., Luo W., Floyd J. R., Wesolowski A., Santillana M., Zhang C., Du X., Yu H., Tatem A. J., Effect of non-pharmaceutical interventions to contain COVID-19 in China. Nature 585, 410–413 (2020). 10.1038/s41586-020-2293-x - DOI - PMC - PubMed
    1. Y. Liu, C. Morgenstern, J. Kelly, R. Lowe, CMMID COVID-19 Working Group, M. Jit, The impact of non-pharmaceutical interventions on SARS-CoV-2 transmission across 130 countries and territories. medRxiv 2020.08.11.20172643v1 [Preprint]. 12 August 2020. 10.1101/2020.08.11.20172643. - DOI - PMC - PubMed