. 2020 Dec 29;117(52):33186-33196.
doi: 10.1073/pnas.2006521117. Epub 2020 Dec 15.

Transcriptional readout of neuronal activity via an engineered Ca2+-activated protease

Affiliations

Transcriptional readout of neuronal activity via an engineered Ca2+-activated protease

Mateo I Sanchez et al. Proc Natl Acad Sci U S A. .

Abstract

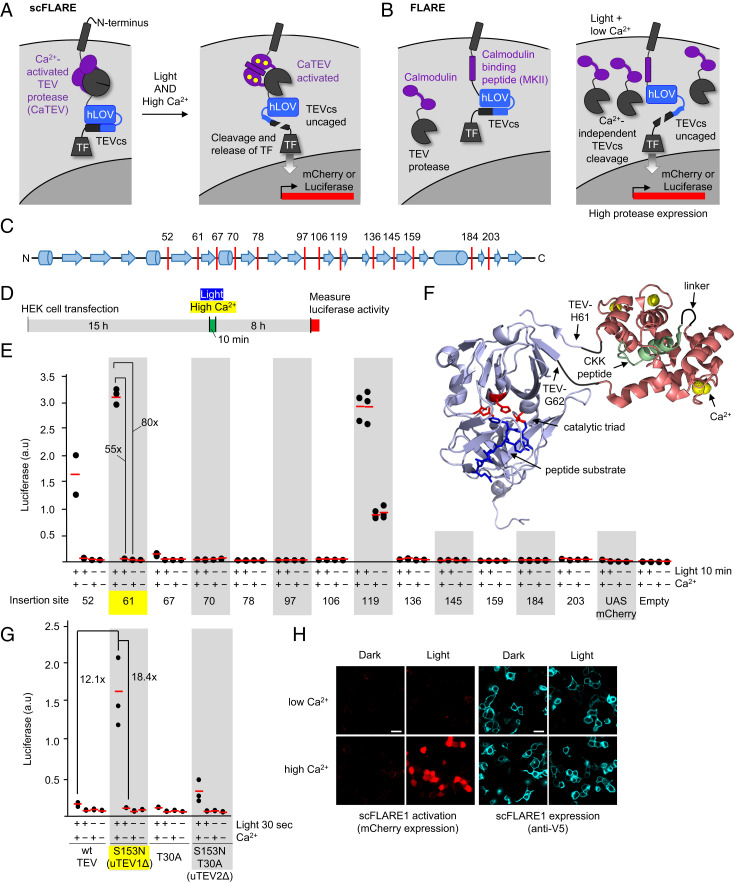
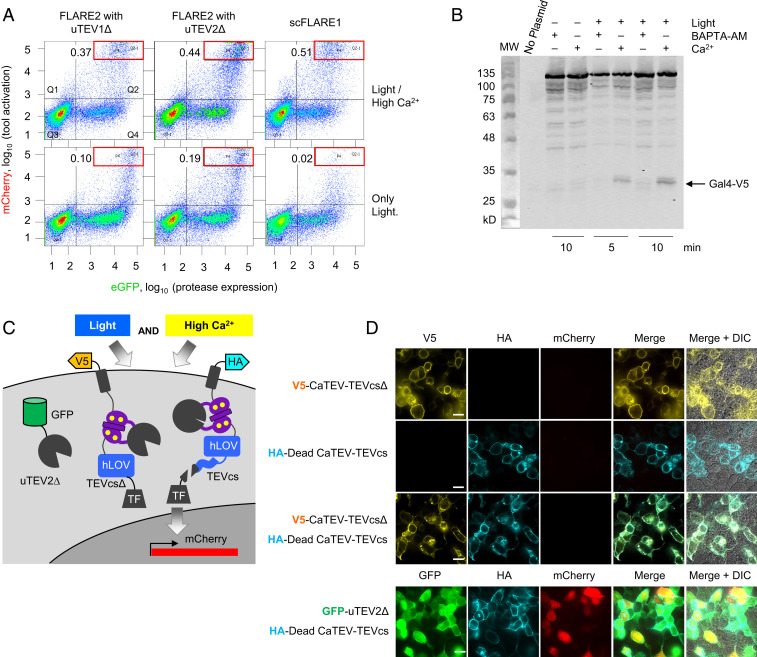
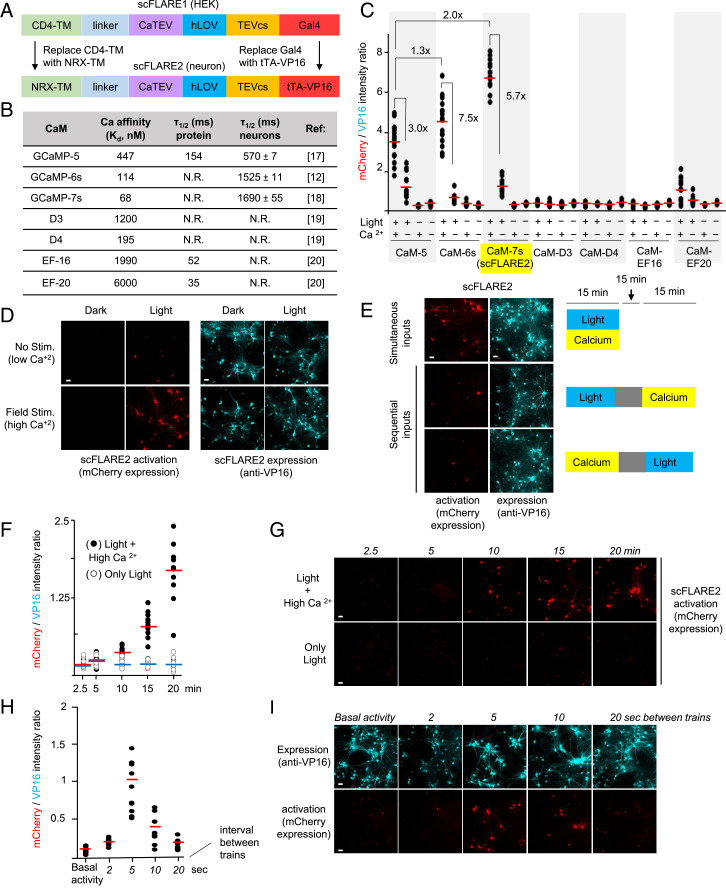
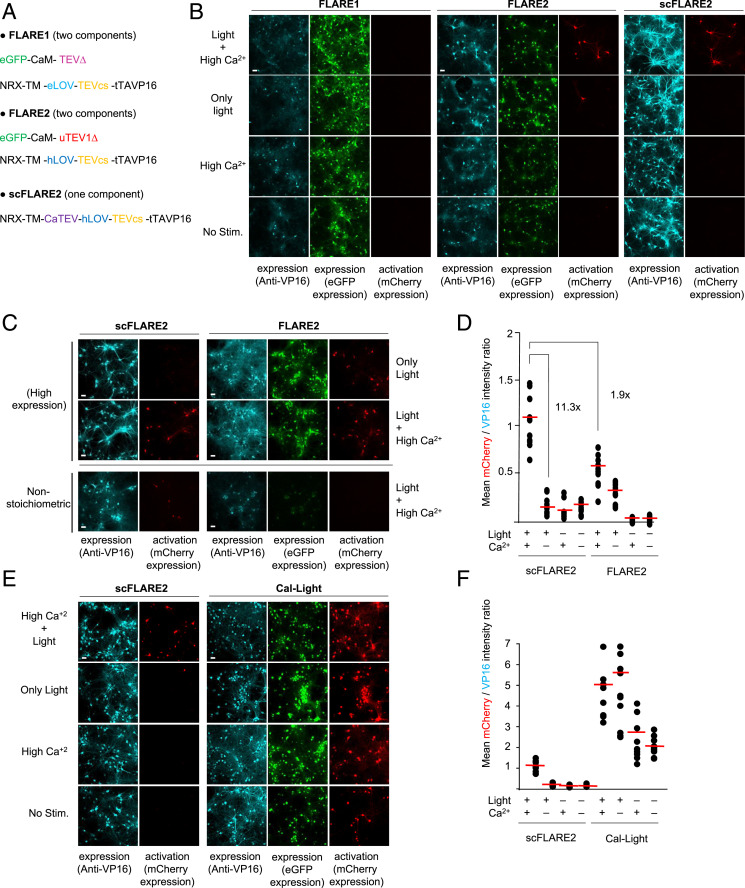
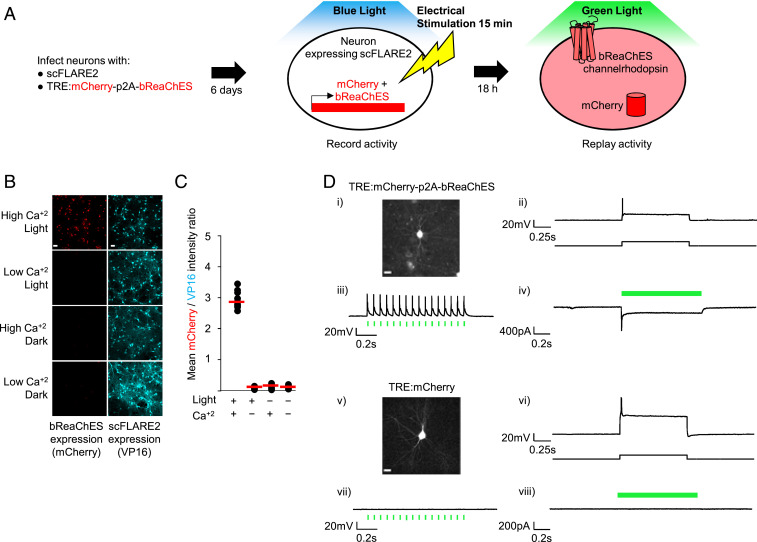
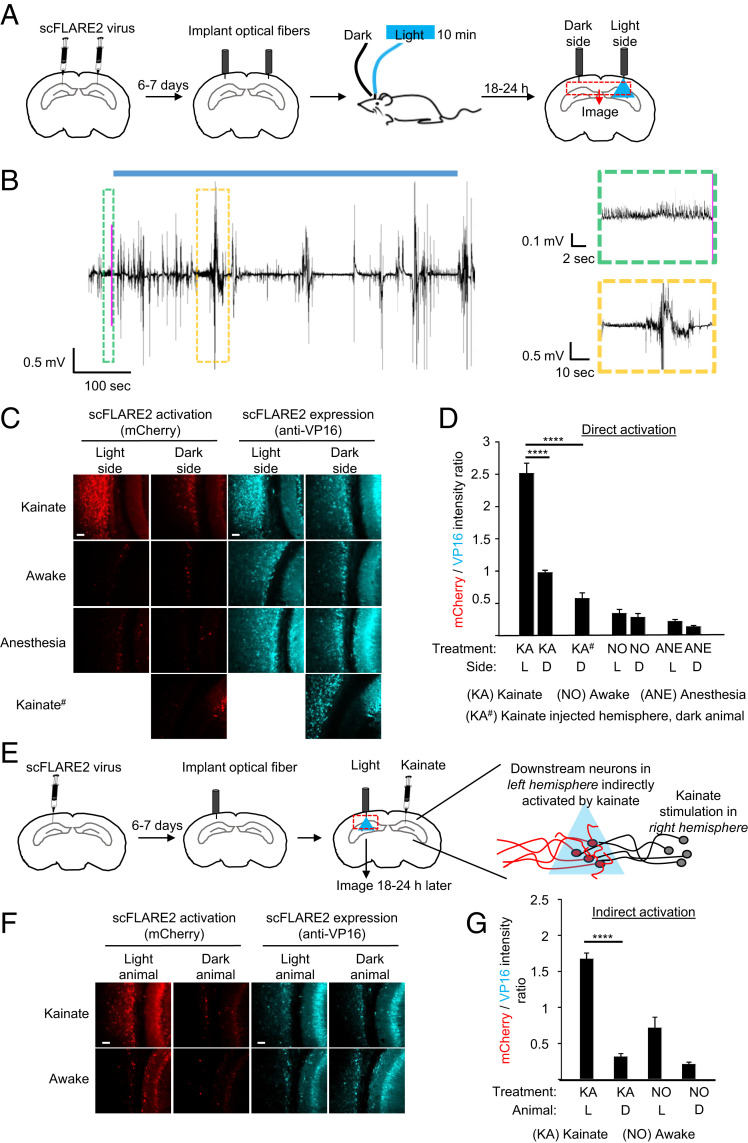
Molecular integrators, in contrast to real-time indicators, convert transient cellular events into stable signals that can be exploited for imaging, selection, molecular characterization, or cellular manipulation. Many integrators, however, are designed as complex multicomponent circuits that have limited robustness, especially at high, low, or nonstoichiometric protein expression levels. Here, we report a simplified design of the calcium and light dual integrator FLARE. Single-chain FLARE (scFLARE) is a single polypeptide chain that incorporates a transcription factor, a LOV domain-caged protease cleavage site, and a calcium-activated TEV protease that we designed through structure-guided mutagenesis and screening. We show that scFLARE has greater dynamic range and robustness than first-generation FLARE and can be used in culture as well as in vivo to record patterns of neuronal activation with 10-min temporal resolution.

Keywords: neuroscience; proteases; protein engineering.


Conflict of interest statement

Competing interest statement: A.Y.T. and M.I.S. have filed a patent covering some components used in this study (U.S. provisional application 62/906,373; CZB file CZB-123S-P1; Stanford file S19-269; KT file 103182-1132922-002400PR).

Figures

Fig. 1.
Fig. 1.
Engineering of CaTEV and incorporation into scFLARE. (A) Schematic of scFLARE. From N to C terminus, scFLARE consists of a transmembrane helix, a CaTEV, an LOV domain, a TEV cleavable site (TEVcs), and a TF. High Ca2+ activates the protease, while light alters the conformation of LOV to expose the TEVcs for cleavage. Both light and calcium must arrive coincidentally to enable proteolytic release of the TF, which translocates to the nucleus to drive expression of the reporter gene of choice. (B) The previous two-component FLARE (6, 16) gives background at high protease expression levels. When the FLARE protease copy number is high, TEVcs cleavage can occur under the light + low-Ca2+ condition because of proximity-independent recognition of TEVcs by TEV protease. (C) The domain structure of TEV protease (from Protein Data Bank (PDB) ID: 1LVM) showing loop regions we targeted for insertion (red lines) of Ca2+-sensing modules. (D) The protocol for screening CaTEV variants in the context of scFLARE in HEK 293T cells. Ca2+ was elevated by the addition of 6 mM CaCl2 in the presence of 2 μM ionomycin. Blue light (467 nm) was delivered at 60 mW/cm2 and 33% duty cycle (2 s of light every 6 s). (E) The screening results from D. Calmodulin-CKK was inserted after the indicated residue in TEV, within the context of scFLARE as shown in A. This experiment was performed once with three technical replicates per condition (red lines, mean). (F) Model of the best CaTEV design based on crystal structures of wild-type TEV protease (PDB ID: 1LVM) and calmodulin:CKK complex (PDB ID: 1CKK). The CaM-CKK fusion is inserted between His-61 and Gly-62 of TEV protease. (G) The incorporation of ultraTEV mutations (16) into scFLARE. The same assay as in E, but the light + Ca2+ stimulation time was only 30 s. This experiment was performed once with three technical replicates per condition. (H) Confocal imaging of scFLARE activity in HEK293T cells. scFLARE1 (insertion site 61) was expressed with UAS:mCherry reporter and stimulated for 30 s with blue light and CaCl2 + ionomycin. Cells were fixed, permeabilized, and stained with anti-V5 antibody 8 h later to detect scFLARE expression (scale bars, 20 μm.) This experiment was repeated two times.
Fig. 2.
Fig. 2.
Characterization of scFLARE1 in HEK 293T cells. (A) scFLARE1 has lower background than two-component FLARE2 (16). HEK 293T cells expressing the indicated constructs and UAS:mCherry were stimulated for 5 min and analyzed by FACS 8 h later. GFP is fused to TEV protease in FLARE2, and it is expressed via p2a in scFLARE1 (TM-CaTEV(uTEV1Δ)-hLOV-TEVcs-Gal4-p2A-GFP). Ratios in the top left of each FACS plot indicate the number of cells within the red box region divided by the number of cells in Q4. (B) Western blot analysis of scFLARE1 cleavage. HEK cells expressing scFLARE1 were prepared and stimulated (for 5 or 10 min) as in Fig. 1E. Immediately after stimulation, cells were lysed in the presence of 2 mM iodoacetamide (TEV protease inhibitor) and run on 9% SDS/PAGE. scFLARE1 is 145 kDa before cleavage and 32 kDa (V5-containing portion) + 113 kDa after cleavage. BAPTA-AM was added to control cells not receiving Ca2+ stimulation. (C) Constructs used to test scFLARE1 cleavage mechanism. The V5-tagged TF construct lacks a TEVcs. The HA-tagged TF has an inactive protease (C151A mutation (31); DeadCaTEV). (D) The indicated constructs were expressed in HEK 293T cells along with UAS:mCherry. Cells were stimulated for 5 min with light and Ca2+ and then fixed, stained, and imaged 8 h later. The bottom row coexpresses high-affinity TEV protease (GFP tagged) with the HA-tagged DeadCaTEV construct to show that the latter can still be cleaved to generate mCherry reporter signal. Scale bars, 10 μm.
Fig. 3.
Fig. 3.
scFLARE2 characterization in neurons. (A) Summary of how scFLARE1 was converted to scFLARE2 for use in neurons. (B) Table of CaM variants tested in scFLARE. (C) Screening results for CaM variants in scFLARE. Rat cortical neuron cultures were transduced with scFLARE and TRE:mCherry AAV1/2s. At DIV18, neurons were stimulated with light (467 nm, 60 mW/cm2, 33% duty cycle (2 s every 6 s)) and high Ca2+ (5-s electrical trains consisting of 32 1-ms 50-mA pulses at 20 Hz) for 15 min. Neurons were fixed, immunostained with anti-VP16 antibody, and imaged by confocal microscopy 18 h later. Quantitation of mCherry intensity divided by scFLARE expression (VP16 intensity) was performed across 10 fields of view per condition (red bar, mean). This experiment was performed twice. (D) Confocal images of the best scFLARE variant (scFLARE2) from the experiment in C (scale bars, 10 μm). (E) scFLARE2 is specific for simultaneous (top row) rather than sequential (middle and bottom rows) light and calcium inputs. Ca2+ was elevated by electrical stimulation as in C. In the case of sequential inputs, a 15-min pause separated the two inputs. This experiment was repeated twice. SI Appendix, Fig. S6 shows the same experiment with only a 1-min pause between sequential inputs. (F) scFLARE2 time course. The same conditions as in C were used, but stimulation times varied from 2.5 min to 20 min. Red lines, mean (light + high Ca2+ condition). Blue lines, mean (only light condition). This experiment was performed twice. (G) Representative confocal images from the experiment in F. Additional fields of view are shown in SI Appendix, Fig. S7. (H) scFLARE2 activation is dependent on stimulation frequency. The same conditions as in C were used, but the frequency of electrical stimulation delivered varied from 2 to 20 s over a period of 15 min. Red lines, mean of 10 fields of view per condition. This experiment was performed twice. (I) Representative confocal images from the experiment in H. Additional fields of view are shown in SI Appendix, Fig. S8.
Fig. 4.
Fig. 4.
scFLARE2 comparison to FLARE1/2 and Cal-Light. (A) The constructs used to test FLARE1, FLARE2, and scFLARE2 in neurons. FLARE2 differs from FLARE1 in its protease and LOV domain (16). (B) A comparison of FLAREs in rat cortical neuron cultures. The neurons were transduced with AAVs encoding the indicated constructs and TRE:mCherry. At DIV18, neurons were stimulated with light (467 nm, 60 mW/cm2, 33% duty cycle [2 s every 6 s]) and electrical field stimulation to raise intracellular Ca2+ (5-s electrical trains consisting of 32 1-ms 50-mA pulses at 20 Hz) for 15 min. Neurons were fixed, immunostained with anti-VP16 antibody, and imaged by confocal microscopy 18 h later. (C) A more detailed comparison of scFLARE2 and FLARE2 at different expression regimes. For high expression, neurons were transduced with fourfold more virus than typically used. For nonstoichiometric expression, we used 0.25:1 ratio of protease:TF for FLARE2 rather than the typical 1:1 ratio. Otherwise conditions were the same as in B. (D) A quantification of the experiment in C (high expression condition). The mCherry/VP16 intensity ratio is plotted for 10 fields of view per condition. Red lines, mean. This experiment was performed twice. Additional fields of view are shown in SI Appendix, Fig. S10. (E) A comparison of scFLARE2 and Cal-Light (7). The rat cortical neuron cultures were transduced with AAV1/2s encoding scFLARE2 or Cal-Light constructs along with TRE:mCherry. The stimulation and imaging conditions were the same as in B. This experiment was performed twice. Additional fields of view are shown in SI Appendix, Fig. S11. (F) A quantification of the experiment in E. Scale bars, 10 μm.
Fig. 5.
Fig. 5.
scFLARE2 drives channelrhodopsin expression for neuron reactivation. (A) Schematic of reactivation of scFLARE-tagged neurons. bReaChES is a channelrhodopsin that can be activated by green 530-nm light. (B) Light- and activity-dependent expression of mCherry-p2A-bReaChES in scFLARE2-expressing rat cortical neuron cultures. The neurons were transduced with AAVs at DIV12, and stimulation (467 nm light at 60 mW/cm2, 33% duty cycle [2 s every 6 s] + 6-s electrical trains consisting of 32 1-ms 50-mA pulses at 20 Hz for a total of 15 min) was performed at DIV18. Cells were fixed and stained with anti-VP16 antibody 18 h after stimulation (scale bars, 10 μm). Additional fields of view are shown in SI Appendix, Fig. S12. (C) A quantification of the experiment in B, with 10 fields of view per condition. (D) Reactivation of scFLARE2-labeled neurons 18 h after light and electrical stimulation. (i-iv) The neurons expressing mCherry and bReaChES from the experiment in B (high Ca2+, light condition) were analyzed by whole-cell patch clamp electrophysiology. (v-viii) The control neurons expressing mCherry only (scFLARE2-driven expression from TRE promoter) were analyzed in the same manner. Firing could be elicited by a 350-pA depolarizing current injection in both ii and vi. However, optically induced action potentials in response to 15 ms green light (530-nm) stimulation at 16 Hz and an optically induced inward current from 1 s light stimulation were observed only in bReaChES-expressing cells iii and iv (n = 6/6) and not in control cells vii and viii (n = 3/3). Scale bars in i and v, 20 µm.
Fig. 6.
Fig. 6.
scFLARE2 labeling in vivo. (A) Concentrated AAV viruses encoding scFLARE2 and TRE:mCherry were injected bilaterally into the hippocampus and cortex of adult mice. After 6 to 7 d of expression, an optical fiber was implanted in both left and right hemispheres, and blue light was delivered to the right hemisphere via the optical fiber (single 10-min session of 473-nm light at 10 mW, 50% duty cycle [2 s light every 4 s]), while mice were subject to either kainate treatment (right hemisphere, dispensed 2 h before light treatment), regular awake conditions (no treatment), or anesthesia. Mice were perfused and immunostained for imaging analysis 18 to 24 h later. (B) An example EEG trace recorded around the time of light stimulation (blue bar). The pink line indicates when the seizure detection system detected a seizure and light delivery was started. The green boxed region shows the EEG signal leading up to the light trigger. The yellow boxed region is an EEG signal showing an example behavioral seizure occurring during the light stimulation. (C) Representative confocal fluorescence images of both hemispheres, following the experiment in A. Activated scFLARE2 drives expression of mCherry (in red), while immunostaining for VP16 (in cyan) shows expression of the tool (scale bars, 10 μm). (D) Quantification of scFLARE2 activation. For each brain hemisphere, we quantified the total mCherry fluorescence intensity divided by scFLARE expression across seven consecutive brain sections around the virus injection site (three to five fields of view for each section). A total of four to six mice per condition were analyzed. See SI Appendix, Fig. S13 for additional fields of view from several animals. The errors bars reflect the SEM; ****P < 0.0001; one-way ANOVA with Tukey post hoc test. (E) To label downstream neurons indirectly activated during seizure, concentrated AAV viruses encoding scFLARE2 and TRE:mCherry were injected into the hippocampus and cortex of adult mice in the left hemisphere contralateral to kainate injection (right hemisphere). After 6 to 7 d of expression, an optical fiber was implanted and blue light was delivered to the left hemisphere (same parameters as in A), while mice were subject to either kainate treatment (dispensed 2 h before light treatment) or regular awake conditions (no treatment). Mice were perfused and immunostained for imaging analysis 18 to 24 h later. (F) Representative confocal fluorescence images of the left hemisphere. Activated scFLARE2 drives expression of mCherry (in red), while immunostaining for VP16 (in cyan) shows expression of the tool (scale bars, 10 μm). See SI Appendix, Fig. S14 for additional fields of view from several animals. Negative controls are from animals not receiving any light. (G) Quantification of scFLARE2 activation. For each animal (2 mice per condition), we quantified the total mCherry fluorescence intensity divided by scFLARE expression across seven consecutive brain sections around the virus injection site (three to five fields of view for each section). Errors bars reflect the SEM; ****P < 0.0001; one-way ANOVA with Tukey post hoc test.

References

    1. Fields S., Song O., A novel genetic system to detect protein-protein interactions. Nature 340, 245–246 (1989). - PubMed
    1. Kim M. W., et al. , Time-gated detection of protein-protein interactions with transcriptional readout. eLife 6, e30233 (2017). - PMC - PubMed
    1. Kipniss N. H., et al. , Engineering cell sensing and responses using a GPCR-coupled CRISPR-Cas system. Nat. Commun. 8, 2212 (2017). - PMC - PubMed
    1. Kim C. K., Cho K. F., Kim M. W., Ting A. Y., Luciferase-LOV BRET enables versatile and specific transcriptional readout of cellular protein-protein interactions. eLife 8, e43826 (2019). - PMC - PubMed
    1. Talay M., et al. , Transsynaptic mapping of second-order taste neurons in flies by trans-tango. Neuron 96, 783–795.e4 (2017). - PMC - PubMed