. 2020 Dec 15;11(6):e03059-20.
doi: 10.1128/mBio.03059-20.

Merkel Cell Polyomavirus Encodes Circular RNAs (circRNAs) Enabling a Dynamic circRNA/microRNA/mRNA Regulatory Network

Affiliations

Merkel Cell Polyomavirus Encodes Circular RNAs (circRNAs) Enabling a Dynamic circRNA/microRNA/mRNA Regulatory Network

Bizunesh Abere et al. mBio. .

Abstract

Viral noncoding RNAs have acquired increasing prominence as important regulators of infection and mediators of pathogenesis. Circular RNAs (circRNAs) generated by backsplicing events have been identified in several oncogenic human DNA viruses. Here, we show that Merkel cell polyomavirus (MCV), the etiologic cause of ∼80% of Merkel cell carcinomas (MCCs), also expresses circular RNAs. By RNase R-resistant RNA sequencing, four putative circRNA backsplice junctions (BSJs) were identified from the MCV early region (ER). The most abundantly expressed MCV circRNA, designated circMCV-T, is generated through backsplicing of all of ER exon II to form a 762-nucleotide (nt) circular RNA molecule. Curiously, circMCV-T, as well as two other less abundantly expressed putative MCV circRNAs, overlaps in a complementary fashion with the MCV microRNA (miRNA) locus that encodes MCV-miR-M1. circMCV-T is consistently detected in concert with linear T antigen transcripts throughout infection, suggesting a crucial role for this RNA molecule in the regulatory functions of the early region, known to be vital for viral replication. Knocking out the hairpin structure of MCV-miR-M1 in genomic early region expression constructs and using a new high-efficiency, recombinase-mediated, recircularized MCV molecular clone demonstrates that circMCV-T levels decrease in the presence of MCV-miR-M1, underscoring the interplay between MCV circRNA and miRNA. Furthermore, circMCV-T partially reverses the known inhibitory effect of MCV-miR-M1 on early gene expression. RNase R-resistant RNA sequencing of lytic rat polyomavirus 2 (RatPyV2) identified an analogously located circRNA, stipulating a crucial, conserved regulatory function of this class of RNA molecules in the family of polyomaviruses.IMPORTANCE Covalently closed circular RNAs were recently described in the human DNA tumor viruses Epstein-Barr virus (EBV), Kaposi's sarcoma-associated herpesvirus (KSHV), and human papillomavirus (HPV). Here, we show that MCV, another DNA tumor virus, generates circRNAs from its early regulatory region in concert with T antigen linear transcripts. MCV circMCV-T interacts with another MCV noncoding RNA, miR-M1, to functionally modulate early region transcript expression important for viral replication and long-term episomal persistence. This work describes a dynamic regulatory network integrating circRNA/miRNA/mRNA biomolecules and underscores the intricate functional modulation between several classes of polyomavirus-encoded RNAs in the control of viral replication.

Keywords: Merkel cell carcinoma; Merkel cell polyomavirus; T antigen; circular RNA; micro RNA; noncoding RNA; polyomaviruses.


Figures

FIG 1
FIG 1
Identification of MCV-encoded circRNAs by RNase R+ RNA sequencing. (A) Schematic representation of the MCV genome organization. Structures of known MCV early transcripts are shown. Positions of splice donor or acceptor sites are shown by vertical dashed lines and/or numbers. Known mRNAs are represented with solid arrows, while protein products are shown as boxes. Dashed lines show sequences that are spliced out of the indicated RNA transcript. (B, bottom) RNase R+ RNA sequence coverage of MCV-HF in transfected 293 cells after 5 days of transfection. Sequence reads from the forward strand (blue) and reverse strand (red) are shown. (Top) Schematic representation of the four putative MCV-encoded circRNA backsplice junctions (BSJs) mapped to the MCV-HF genome. Red arrows show backsplicing directions. The percentage of each putative circRNA BSJ count from the ER is shown in a pie chart (right). The sequencing result is from one experiment.
FIG 2
FIG 2
Validation and characterization of circMCV-T in MCC-derived cell lines and primary tumor tissues. (A) Schematic representation of MCV T-Ag transcripts and circMCV-T. Divergent primer pairs used for circMCV-T RT-PCR are shown with color codes. (B) Schematic representation of expected PCR products using each primer pair in panel A. (C and D) Expression profiles of circMCV-T in MCC cell lines (Waga, MKL-1, MKL-2, CVG-1, MS-1) and MCV genome (MCV-HF)-transfected 293 cells (C) and in patient-derived tumor samples (MCC 1 to 3) (D) in the presence and absence of RNase R treatment are detected by RT-PCR using the indicated divergent primer pairs (DP) for circMCV-T and conventional convergent primer pairs for linear transcripts (sT, 57kT, LT, and β-actin). Untransfected 293 cells were used as a negative control, and linear RNAs were used as an RNase R digestion control. See Table 2 for the location of each primer on the MCV genome. (E) RPAD was performed on RNase R-treated RNA from 293 cells transfected with the MCV-HF genome for 5 days. The cellular circRNA SMARCA5 is used as a control that should not be depleted after RPAD treatment, while U6 was used as linear RNA control that should be depleted by RPAD. Each result represents a single experiment. Numbers at the left of the blots are molecular sizes in base pairs.
FIG 3
FIG 3
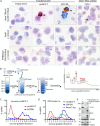
In situ detection and polysome fractionation of circMCV-T. (A) Detection of MCV circMCV-T BSJ by BaseScope in situ hybridization. Representative images from 293 cells transfected with an expression vector for circMCV-T or MCV ER (early region) are shown. CVG-1, an MCV+ MCC cell line with circMCV-T detectable by RT-PCR, shows an abundance of linear T-Ag transcripts (blue) compared with circMCV-T transcripts (red). 293 cells transfected with an empty vector were used as a negative control. The red signal represents the detection of circMCV-T, the cellular control POLR2A, or the bacterial negative-control gene DapB, while the blue signal represents staining for linear T-Ag RNA or the cellular control gene PPIB. Images were originally acquired at a ×40 magnification. (B) Polysome fractionation assay workflow created using BioRender.com. (C and D) RT-qPCR of circMCV-T (red), linear T-Ag (green), and GAPDH (blue) transcripts performed on polysome fractions from (C) pLaccase-circMCV-T-transfected (no linear T-Ag is produced from this expression construct and was therefore not assessed) and (D) MCV-HF-hpko mc-transfected 293 cells. (E) Western blot of MCV-encoded proteins from the MCV early (LT, 57KT, ALTO, and sT) regions from MCV-HF-mc-transfected 293 cells on which polysome fractionation is depicted in panel C with α-tubulin used as a protein internal control. Experiments whose results are represented in panels C, D, and E were each performed at least two times.
FIG 4
FIG 4
The presence of MCV miR-M1 decreases circMCV-T levels. (A) Schematic representation of MCV circMCV-T and miR-M1 features. Mature MCV-miR-M1-5P and -3P binding sites are shown as red arrows, and sequence features at the miRNA binding site are represented at the top. Divergent primers (orange) and a BSJ spanning TaqMan probe (red) are used for circMCV-T qPCR amplification. (B) Expression of circMCV-T and T-Ag RNA from MCV early region expression constructs containing either a wt or hpko mutation for MCV miR-M1. (C) Expression of T antigen proteins (LT, 57KT, and ALTO) from panel B. (D) RT-PCR detection of circMCV-T expressed from a pLaccase-circMCV-T construct in the presence and absence of MCV-miR-M1 using the indicated divergent primer pairs 48 h after transfection of 293 cells. (E) RT-qPCR quantification of circMCV-T levels from a pLaccase-circMCV-T construct in the presence of either wt or hpko mutant MCV miR-M1 48 h posttransfection of 293 cells. Results in panels C and D are representative of three independent experiments. CT values were normalized to RNase P (B) or GAPDH (E) CT values, and samples were normalized to pER-wt (B)- or wt miR-M1 (E)-transfected cells to calculate fold change. Error bars in panels B and E represent means ± standard deviations (SD) from three independent experiments. Statistical analysis was performed on ΔΔCT values using an unpaired t test. *, P < 0.05; **, P < 0.01; ***, P < 0.001; ****, P < 0.0001.
FIG 5
FIG 5
Effect of circMCV-T on MCV early transcript expression and viral replication. (A and B) 293 cells were transfected with the MCV miR-M1 or the circMCV-T wt or hpko mutant expression vector for 48 h, and RT-qPCR was performed for circMCV-T (A) and miR-M1-5P (B). (C) 293 cells were transfected with pCMV-ER wt or hpko constructs together with the circMCV-T wt or hpko mutant expression vector or an empty vector (EV) control for 48 h. RT-qPCR was performed for circMCV-T and for linear transcripts sT and LT as well as miR-M1-5P. CT values were normalized to RNase P or GAPDH CT values, and samples were normalized to EV-transfected cells for both the wt and hpko MCV ER construct to calculate fold change. Bars and error bars in panel C indicate means ± SD from three independent experiments. Statistical analysis was performed using an unpaired t test in panel A, an unpaired t test with Welch’s correction in panel B, and ordinary one-way analysis of variance (ANOVA) in panel C. Significance levels: *, P < 0.05; **, P < 0.01; ***, P < 0.001; ****, P < 0.0001; ns, not significant. (D and E) 293 cells were cotransfected with a wt or hpko mutant MCV-HF mc construct together with a circMCV-T wt or hpko mutant expression vector or an EV control. Cells were collected after 2 and 4 days of transfection. (D) Western blot analysis of MCV-encoded proteins (LT, 57kT, ALTO, sT, and VP1; α-tubulin was used as an internal control). (E) Quantification of the replicated (DpnI-resistant) MCV genome by qPCR analysis. Genomic GAPDH was used to normalize CT values, and relative levels of the MCV genome were calculated according to the ΔΔCT method. Bars and error bars represent means ± SD from 3 replicates. Results are representative of three independent experiments.
FIG 6
FIG 6
Working model for MCV circMCV-T regulation of MCV T-Ag expression. MCV miR-M1 is incorporated into the RISC complex, which will target both circMCV-T and linear T-Ag transcripts. If circMCV-T absorbs the miR-M1-loaded RISC complex, linear T-Ag transcripts will be stabilized and T-Ag expression will increase. In the absence of circMCV-T, linear T-Ag transcripts will be degraded by the miR-M1-induced RISC complex, which leads to inhibition of T-Ag expression and, therefore, MCV replication.

References

    1. Feng H, Shuda M, Chang Y, Moore PS. 2008. Clonal integration of a polyomavirus in human Merkel cell carcinoma. Science 319:1096–1100. doi:10.1126/science.1152586. - DOI - PMC - PubMed
    1. Theiss JM, Gunther T, Alawi M, Neumann F, Tessmer U, Fischer N, Grundhoff A. 2015. A comprehensive analysis of replicating Merkel cell polyomavirus genomes delineates the viral transcription program and suggests a role for mcv-miR-M1 in episomal persistence. PLoS Pathog 11:e1004974. doi:10.1371/journal.ppat.1004974. - DOI - PMC - PubMed
    1. Carter JJ, Daugherty MD, Qi X, Bheda-Malge A, Wipf GC, Robinson K, Roman A, Malik HS, Galloway DA. 2013. Identification of an overprinting gene in Merkel cell polyomavirus provides evolutionary insight into the birth of viral genes. Proc Natl Acad Sci U S A 110:12744–12749. doi:10.1073/pnas.1303526110. - DOI - PMC - PubMed
    1. Shuda M, Feng H, Kwun HJ, Rosen ST, Gjoerup O, Moore PS, Chang Y. 2008. T antigen mutations are a human tumor-specific signature for Merkel cell polyomavirus. Proc Natl Acad Sci U S A 105:16272–16277. doi:10.1073/pnas.0806526105. - DOI - PMC - PubMed
    1. Kwun HJ, Guastafierro A, Shuda M, Meinke G, Bohm A, Moore PS, Chang Y. 2009. The minimum replication origin of Merkel cell polyomavirus has a unique large T-antigen loading architecture and requires small T-antigen expression for optimal replication. J Virol 83:12118–12128. doi:10.1128/JVI.01336-09. - DOI - PMC - PubMed

Publication types

MeSH terms