. 2021 Feb;40(5):997-1011.
doi: 10.1038/s41388-020-01563-x. Epub 2020 Dec 15.

Hormonal modulation of ESR1 mutant metastasis

Affiliations

Hormonal modulation of ESR1 mutant metastasis

Guowei Gu et al. Oncogene. 2021 Feb.

Erratum in

  • Correction to: Hormonal modulation of ESR1 mutant metastasis.
    Gu G, Tian L, Herzog SK, Rechoum Y, Gelsomino L, Gao M, Du L, Kim JA, Dustin D, Lo HC, Beyer AR, Edwards DG, Gonzalez T, Tsimelzon A, Huang HJ, Fernandez NM, Grimm SL, Hilsenbeck SG, Liu D, Xu J, Alaniz A, Li S, Mills GB, Janku F, Kittler R, Zhang XH, Coarfa C, Foulds CE, Symmans WF, Andò S, Fuqua SAW. Gu G, et al. Oncogene. 2022 Jan;41(3):460. doi: 10.1038/s41388-021-02104-w. Oncogene. 2022. PMID: 34782721 Free PMC article. No abstract available.

Abstract

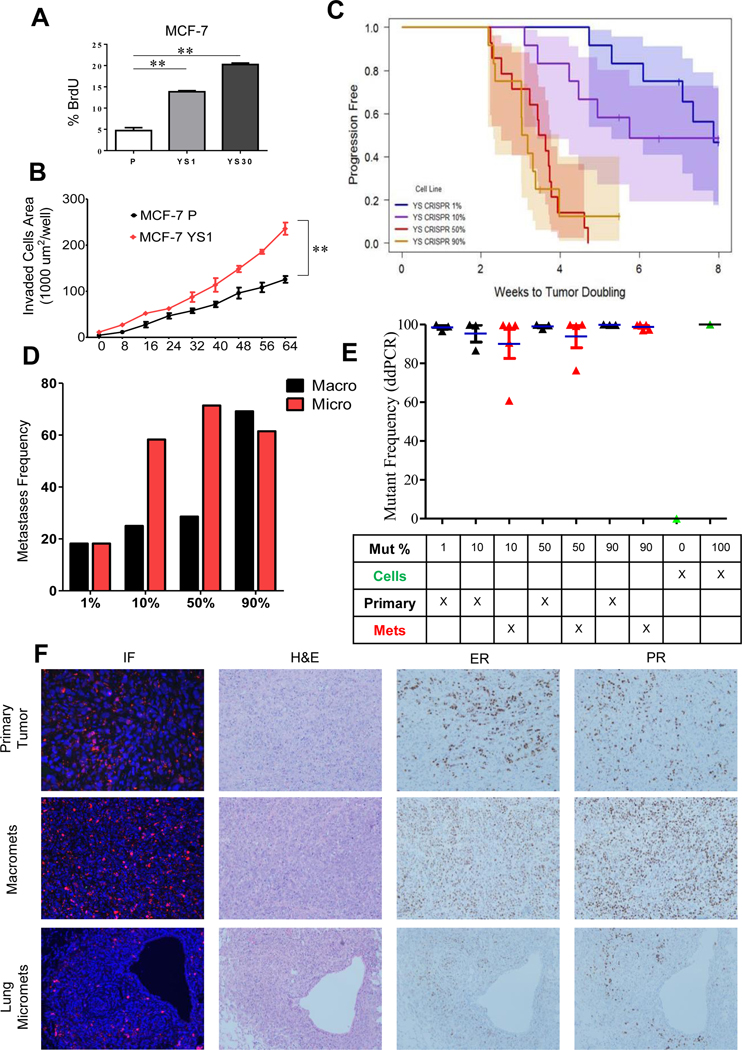
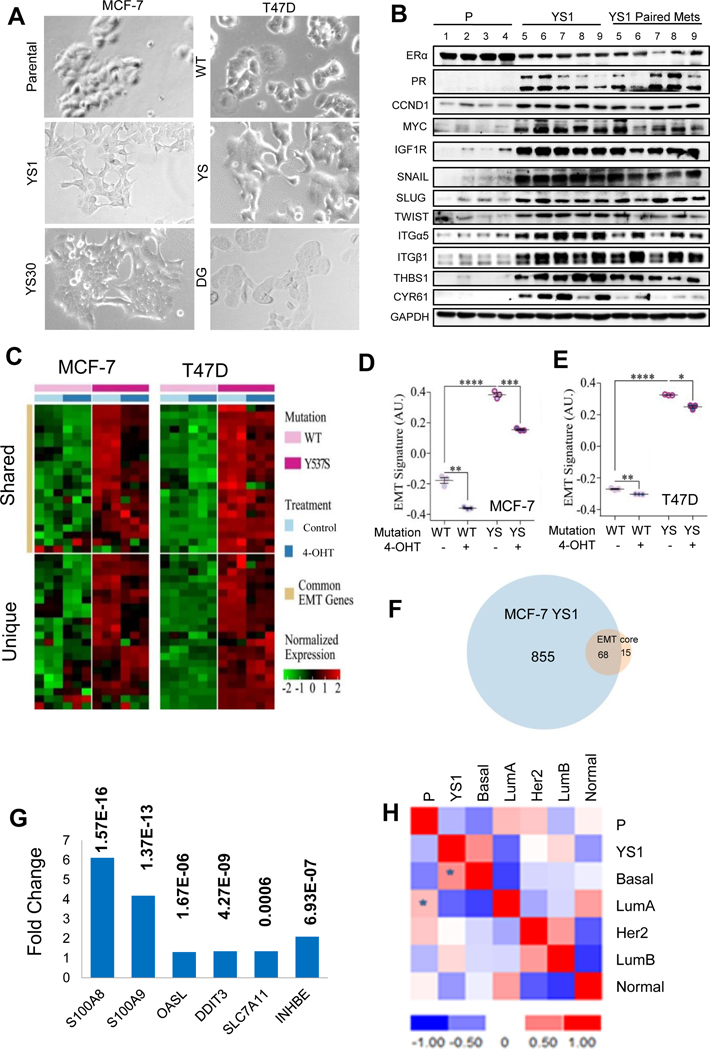
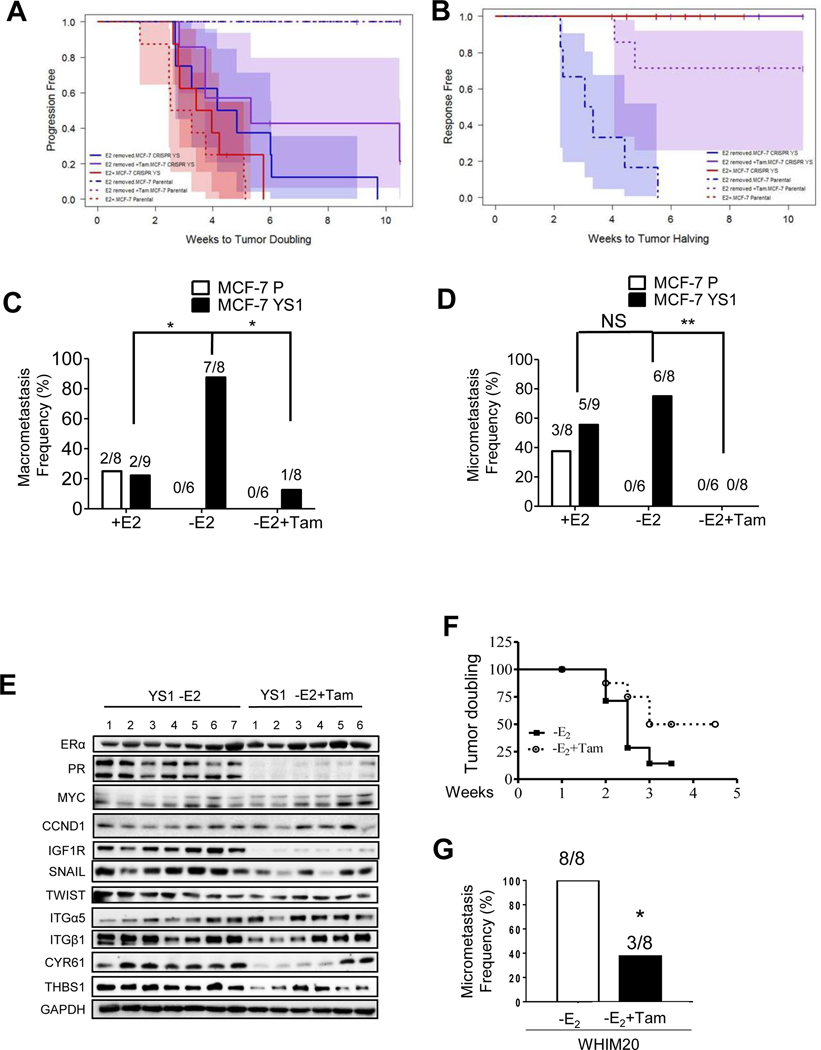
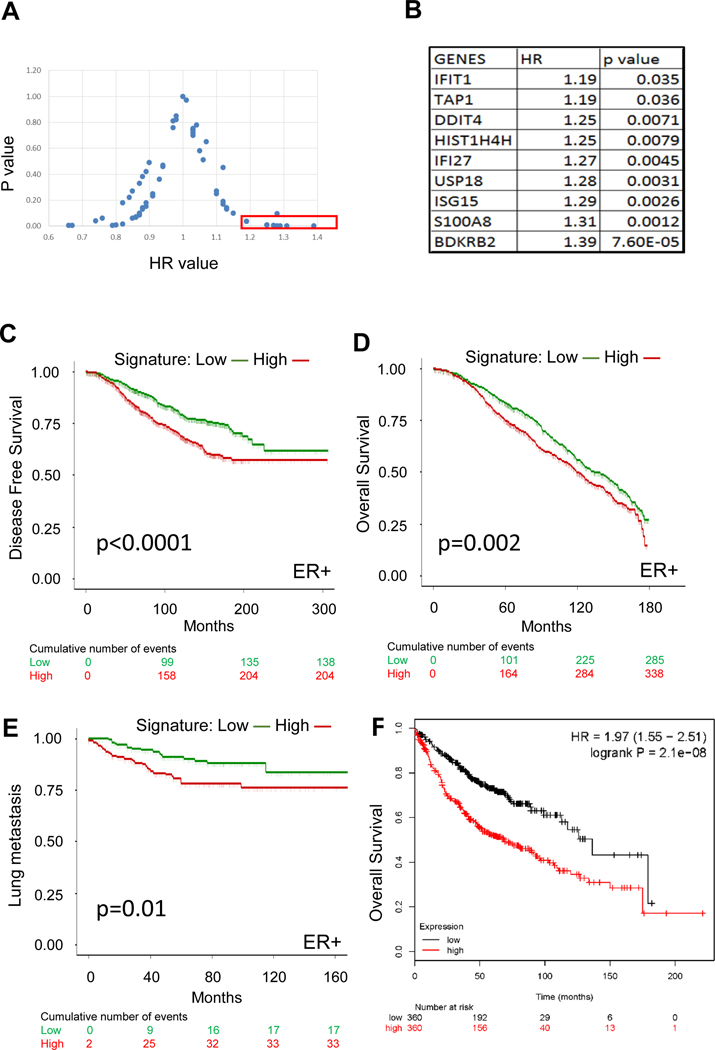
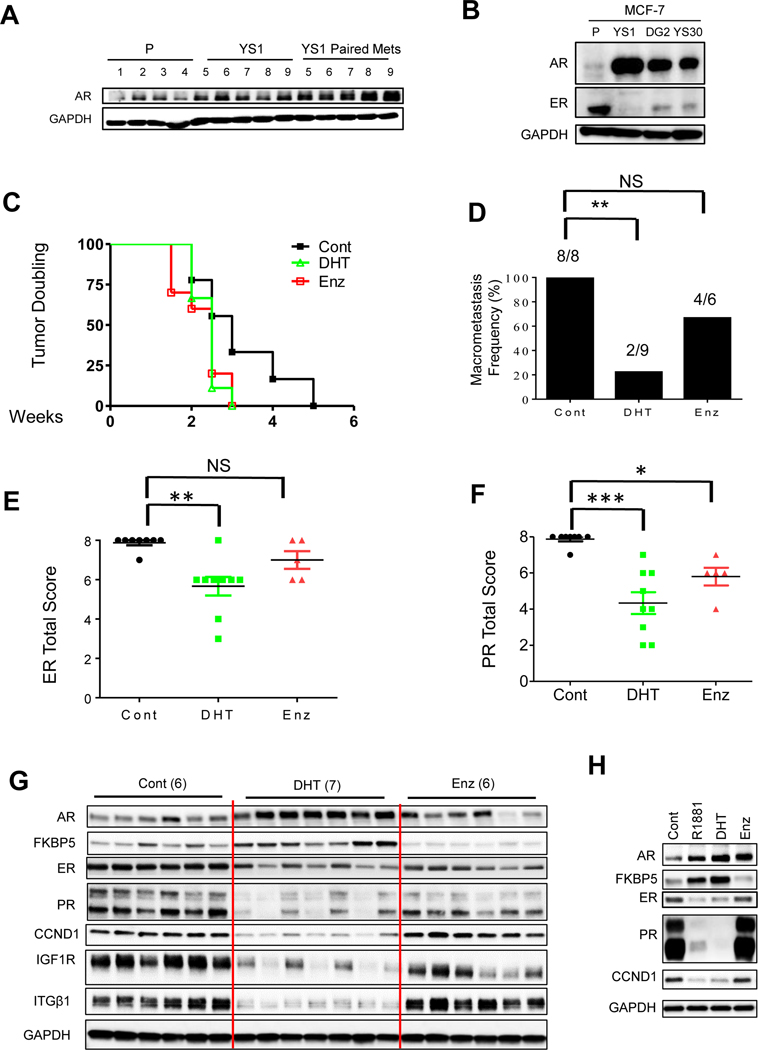
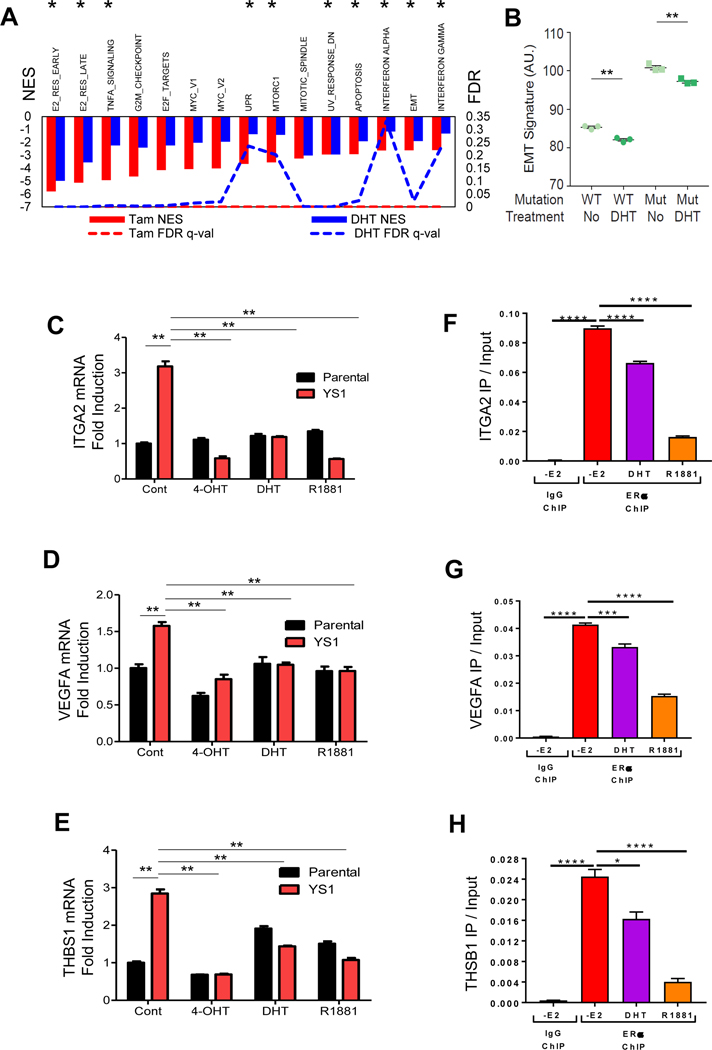
Estrogen receptor alpha gene (ESR1) mutations occur frequently in ER-positive metastatic breast cancer, and confer clinical resistance to aromatase inhibitors. Expression of the ESR1 Y537S mutation induced an epithelial-mesenchymal transition (EMT) with cells exhibiting enhanced migration and invasion potential in vitro. When small subpopulations of Y537S ESR1 mutant cells were injected along with WT parental cells, tumor growth was enhanced with mutant cells becoming the predominant population in distant metastases. Y537S mutant primary xenograft tumors were resistant to the antiestrogen tamoxifen (Tam) as well as to estradiol (E2) withdrawal. Y537S ESR1 mutant primary tumors metastasized efficiently in the absence of E2; however, Tam treatment significantly inhibited metastasis to distant sites. We identified a nine-gene expression signature, which predicted clinical outcomes of ER-positive breast cancer patients, as well as breast cancer metastasis to the lung. Androgen receptor (AR) protein levels were increased in mutant models, and the AR agonist dihydrotestosterone significantly inhibited estrogen-regulated gene expression, EMT, and distant metastasis in vivo, suggesting that AR may play a role in distant metastatic progression of ESR1 mutant tumors.


Conflict of interest statement

Disclosure of Potential Conflicts of Interest

1. Dr. Charles E. Foulds discloses: an equity position in Coactigon, Inc.

2. Dr. Filip Janku discloses:

a) Grant/Research Funding (Institutional): Novartis, Genentech, BioMed Valley Discoveries, Plexxikon, Deciphera, Piqur, Symphogen, Bayer, FujiFilm Corporation and Upsher-Smith Laboratories, Astex, Asana, Astellas, Agios, Proximagen, Bristol-Myers Squibb;

b) Scientific Advisory Board: Deciphera, IFM Therapeutics, Synlogic, Guardant Health, Ideaya, PureTech Health;

c) Paid Consultant: Trovagene, Immunomet, Jazz Pharmaceuticals, Sotio;

d) Ownership Interests: Trovagene.

3. Dr. Gordon B. Mills discloses:

a) SAB/Consultant: AstraZeneca, Chrysallis Biotechnology, GSK, ImmunoMET, Ionis, Lilly, PDX Pharmaceuticals, Signalchem Lifesciences, Symphogen, Tarveda, Turbine, Zentalis Pharmaceuticals

b) Stock/Options/Financial: Catena Pharmaceuticals, ImmunoMet, SignalChem, Tarveda;

c) Licensed Technology: HRD assay to Myriad Genetics, DSP patents with Nanostring

4. Dr. Shunqiang Li discloses:

a) The Washington Unversity PDX development and trial center is supported by NIH 3U54CA224083-02S3.

b) Dr. Shunqiang Li has received license fee from Envigo. He received research funding from Pfizer, Takeda Oncology, and Zenopharm, outside of this project.

Figures

Fig. 1.
Fig. 1.
The Y537S ESR1 mutant becomes the predominant cell type in vivo. A. % BrdU incorporation was measured in MCF-7 parental (P), MCF-7 YS1 (YS1) and MCF-7 YS30 (YS-30) cells growing in the absence of E2. Data presented as mean ± SD in triplicate, with P values from the Student t test. **, P <0.01. B. IncuCyte invasion assay was performed in MCF-7 parental and YS1 mutant cells in triplicate in the absence of E2. Invaded cell surface area on the bottom membrane was calculated. Data presented as mean ± SD in triplicate with P values from two way ANOVA analysis. **, P <0.01. C. Primary tumor growth of MCF-7 parental and YS1 cells were analyzed (1%, 10%, 50%, and 90% mutant cells injected) using Kaplan-Meier progression-free survival curves. Mice were kept with E2 supplementation until tumor growth reached 250–350 mm3, and then switched to –E2 until the end of the study. Data are presented as tumor doubling estimated by the Kaplan-Meier method and compared using the Generalized Wilcoxon test for multiple comparisons (P values are shown in Supplementary Table. 1). D. Frequency of distant macrometastasis and lung micrometastasis per group is shown. Trend calculated using Chi-square test. *** P <0.001. E. ESR1 mutation frequency in primary and matched distant metastases (Met) between mixing groups was determined using ddPCR (n=3/group). Three mice per group were analyzed. Some mice had more than one macrometastasis (total number of tumor samples are labeled). There was insufficient tissue from the 1% metastasis group for analysis. MCF-7 parental and YS1 cells were used as negative and positive controls for ddPCR assays, respectively. F. Immunofluorescence staining was performed for GFP (parental) and mCherry-tagged (YS1) reporter plasmids to visualize ESR1 mutant or WT cells, respectively, within primary and metastatic tumors. Representative H&E, ER, and PR IHC staining of primary and metastatic tumors from Fig.1C are shown.
Fig. 2.
Fig. 2.
Y537S ESR1 mutants exhibit an EMT phenotype. A. Bright field images of ESR1 mutant MCF-7 and T47D cell lines growing in serum-containing medium. B. Immunoblot analysis of MCF-7 parental (n=4) and YS1 (n=5) primary /metastatic pairs growing after E2 withdrawal using indicated antibodies. C. Heat map representation of upregulated EMT genes expressed in common (upper panel) or unique (lower panel) in MCF-7 Y537S (YS1) and T47D Y537S cells compared to corresponding WT cells. D and E. EMT signature was shown from MCF-7 parental (WT) and YS1 (YS) or T47D Lenti WT and YS models. Cell were treated +/− 4-OHT for 24 hours in serum containing medium. The signature value is shown on the Y axis (AU arbitrary units): Data displayed as mean ± SD. Statistical significance calculated using Student t test, *, P <0.05 **, P <0.01 ***, P <0.001, ****, P <0.0001. F. Gene List Venn Diagram (http://genevenn.sourceforge.net/) was used to identify shared overexpressed genes in MCF-7 YS1 vs parental compared to the EMT core signature. G. Fold change average gene expression of six elevated genes in ER+/HER2- metastatic (n= 97) compared to primary (n= 276) breast cancers. P values are shown. Data analyses were performed in R version 3.5.1 and Bioconductor. Statistical significance was determined using the unpaired Student t-test. H, Gene expression of MCF-7 parental cells and MCF-7 YS1 cells grown in 5% CSS without E2 summarized in a correlation matrix were patterned with all five PAM50 centroids. Data calculated by Spearman’s Rank, with highest positive correlations denoted by *.
Fig. 3.
Fig. 3.
Tam treatment blocked metastasis in ESR1 mutant tumors. A and B. MCF-7 parental and YS1 mutant cells were injected in nude mice supplemented in E2 and randomized to three treatment armsto continue E2 (+E2), E2 removal (-E2) or E2 removal +Tam (-E2+Tam). Time to tumor doubling or halving are shown in A and B respectively using Kaplan-Meier method (P values showed in Supplementary Table 9 and 10). C and D. Number of mice that developed macrometastasis or lung micrometastasis in each treatment arm are shown. Data were analyzed using chi-square and Fisher’s exact test. * P <0.05, ** P <0.01, NS= no significant. E. Immunoblot analysis of primary tumors from MCF-7 YS1 mutant tumors treated with E2 withdrawal (-E2) (N=7) or -E2 +Tam (N=6). F. The frequency of lung micrometastasis were evaluated in WHIM20 PDX models grown in absence of E2 (-E2) or -E2+Tam. Time to tumor doubling was calculated using Kaplan-Meier method and analyzed using Log-rank (Mantel-Cox) Test. P=0.0978. G. After 5 months, mice were harvested and the frequency of lung micrometastasis was analyzed using chi-square and Fisher’s exact test. * P <0.05.
Fig. 4.
Fig. 4.
The Y537S ESR1 mutant signature is prognostic of patient outcomes. A. The expression of 63 genes was evaluated for recurrence free survival using KM Plotter in ER-positive breast cancer patients. HR and P values for each gene are represented as a scatter plot. B. 9 genes from panel A with HR value >1 and p value <0.05 are shown. C and D. The predictive value of the 9 gene signature was evaluated for disease free (P value =1.97e−6, HR=1.691 (1.362–2.1)) and overall survival (P value =7.1e−4, HR=1.302 (1.117–1.617)) in ER-positive patients from the METABRIC dataset using Kaplan-Meier analysis [24]. E. Kaplan-Meier analysis were performed using the MCF-7 Y537S 9-gene signature in EMC-MSK breast cancer datasets [25]. Lung metastases as first site of metastasis were considered events. P value =0.0096, HR =2.128 (1.185–3.822) for ER-positive patient cohort. F. KM Plotter was used to correlate the 9 gene expression signature with patient overall survival using a lung adenocarcinoma cancer patient cohort [49]. Patients were separated into 2 groups (median cut off) based on their average expression of the 9 genes. HR was calculated to be 1.97 (1.55–2.51) with a significant P value of 2.1e-8. Low versus high signature stratification was calculated using sum of z-scores method. Statistical significance was calculated by log-rank test in Kaplan-Meier analyses. Hazard Ratios was calculated using Cox Proportional-Hazards model noted above with 95% confidence interval.
Fig. 5.
Fig. 5.
AR agonist treatment blocked Y537S mutant metastasis. A. Immunoblot analysis of MCF-7 parental (n=4) and YS1 (n=5) primary /metastatic pairs grown with E2 withdrawal. B. Western blot analysis of MCF-7 parental, YS1, DG, and YS30 clones cultured in 5% CSS media for 4 days GAPDH was used as loading control. C. Mice with WHIM20 PDX tumors were supplemented with E2, and randomized to –E2, -E2+DHT or –E2+Enz for total of 4 months. Time to tumor doubling was calculated using Kaplan-Meier method. Data were analyzed using Log-rank (Mantel-Cox) Test. P= 0.10 for DHT vs vehicle control and P= 0.07 for MDV vs vehicle control. D. Macrometastasis frequency was calculated and displayed chi-square and fisher exact analyses, * P =0.002. E and F. ER and PR total score IHC staining two-sided Student’s t-test was performed to test significance. *P <0.05, **P <0.01,* P <0.001, NS=Not significant. G. Western blot analyses of WHIM20 primary tumors; GAPDH was used as a loading control. H. Western blot analyses of MCF-7 YS1 cells; performed using in vitro cell line protein lysis and GAPDH was used as a loading control. Cells were starved for 48 hours in 5% CSS, and then treated with hormones for 24 hours.
Fig. 6.
Fig. 6.
DHT treatment regulates mutant EMT gene expression through the ER cistrome. A. MCF-7 YS1 cells were grown in 5% CSS medium +/− DHT, or +/− 4-OHT in serum-containing media for 24 hours. Microarray analyses were performed and Hallmark pathways were identified. Hallmarks labeled with * were pathways constitutively upregulated in YS1 mutant cells (Supplementary Table 3). B. MCF-7 parental and YS1 cells were treated in 5% CSS medium +/− DHT and an EMT gene signature value was calculated (based on shared 21 EMT genes shown in Supplementary Table 6). DHT vs control P values were 0.0017 and 0.0052 for parental (WT) and YS1 (Mut) respectively. Data were analyzed using Student t test. C-E. MCF-7 YS1 cells were treated with either 4-OHT, DHT or R1881 in 5% CSS media for 72 hours. ITGA2, THBS1 and VEGFA mRNA expression was measured using qRT-PCR (Primers shown in Table 1) and normalized against 18S expression. Data were analyzed using Student t test. F-H. Binding of ER to EMT gene regulatory regions was determined using ChIP-PCR in YS1 cells treated with 100 nM 4-OHT, 10 nM DHT, or 10 nM R1881 for 4 hours (Primers shown in Table 2). Error bars represent the standard error of the mean (n = 3 technical replicates). Each set of technical replicates were independently validated with a second experiment (not shown). Data were analyzed by one-way ANOVA with Holm-Sidak Multiple comparisons test. ** P<0.01. * P<0.05, ** P<0.01, *** P<0.001, **** P< 0.0001.

References

    1. N.A. Howlader N, Krapcho M, Miller D, Bishop K, Altekruse SF, et al., SEER Cancer Statistics Review, 1975–2013, National Cancer Institute. Bethesda, MD, http://seer.cancer.gov/csr/1975_2013/, based on November 2015 SEER data submission, posted to the SEER web site, April 2016.
    1. Klein CA, Selection and adaptation during metastatic cancer progression. Nature, 2013. 501(7467): p. 365–72. - PubMed
    1. Fuqua SA, The role of estrogen receptors in breast cancer metastasis. J Mammary Gland Biol Neoplasia, 2001. 6(4): p. 407–17. - PubMed
    1. Herynk MH and Fuqua SA, Estrogen receptor mutations in human disease. Endocr Rev, 2004. 25(6): p. 869–98. - PubMed
    1. Jeselsohn R, Bergholz JS, Pun M, Cornwell M, Liu W, Nardone A, et al., Allele-Specific Chromatin Recruitment and Therapeutic Vulnerabilities of ESR1 Activating Mutations. Cancer Cell, 2018. 33(2): p. 173–186 e5. - PMC - PubMed

Publication types

MeSH terms