. 2020 Nov 13:14:605332.
doi: 10.3389/fncir.2020.605332. eCollection 2020.

Homotopic Commissural Projections of Area Prostriata in Rat and Mouse: Comparison With Presubiculum and Parasubiculum

Affiliations

Homotopic Commissural Projections of Area Prostriata in Rat and Mouse: Comparison With Presubiculum and Parasubiculum

Chang-Hui Chen et al. Front Neural Circuits. .

Abstract

Area prostriata in primates has recently been found to play important roles in rapid detection and processing of peripheral visual, especially fast-moving visual information. The prostriata in rodents was not discovered until recently and its connectivity is largely unknown. As a part of our efforts to reveal brain-wide connections of the prostriata in rat and mouse, this study focuses on its commissural projections in order to understand the mechanisms underlying interhemispheric integration of information, especially from peripheral visual field. Using anterograde, retrograde and Cre-dependent tracing techniques, we find a unique commissural connection pattern of the prostriata: its layers 2-3 in both hemispheres form strong homotopic commissural connections with few heterotopic projections to bilateral medial entorhinal cortex. This projection pattern is in sharp contrast to that of the presubiculum and parasubiculum, two neighbor regions of the prostriata. The latter two structures project very strongly to bilateral medial entorhinal cortex and to their contralateral counterparts. Our results also suggest the prostriata is a distinct anatomical structure from the presubiculum and parasubiculum and probably plays differential roles in interhemispheric integration and the balancing of spatial information between two hemispheres.

Keywords: cre- dependent tracing; entorhinal cortex; interhemispheric connections; parasubiculum; presubiculum; prostriata.


Figures

Figure 1
Figure 1
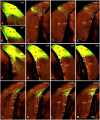
Borders and layers of the prostriata in mouse. Each row shows sequential rostral (left) to caudal (right) coronal sections. (A–E) Rfx3-ISH-stained sections showing the location, extent, and topography of layers 2-3 of the prostriata which have strong Rfx3 expression. Weak and no Rfx3 expression was seen in the PrS (layer 2) and PaS, respectively. (F–J) Cpne7-ISH-stained sections showing the location, extent and topography of the prostriata. Strong Cpne7 expression was seen in layers 2–3 and 5 of the prostriata. Note the gradient of Cpne7 expression in the PaS with strong and weak expression in ventral and dorsal PaS, respectively. Strong Cpne7 expression was also observed in layers 2, 3, and 5 of the EC with few in layer 6. (K–O) Slc17a6-ISH-stained sections showing the strong expression in layers 2-3 of the prostriata, PrS and PaS with little expression in adjoining cortical regions. Note the gradient of Slc17a6 expression in the PaS with strong and weak expression in dorsal and ventral PaS, respectively. (P–T) Wfs1-ISH-stained sections showing the location, extent, and topography of the PaS, which display strong Wfs1 expression. Note the lack of expression in the prostriata and PrS. PrSd (i.e., postsubiculum) is seen in more rostral sections (not shown, but see Lu et al., 2020). Raw ISH data in this figure were downloaded from Allen Mouse Brain Atlas (mouse.brain-map.org). Bar: 420 μm in A (for all panels).
Figure 2
Figure 2
Location and contralateral projections of the prostriata in rat. (A,B) Location and lamination of the prostriata in Nissl-stained sections. (C–H) A biotinylated dextran amine (BDA) injection in the prostriata resulted in densely labeled axon terminals, mainly in layers 2-3 of contralateral prostriata [showing from lateral (C) to medial levels (H) in sequential sagittal sections]. The injection site, at about level F of injection side, was involved in both deep and superficial layers of the prostriata (# in the inset of F) as well as overlying primary visual cortex (V1) but not in the PrSd. Note that no labeled axon terminals were seen in contralateral PrSd and PaS but sparsely labeled neurons were found in retrosplenial cortex (RS) and V1. Bars: 400 μm in A (for A,B); 400 μm C (for C–H).
Figure 3
Figure 3
Axon terminals and cells of origin of contralateral projections in rat. (A–C) (BDA labeling) and (D–F) (FG labeling) are at matched lateral-medial levels. The regions marked by “*” in each row show the corresponding part of the prostriata. (A–C) One BDA injection affected layers 5–6 and, slightly, layers 2–3 of the prostriata (# in the inset of B) and the overlying V1, resulting in weakly labeled axon terminals in layers 2–3 and 5–6 of contralateral prostriata. The injection, at about level B of injection side, was located slightly more lateral than that shown in Figure 2, and the labeled terminals tend to distribute in the ventral part of contralateral prostriata, marked by “*”. (D–F) One Fluoro-Gold (FG) injection affecting both the prostriata (# in the inset of F) and the overlying V1 resulted in densely labeled neurons in layers 2–3 of contralateral prostriata. The injection, at about level F of injection side, was located more medial than that shown in Figure 2 and contralaterally labeled neurons tend to distribute in the dorsal part of prostriata rather than the ventral part marked by “*”. Note that many labeled neurons were also seen in the retrosplenial cortex (RS) and V1. Bar: 400 μm in A (for all panels).
Figure 4
Figure 4
Cells of origin of contralateral projections of the prostriata and PrS in rat. (A–H) One FG injection in the prostriata and PrS resulted in neurons being densely labeled in layers 2–3 of prostriata and sparsely labeled in layer 2 of PrS (showing from lateral (A) to medial (H) levels in sequential sagittal sections). The injection site, at about level E of injection side, was centered in the prostriata (# in the inset in E), with some leakage in the PrS and RS but few in V1. Note the labeled neurons in the deep portion of contralateral RS (H). For orientation and shape of each section in this figure please refer to Figure 2. Bar: 500 μm in A (for all panels).
Figure 5
Figure 5
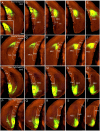
Contralateral projections of the prostriata in wild-type mouse. (A–E) An injection located in caudal visual cortex (V1 and V2L; # in A,B) resulted in weak and sparse axon terminal labeling in contralateral prostriata (C–E; mainly in layers 2-3). No labeling occurred in contralateral MEC, PrS, and PaS, while strong labeling occurred in V2L. (F–M) An injection involved in both the caudal visual cortex (V1 and V2L) and the prostriata (# in G,H) resulted in strong and dense terminal labeling in the contralateral prostriata (J–M). No labeling was found in the PaS, on either sides, nor in the contralateral MEC. On the ipsilateral side, weak terminal labeling was observed in the MEC (F–I; mainly deep layers) and PrSd (F; mainly layer 2). Bar: 400 μm in M (for all panels).
Figure 6
Figure 6
Ipsi- and contralateral projections from prostriata vs. PrS and PaS. Each row shows sequential rostral (left) to caudal (right) coronal sections from Slc17a6-IRES-Cre mice. (A–E) An injection site in the ventral PrSd (# in A,B), and the resulting terminal labeling in the ipsilateral prostriata (mainly in layers 2-3) and the medial entorhinal cortex (MEC; mainly in layers 2-3). Note the lack of labeling in PaS. (F–I) Contralateral terminal labeling in MEC, which mirrors the ipsilateral MEC labeling in location and density. No labeling occurred in the contralateral prostriata, PrS, nor the PaS. (J–M) An injection site involved in PrSd, PaS and prostriata (# in J,K) and the resulting terminal labeling in dorsal MEC (K–M). (N–R) Contralateral terminal labeling in prostriata, PaS and MEC. The dense labeling in PaS and MEC mirrors the ipsilateral labeling. Note the strong terminal labeling in contralateral prostriata (N–R; mainly in layers 2-3). Bar: 400 μm in B (for all panels).
Figure 7
Figure 7
Ipsi- and contralateral projections from PrS and PaS. Each row shows sequential rostral (left) to caudal (right) coronal sections. (A–E) An injection site in the dorsal PrSd (# in the inset in A) of a Scnn1a-Tg3-Cre mouse (the Cre is expressed predominantly in layer 3) and the resulting terminal labeling in the ipsilateral prostriata (mainly in layers 1–3) and the dorsal part of MEC (mainly in layers 2–3) (Figures 6A–E). (F–J) Contralateral terminal labeling in MEC, which mirrors the ipsilateral labeling in location and density. Note the lack of labeling in PrS, prostriata and PaS. (K–O) An injection site in the ventral PaS (# in L) of a Wfs1-Tg2-CreERT2 mouse (the Cre is expressed in layers 2–3 of the PaS; see Figures 1P-T) and the resulting terminal labeling in the ipsilateral ventral MEC (mainly in layers 2–3). No labeling was seen in the ipsilateral prostriata and PrS. (P–T) Terminal labeling in contralateral PaS and MEC, which mirrors the labeling in the ipsilateral side in location and density. Note the absence labeling in PrS and prostriata. Bar: 400 μm in A (for all panels).
Figure 8
Figure 8
Summary and comparison of commissural connections of the prostriata, PrS and PaS. A diagram showing strong prostriata projections to contralateral prostriata (solid red arrow) and strong PrS and PaS projections to contralateral MEC (solid blue and solid green arrows, respectively). The strong and weak homotopic commissural projections of the PaS (solid green arrow) and PrS (dashed blue arrow) are also indicated, respectively. The prostriata, PrS, and PaS in both hemispheres are color coded green, brown, and red, respectively (MEC was not color coded). The circle-arrows in each structure indicate dorsal-ventral orientation and topographical projections. The major layers of the cells of origin and axon terminations are also marked. The vertical dashed line indicates midline.

References

    1. Allman J. M., Kaas J. H. (1971). Representation of the visual field in striate and adjoining cortex of the owl monkey (Aotus trivirgatus). Brain Res. 35, 89–106. 10.1016/0006-8993(71)90596-8 - DOI - PubMed
    1. Barbas H. (1993). Organization of cortical afferent input to orbitofrontal areas in the rhesus monkey. Neuroscience 56, 841–864. 10.1016/0306-4522(93)90132-Y - DOI - PubMed
    1. Blackstad T. W. (1956). Commissural connections of the hippocampal region in the rat, with special reference to their mode of termination. J. Comp. Neurol. 105, 417–537. 10.1002/cne.901050305 - DOI - PubMed
    1. Boccara C. N., Sargolini F., Thoresen V. H., Solstad T., Witter M. P., Moser E. I., et al. . (2010). Grid cells in pre- and parasubiculum. Nat. Neurosci. 13, 987–994. 10.1038/nn.2602 - DOI - PubMed
    1. Burman K. J., Reser D. H., Yu H.-H., Rosa M. G. P. (2011). Cortical input to the frontal pole of the marmoset monkey. Cereb. Cortex 21, 1712–1737. 10.1093/cercor/bhq239 - DOI - PubMed

Publication types