

Comparative Transcriptome Analysis Reveals the Intensive Early Stage Responses of Host Cells to SARS-CoV-2 Infection
- PMID: 33324374
- PMCID: PMC7723856
- DOI: 10.3389/fmicb.2020.593857
Comparative Transcriptome Analysis Reveals the Intensive Early Stage Responses of Host Cells to SARS-CoV-2 Infection
Abstract
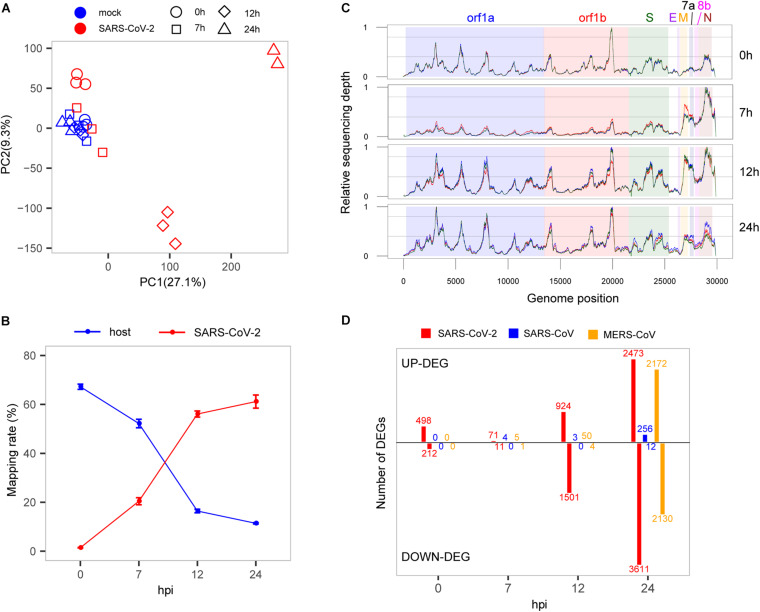
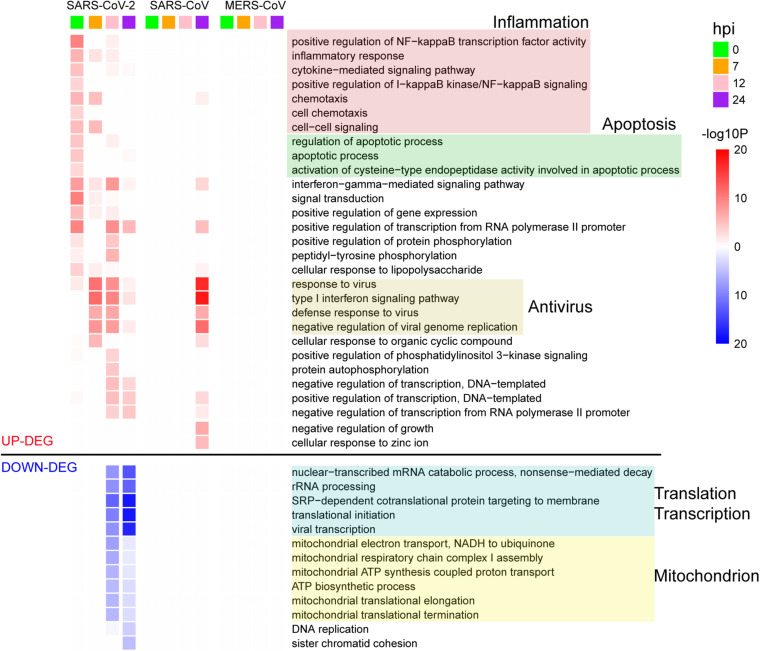
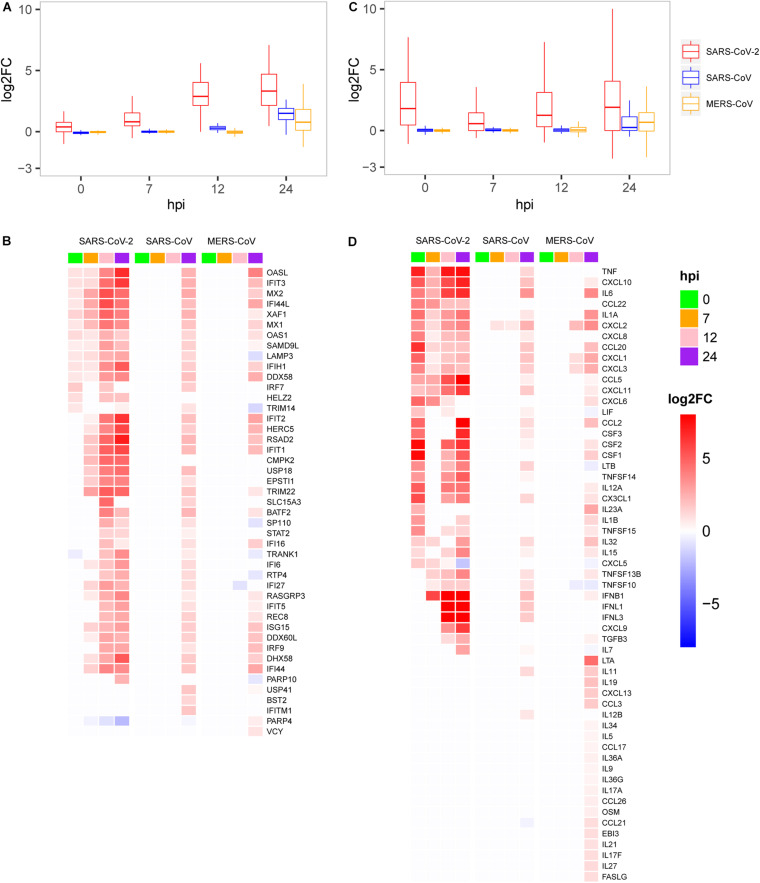
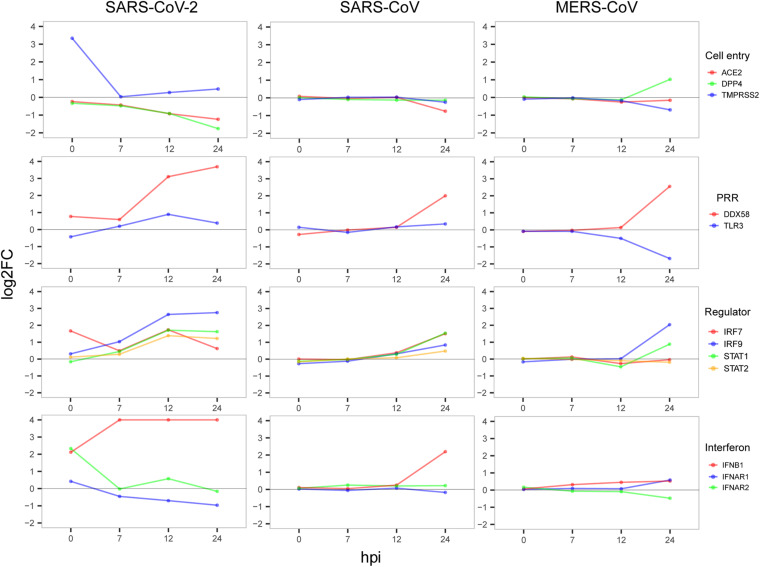
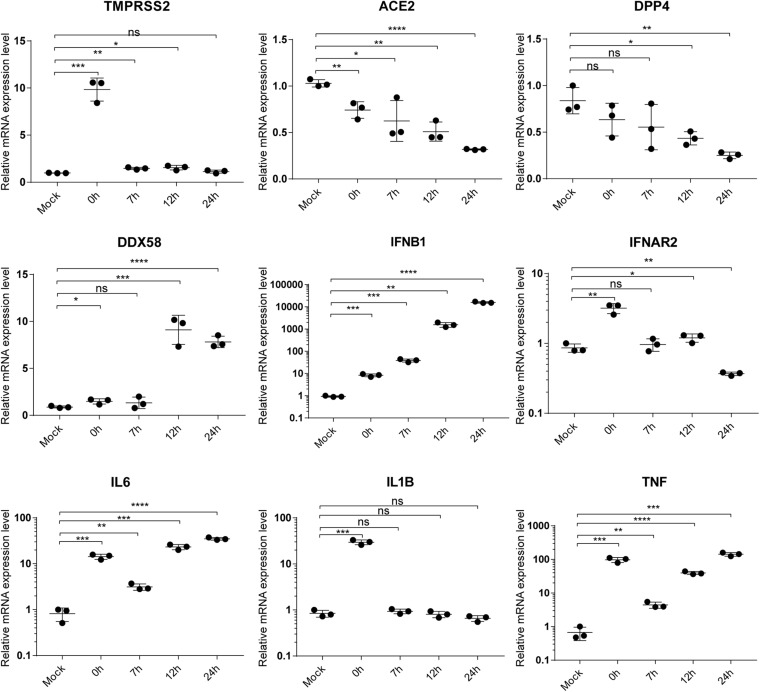
Severe acute respiratory syndrome coronavirus 2 (SARS-CoV-2) has caused a widespread outbreak of highly pathogenic coronavirus disease 2019 (COVID-19). It is therefore important and timely to characterize interactions between the virus and host cell at the molecular level to understand its disease pathogenesis. To gain insights, we performed high-throughput sequencing that generated time-series data simultaneously for bioinformatics analysis of virus genomes and host transcriptomes implicated in SARS-CoV-2 infection. Our analysis results showed that the rapid growth of the virus was accompanied by an early intensive response of host genes. We also systematically compared the molecular footprints of the host cells in response to SARS-CoV-2, SARS-CoV, and Middle East respiratory syndrome coronavirus (MERS-CoV). Upon infection, SARS-CoV-2 induced hundreds of up-regulated host genes hallmarked by a significant cytokine production, followed by virus-specific host antiviral responses. While the cytokine and antiviral responses triggered by SARS-CoV and MERS-CoV were only observed during the late stage of infection, the host antiviral responses during the SARS-CoV-2 infection were gradually enhanced lagging behind the production of cytokine. The early rapid host responses were potentially attributed to the high efficiency of SARS-CoV-2 entry into host cells, underscored by evidence of a remarkably up-regulated gene expression of TPRMSS2 soon after infection. Taken together, our findings provide novel molecular insights into the mechanisms underlying the infectivity and pathogenicity of SARS-CoV-2.
Keywords: Calu-3 cell; SARS-CoV-2; host early response; time-series transcriptome; tmprss2.
Copyright © 2020 Sun, Ye, Wu, Yang, Pan, Sheng, Zhu, Mao, Wang, Xia, Huang, Tan and Jiang.
Figures
References
-
- Blanco-Melo D., Nilsson-Payant B. E., Liu W.-C., Møller R., Panis M., Sachs D., et al. (2020). SARS-CoV-2 launches a unique transcriptional signature from in vitro, ex vivo, and in vivo systems. bioRxiv 10.1101/2020.03.24.004655 - DOI
LinkOut - more resources
Full Text Sources
Miscellaneous