. 2021 Mar;89(3):573-586.
doi: 10.1002/ana.25985. Epub 2020 Dec 24.

Characterization of the GABRB2-Associated Neurodevelopmental Disorders

Affiliations

Characterization of the GABRB2-Associated Neurodevelopmental Disorders

Christelle M El Achkar et al. Ann Neurol. 2021 Mar.

Erratum in

  • Correction.
    [No authors listed] [No authors listed] Ann Neurol. 2021 Nov;90(5):859. doi: 10.1002/ana.26215. Epub 2021 Oct 8. Ann Neurol. 2021. PMID: 34625987 No abstract available.

Abstract

Objective: We aimed to characterize the phenotypic spectrum and functional consequences associated with variants in the gene GABRB2, coding for the γ-aminobutyric acid type A (GABAA ) receptor subunit β2.

Methods: We recruited and systematically evaluated 25 individuals with variants in GABRB2, 17 of whom are newly described and 8 previously reported with additional clinical data. Functional analysis was performed using a Xenopus laevis oocyte model system.

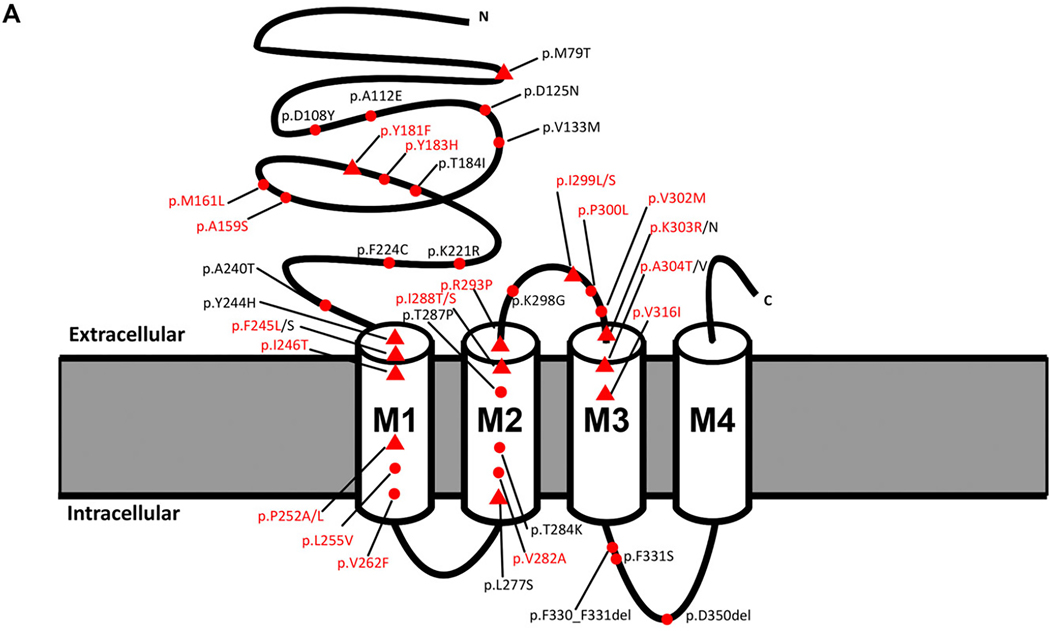
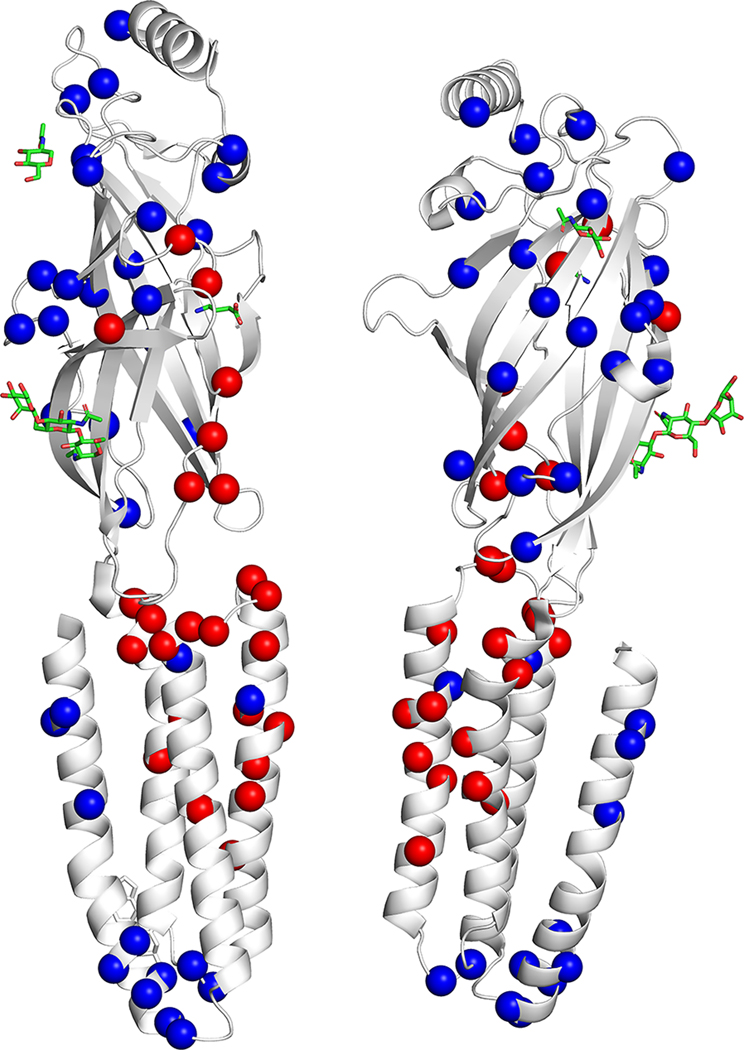
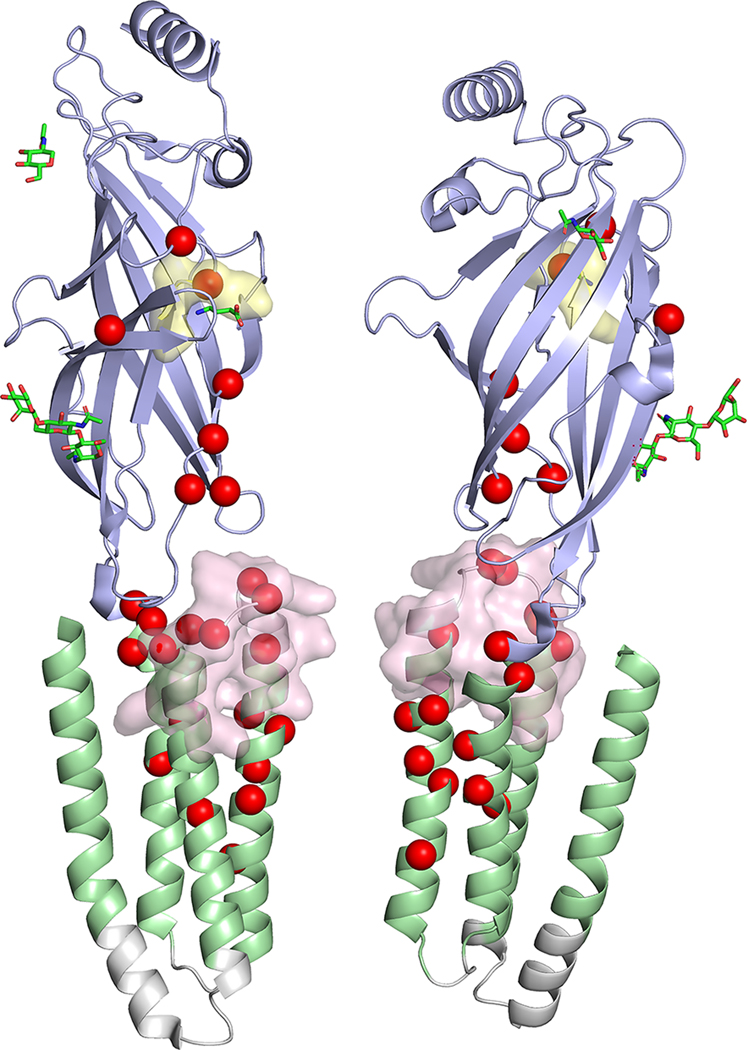
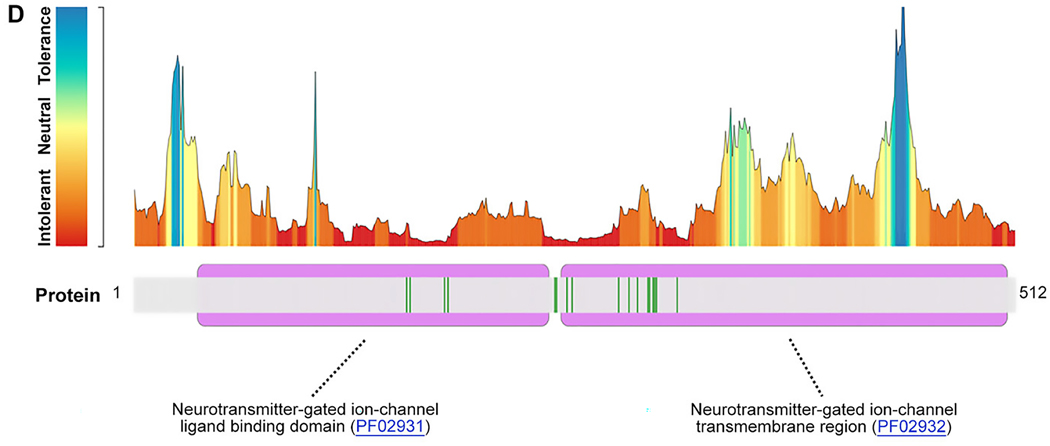
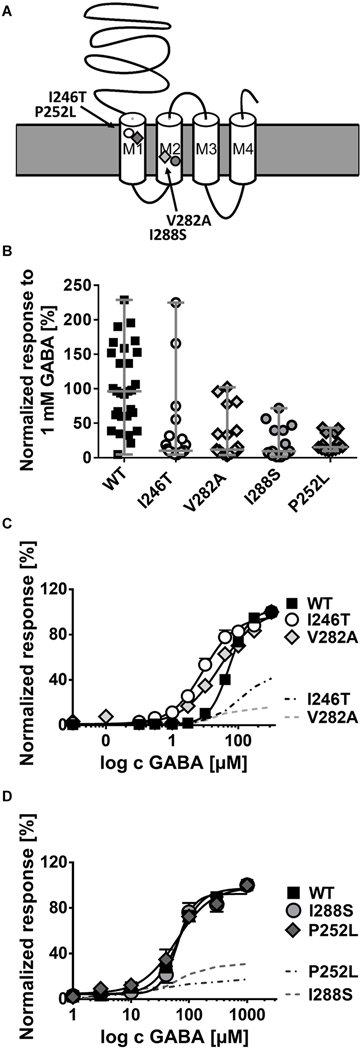
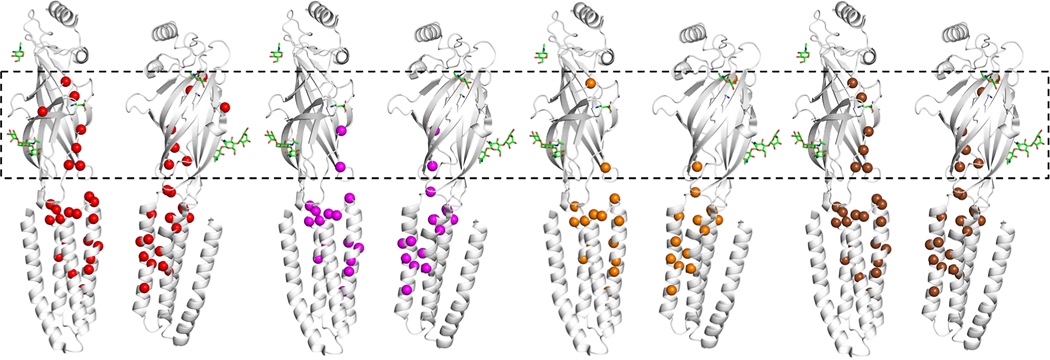
Results: Our cohort of 25 individuals from 22 families with variants in GABRB2 demonstrated a range of epilepsy phenotypes from genetic generalized epilepsy to developmental and epileptic encephalopathy. Fifty-eight percent of individuals had pharmacoresistant epilepsy; response to medications targeting the GABAergic pathway was inconsistent. Developmental disability (present in 84%) ranged from mild intellectual disability to severe global disability; movement disorders (present in 44%) included choreoathetosis, dystonia, and ataxia. Disease-associated variants cluster in the extracellular N-terminus and transmembrane domains 1-3, with more severe phenotypes seen in association with variants in transmembrane domains 1 and 2 and the allosteric binding site between transmembrane domains 2 and 3. Functional analysis of 4 variants in transmembrane domains 1 or 2 (p.Ile246Thr, p.Pro252Leu, p.Ile288Ser, p.Val282Ala) revealed strongly reduced amplitudes of GABA-evoked anionic currents.

Interpretation: GABRB2-related epilepsy ranges broadly in severity from genetic generalized epilepsy to developmental and epileptic encephalopathies. Developmental disability and movement disorder are key features. The phenotypic spectrum is comparable to other GABAA receptor-encoding genes. Phenotypic severity varies by protein domain. Experimental evidence supports loss of GABAergic inhibition as the mechanism underlying GABRB2-associated neurodevelopmental disorders. ANN NEUROL 2021;89:573-586.


Figures

FIGURE 1:
FIGURE 1:
Location of GABRB2 variants in our cohort, from the literature, and in control populations. (A) Variant location in individuals reported in this study (red text) and from the literature in a 2-dimensional model of the GABRB2 protein. Red spheres: single cases; red triangles: recurrent variants. (B) Location of missense variants in affected individuals (red spheres) and normal controls from gnomAD (blue spheres) mapped on the experimentally solved model of human β2-subunit (Protein Data Bank [PDB] ID: 6D6T, chain A and C). Disease-associated variants are in regions lacking variation in controls. (C) Disease-associated variant locations (red spheres) by β2-subunit protein domain (PDB ID: 6D6T, chain A and C). The extracellular and helical transmembrane domains are highlighted in purple and green, respectively. Two functionally critical regions, the agonist binding region (yellow, harbors the patient variant: p.Tyr181Phe) and the allosteric effector binding region (pink, contains 12 patient variants) are also shown in the structure. (D) GABRB2 tolerance landscape using MetaDome. Functional domains are highlighted in purple. Vertical green lines in the schematic representation of the GABRB2 protein indicate the locations where (likely) pathogenic missense variants were observed. From this visualization, it can be concluded that all missense variants locate to regions of GABRB2 that are intolerant to functional variation.
FIGURE 1:
FIGURE 1:
Location of GABRB2 variants in our cohort, from the literature, and in control populations. (A) Variant location in individuals reported in this study (red text) and from the literature in a 2-dimensional model of the GABRB2 protein. Red spheres: single cases; red triangles: recurrent variants. (B) Location of missense variants in affected individuals (red spheres) and normal controls from gnomAD (blue spheres) mapped on the experimentally solved model of human β2-subunit (Protein Data Bank [PDB] ID: 6D6T, chain A and C). Disease-associated variants are in regions lacking variation in controls. (C) Disease-associated variant locations (red spheres) by β2-subunit protein domain (PDB ID: 6D6T, chain A and C). The extracellular and helical transmembrane domains are highlighted in purple and green, respectively. Two functionally critical regions, the agonist binding region (yellow, harbors the patient variant: p.Tyr181Phe) and the allosteric effector binding region (pink, contains 12 patient variants) are also shown in the structure. (D) GABRB2 tolerance landscape using MetaDome. Functional domains are highlighted in purple. Vertical green lines in the schematic representation of the GABRB2 protein indicate the locations where (likely) pathogenic missense variants were observed. From this visualization, it can be concluded that all missense variants locate to regions of GABRB2 that are intolerant to functional variation.
FIGURE 2:
FIGURE 2:
Location of all disease-associated variants (red spheres) mapped on the experimentally solved model of human β2-subunit (Protein Data Bank ID: 6D6T, chain A and C), and variants associated with electroencephalographic encephalopathy (magenta spheres), movement disorder (orange spheres), and developmental disorder (brown spheres). Spatial distributions of variants by phenotypes show that patient variants located in the extracellular domain (in the dashed box) are mostly associated with developmental delay and less often with epileptic encephalopathy or movement disorder.
FIGURE 3:
FIGURE 3:
Functional analysis in Xenopus oocytes of 4 de novo GABRB2 variants associated with developmental and epileptic encephalopathies. (A) Schematic representation of the β2-subunit of the γ–aminobutyric acid type A (GABAA) receptor showing the localization of the variants. (B) Normalized current response to 1mM GABA application for α1β2γ2s wild-type (WT) receptors (n = 27), and receptors carrying the variants p.Val282Ala (V282A, n = 16), p.Pro252Leu (P252L, n = 14), p.Ile288Ser (I288S, n = 10), and p.Ile246Thr (I246T, n = 21) in the β2-subunit. Shown are all data points for each oocyte and median with range ***p<0.001, ****p<0.0001 (Kruskal-Wallis with Dunńs posthoc test). (C) Dose-response curve for WT (n = 10), I246T (n = 16) and V282A (n = 16) containing receptors after application of different GABA concentrations ranging from 0.001 μM to 1mM and normalization to the maximal GABA response for each cell. (D) Dose-response curve for WT (n = 21), p.Ile288Ser (I288S, n = 12) and p.Pro252Leu (P252L, n = 14) as in C. Shown in C and D are means ± SEM (error bars are sometimes smaller than symbol size).

References

    1. Baulac S, Huberfeld G, Gourfinkel-An I, Mitropoulou G, Beranger A, Prud’homme JF, et al. First genetic evidence of GABA(A) receptor dysfunction in epilepsy: a mutation in the gamma2-subunit gene. Nat Genet. 2001;28(1):46–8. - PubMed
    1. Burgess R, Wang S, McTague A, Boysen KE, Yang X, Zeng Q, et al. The Genetic Landscape of Epilepsy of Infancy with Migrating Focal Seizures. Ann Neurol. 2019;86(6):821–31. - PMC - PubMed
    1. Epi KC, Epilepsy Phenome/Genome P, Allen AS, Berkovic SF, Cossette P, Delanty N, et al. De novo mutations in epileptic encephalopathies. Nature. 2013;501(7466):217–21. - PMC - PubMed
    1. Hirose S Mutant GABA(A) receptor subunits in genetic (idiopathic) epilepsy. Prog Brain Res. 2014;213:55–85. - PubMed
    1. Kang JQ, Macdonald RL. Molecular Pathogenic Basis for GABRG2 Mutations Associated With a Spectrum of Epilepsy Syndromes, From Generalized Absence Epilepsy to Dravet Syndrome. JAMA Neurol. 2016;73(8):1009–16. - PMC - PubMed

Publication types

MeSH terms